- Working-age populations are falling or slowing in most major economies, pointing to a prolonged stretch of slower GDP growth.
- Intense corporate competition and increasing protectionism are likely outcomes in a world where the economic pie is not growing as fast as it has been.
- Selecting for an ability to grow sales and earnings in a constrained world should be the prime focus of the equity investor.
The decade beyond 2023 is likely to feature unusually slow economic growth across the developed world. This is a theme we laid out in our Global Insight 2022 Outlook a year ago back in December 2021. In our view, it holds important ramifications for investors ranging from the prospects for earnings and dividend growth, to average share price performance, to the relative attractiveness/unattractiveness of various sectors, and to the comparative valuations of individual stocks within sectors.
The nonpartisan Congressional Budget Office (CBO), the federal agency charged with analyzing the U.S. economy and budget for the U.S. Congress and regarded by many as the best long-term forecaster of the U.S. economy, looks for the decade following 2023 to feature the slowest pace of GDP growth since the end of WWII. Forecasts for the rest of the developed world including China, by the Organization for Economic Cooperation and Development, reveal a similar pervasive trend—even slower growth than what prevailed over the decade following the global financial crisis.
Why so slow? We believe the chief culprit behind this growth downshift is the fact that working-age populations (15–64) are falling or about to be falling in almost all developed countries. This is the unavoidable result of a decades-long decline in birth rates (see top exhibit on the next page), which have reached levels well below the replacement rate and are showing no signs of reversing.
This projected decline in the workforce is important because GDP growth for most countries is mostly explained by a combination of growth in the number of people employed each year plus the growth in output produced by each employee (productivity).
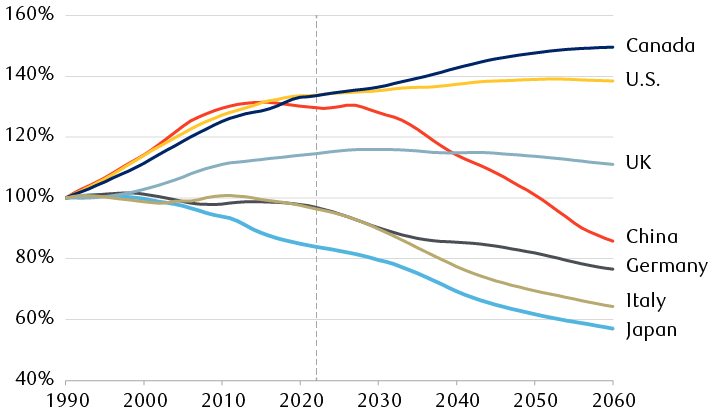
Working-age populations will grow more slowly—or continue to shrink
Populations aged 15–64 as percentage of their sizes in 1990

The line chart shows the size of the working-age population as a percentage of its 1990 size each year in several developed economies through 2022, and projections through 2060. Japan, 84% (2022), 57% (2060); China, 130%, 86%; U.S., 134%, 138%; Canada, 134%, 150%; Germany, 97%, 77%; UK, 115%, 111%; Italy, 96%, 64%.
Source - United Nations Department of Economic and Social Affairs
Japan: Canary in the coal mine?
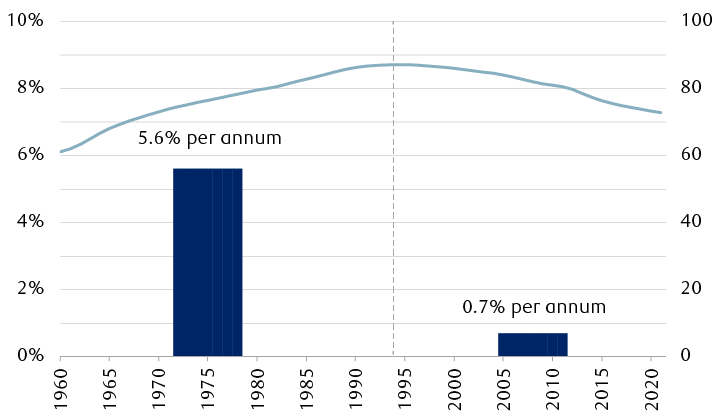
Japan provides a case in point. From 1960 until 1990 that country’s working-age population grew steadily and its GDP advanced by 5.6 percent per annum, consistently much faster than the U.S. economy (3.5 percent per annum over the same period). Many observers thought Japan would replace the U.S. as the world’s largest economy by the turn of the century.
Instead, in 1989, Japan endured a massive collapse of real estate and the stock market, crippling its banking system. A decade later Japan’s economy had regained its footing but its growth “mojo” had deserted it. In the early 1990s, its working-age population had begun declining, and that drop accelerated over the next 30 years. Over the interval 1991 to 2021 Japan’s GDP grew by less than one percent per annum.
It’s worth remembering that Japan is considered by many to be the most industrially sophisticated, advanced economy in the world with more technology imbedded in it and developed by it than any other. It has a well-educated, motivated workforce, universally admired and emulated management skills, together with more than a century of successfully exporting its goods and services. But despite all these strengths Japan’s GDP growth has been mired at something less than one percent per annum for three decades and counting.
Japan’s working-age population and two very different eras of GDP growth

The chart shows the size of Japan’s working-age population each year from 1960 through 2021, and compares it to the country’s GDP growth. From roughly 61 million in 1960, the working-age population grew steadily, peaking at roughly 87 million in 1994, and subsequently declined every year to roughly 73 million in 2021. Before 1994, the Japanese economy grew at around 5.6% per annum; during the subsequent period of working-age population declines, annual GDP growth was only 0.7%.
As Japan’s working-age population grew steadily from 1960 to 1994, so too did its economy. Real GDP grew at a compound annual rate of 5.6% per annum over that period, much faster than the 3.5% posted by the U.S.
But once Japan’s working-age population started falling after 1994, the country’s GDP growth rate crumbled to just 0.7% per annum; meanwhile, the U.S. grew more than three times faster at 2.4% per annum.
Source - United Nations Department of Economic and Social Affairs and the World Bank
Given Japan’s experience, it’s hard to look at the demographic projections and make a case for even average GDP growth for most of the developed countries including China. For the U.S. and Canada there may still be a modest addition to growth from some (slow) workforce growth but not enough by itself to make one confident of predicting a robust upward trajectory for GDP.
Is the working-age population decline inevitable?
An individual country could conceivably offset the labor force deficit brought about by low rates through immigration. But of the developed countries noted above, Japan remains effectively closed, China has shown no interest in welcoming foreigners, and the European electorate has been shaken by the migrant crisis into increasingly voting for anti-immigration candidates or for outright restrictions (Brexit).
While the U.S. remains theoretically open to newcomers, the combined effects of the Patriot Act and efforts to tighten the southern border have reduced the flow of newcomers considerably over the past 20 years. Canada is one of the few countries where immigration policies, already selective, have not become restrictive.
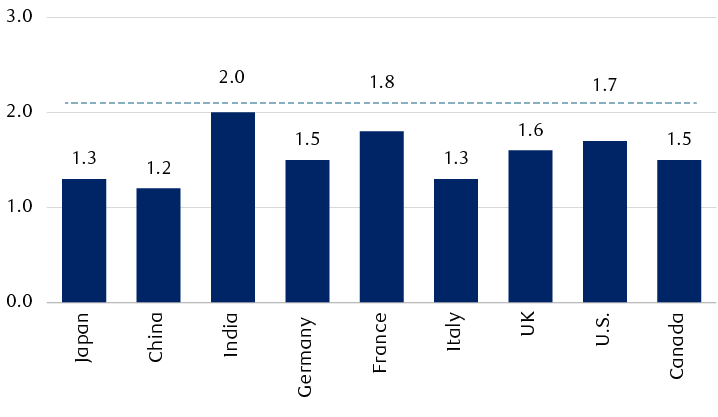
Fertility rates below the replacement level in developed economies
Number of births per woman

The column chart shows the number of births per woman for several developed economies. In all cases, the birth rate is below the generally accepted replacement level of 2.1. Japan, 1.3 births per woman; China, 1.2; India, 2.0; Germany, 1.5; France, 1.8; Italy, 1.3; UK, 1.6; U.S., 1.7; Canada, 1.5.
Note: The replacement birth rate, below which a country’s population tends to decline, is generally considered to be 2.1.
Source - United Nations Department of Economic and Social Affairs
It’s all up to productivity
As employment growth slows or goes into reverse under the influence of these trends in most developed economies, then it is our view what GDP growth there is will have to increasingly come by way of productivity gains.
Productivity is difficult to measure and has rarely been produced by intentional government policy. Rather, the starting point is usually the arrival of an important invention which, a decade or more down the road, provokes several rounds of innovation (and much skepticism). Many of these innovations fail, but some go on to have a transformative effect on the economy over many decades: think the steam engine, the telegraph, antiseptics, the internal combustion engine, electrification, antibiotics, telecommunications, large computers, the computer chip, the personal computer, and the internet.
What will be the next important driver of innovation and productivity gains? Although there are plenty of candidates touted as the next big thing—artificial intelligence, big data, self-driving vehicles, genetic engineering, 3D printing—it is difficult to have absolute conviction about any of them in terms of how much they will actually increase productivity.
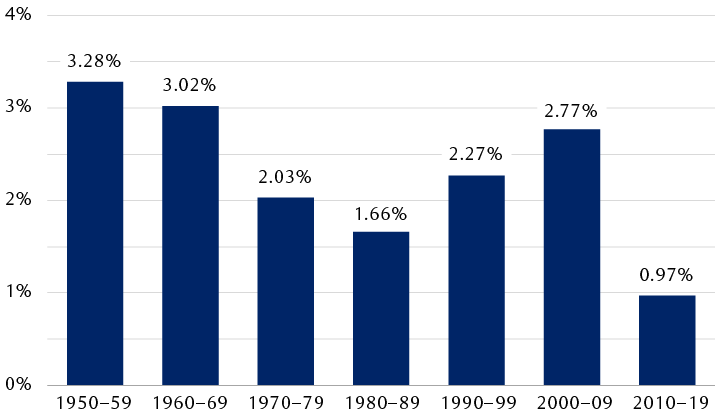
It is worth remembering that 2010–2019 was the slowest decade by far for U.S. productivity growth in the last 70 years, despite being an interval over which the smartphone went from a standing start to being ubiquitous over much of the world even as the device itself was going from being comparatively “dumb” to startlingly powerful. Meanwhile, over that stretch, online capacity increased by several orders of magnitude; businesses digitized at a rapid pace; and capital spending grew at more than twice the rate of the overall economy. And yet productivity did no better than creep higher at less than one percent per annum.
Of the past seven decades, 2010-19 delivered by far the slowest productivity gains
Average productivity increase per annum

The column chart shows the average annual productivity increase, aggregated by decade, from 1950 through 2019. 1950 to 1959, 3.28%; 1960 to 1969, 3.02%; 0.97%.
Source - U.S. Bureau of Labor Statistics
If the working-age population in the U.S. is growing at just the 0.3 percent per annum forecast by the United Nations and productivity gains are limited to something close to the 1.3 percent per annum average that has prevailed since the global financial crisis, then the combined result would be slower overall GDP growth—probably less than two percent per annum, right in line with the CBO’s forecast of 1.5 percent to 1.8 percent per annum for the decade.
Europe and China will be contending with similar “slow growth” dynamics. We think such a pronounced growth slowdown leads to some important conclusions for equity investing.
Selection rules
The first would be even greater intensity of corporate competition: when the total economic pie is growing more slowly than it has been, then each individual business has to work that much harder to maintain its share of the pie let alone gain share. In such a scrap the biggest and strongest will likely come out on top, but the second- and third-tier competitors are not going to simply lie there and accept their fate. We see another big wave of tech spending by businesses as the most obvious consequence of a long stretch of intense competition.
We believe that a second inevitable consequence of an extended stretch of much slower growth would be more protectionism. We saw that trend emerge in the last half of the prior decade. Now a growing list of countries and companies, shaken by the unexpected fragility of global supply chains, are moving toward mandating and building out greater domestic capacity for everything from vaccines and other biotechnologies to computer chips and defense procurements.
Building more domestic capacity may be good for capital spending for a few years, but the tit-for-tat response of trading partners to any restrictive trade barriers could take a toll on the sales and foreign earnings of exporters and multinationals.
In our view, a prolonged period of elevated competition will produce even greater corporate concentration. We think equity portfolios should lean toward companies that are likely to be in this dominant group at the end of the next decade. Selecting for a company’s ability to grow sales, earnings, and dividends as fast as, or faster than, the economy expands should permit a portfolio to deliver above-average returns and demonstrate more resilience in periods of economic downturn.

