
“The fox knows many things, but the hedgehog knows one big thing” is drawn from an ancient Greek parable resurrected from time to time to argue for the superiority or usefulness of thinking one way or the other. Like most people, in the long run, we think it would be more interesting to be the fox. But right here, right now, we feel more like the hedgehog … we know one big thing that is going to shape the investment landscape over the coming 12–18 months.
The Biggest Thing: A U.S. recession is on the way
First, it’s worth pointing out the U.S. is not yet in recession. The National Bureau of Economic Research (NBER) needs to see “a significant decline in economic activity that is spread across the economy and that lasts more than a few months.” No such decline has been in evidence yet. However, there are several factors at play that suggest to us such a broad-based economic decline will most probably arrive in the coming year:
1. History says so. The most historically reliable leading recession indicator—the position of short-term interest rates compared with that of long-term rates, also known as the “shape of the yield curve”—signaled back in July that a U.S. recession was on the way when the one-year Treasury yield rose above the yield on the 10-year note. Whenever such an “inversion” has occurred in the past a recession has eventually followed, usually about a year later.
The Conference Board’s Leading Economic Index—also sporting a “perfect” track record—fell below where it had been a year ago back in September. A recession has always followed such a signal, on average some two to three quarters later.
All but one of the other five leading indicators of recession we follow are all still in positive territory but are sliding (slowly) toward giving a negative signal for the U.S. economy in the coming months.
2. “Tight money” has arrived. With just two exceptions (the post-WWII downturn and the two-month-long 2020 pandemic recession) U.S. recessions have always been preceded by the arrival of tight money, i.e., prohibitively high interest rates accompanied by a growing reluctance of banks to lend.
The inversion of the yield curve in July, noted above, indicated credit conditions were heading in that restrictive direction. Certainly, interest rates have become prohibitively high for many borrowers as a result of the accelerated pace of tightening on the part of the Fed and most other important central banks. One result is that sharply higher mortgage rates have squashed the demand for both new and existing homes. Housing permits have fallen sharply, a strong indication to us that residential construction activity will sag in the coming months.
And loans are becoming harder to get too. The last three Senior Loan Officer Opinion Surveys (published every three months by the Fed) have shown that more and more U.S. banks are now raising lending standards (i.e., becoming more choosy about who they lend to) for almost all categories of consumer and business loans.
3. The consumer will be a waning force in 2023. At some 70 percent of GDP the direction of consumer spending is all-important. While there are still excess savings sitting in bank accounts and wages are rising, high inflation has pushed real incomes below where they were a year ago. Despite that, real personal spending has continued to climb. Additional borrowing is bridging the gap. Credit card debt is up by 20 percent over the past 18 months.
A lot of future demand for goods was pulled forward into 2020 and 2021 as many services were not available due to pandemic shutdowns while consumer incomes remained high boosted by government support programs, which have now mostly ended. Meanwhile, much of the pent-up demand for services such as travel and dining out has been fulfilled in 2022, and the elevated pace of services spending will likely ease in the coming year.
The consumer is also very downbeat about future prospects, as are CEOs. Consumer and business confidence readings are already at recession-like lows.
What would the arrival of a U.S. recession in 2023 mean for investors?
On the interest rate front, we expect 2023 will be a year of trend transition that sees rates rising somewhat further in the first half before falling in the second.
Over the past 70 years, the Fed has usually stopped raising rates and begun cutting even before the recession started. The notable exceptions were in the inflationary ’70s and early ’80s when rate cuts didn’t begin until well into the recession. Over the same time span, 10-year Treasury yields mostly peaked and started falling before the recession began and before Fed rate cutting got underway. Again, the recessions of the 1970s were the exceptions.
Given today’s inflation concerns, the Fed has made a point of emphasizing the dangers of cutting rates too soon. Further improvement in the inflation data may allow policymakers to scale back the pace of future rate hikes, maybe even to pause for a while. However, outright rate cutting is unlikely to be on the table, in our view, until there is some marked worsening in the economic data, particularly on the employment front. The second half of 2023 should see the window open for Fed rate cuts designed to soften the impact of the recession which we expect will be underway by midyear.
To the extent that other developed countries will also be seeing some moderation in inflation readings, we think Fed cutting will give their central banks cover to lower rates in response to their own recessions, which, at least in the case of Europe and the UK, are likely to be comparatively deeper and more painful.
10-year bond yields may have already peaked or be in the process of doing so. However, we believe they are unlikely to fall back by very much from today’s levels until inflation is clearly on a downward path and until central bank rate cutting is clearly in sight, probably in the second half of 2023.
U.S. recessions and equity bear markets go hand in hand
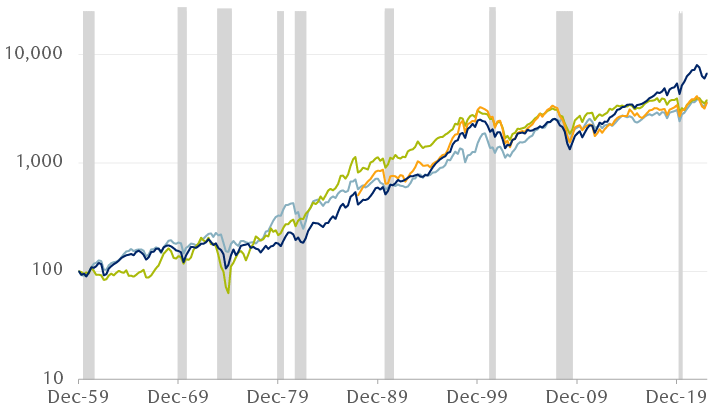
The line chart compares the value of four major equity indexes since December 1959 on a logarithmic scale, indexed to December 1959 = 100, and highlights recessionary periods. Values of all indexes fell during recessions. The indexes shown are the S&P 500 Index, S&P 500/TSX Composite Index, FTSE All-Share Index, and MSCI Europe Index.
Source - Standard & Poor’s, Toronto Stock Exchange, FactSet; quarterly data through 10/31/22, shown on a logarithmic scale, indexed to December 1959 = 100)
From a stock investor’s standpoint, U.S. recessions have typically been associated with global equity bear markets. Media commentary over the past nine months has assumed that a bear market has already begun. That may be the case. However, wherever the stock market is headed over the next couple of quarters it’s unlikely to go there in a straight line, in our opinion.
Starting a couple of weeks before the U.S. midterm elections in early November, most major equity markets began a rally that appeared to have better underpinnings than any prior countertrend upswing in 2022. Outside the U.S., some of the worst underperforming markets of this past year—notably Europe, China, and Hong Kong—led the way higher.
So far, this move has been almost universally labeled as no more than a “bear market rally.” Of course, it may prove to be just that. However, several factors persuade us that this current advance could have legs into the new year: moderating inflation data, which raises the possibility of a slowdown in Fed rate hikes; the intensely negative investor sentiment around the market lows in October that was the opposite of the complacent optimism that prevailed back at the market’s peak in January; and the fact that the S&P 500 has almost always delivered strong, positive returns for a number of months following the U.S. midterms.
Whether any unfolding equity rally is something more than simply an upside interlude in a longer-term downtrend remains to be seen, in our view.
That said, a 2023 recession, probably arriving around midyear, is now strongly indicated by our most reliable leading indicators. Since every U.S. recession has been associated with an equity bear market (not just in the U.S. but in every major equity market), we expect that any rally in equity prices over the next few weeks or months will, at some point, give way to another period of falling share prices reflecting declining expectations for earnings and eroding confidence in the future that typically comes with a period of economic retrenchment.
How much does the arrival of a recession and accompanying equity bear market matter to the investment outlook?
We see at least two answers to this question. During the period when a recession and the accompanying equity bear market are unfolding, investor optimism typically turns, over the course of several months, into extreme pessimism as earnings estimates are revised downward, corporate problems that were manageable in a growing economy become less fixable in a shrinking one, and unforeseen crises come to the surface. As months go by and business conditions worsen, investors may lose confidence that the problems, which they are only belatedly becoming fully aware of, can ever be fully resolved.
At the worst point, investors may come to believe the recession has much further to run than it actually does. That (mistaken) belief makes them highly skeptical when the stock market turns higher, as it always has, well before the recession ends—usually three to five months before.
But if one stands back and looks at a longer stretch of economic and market history, a much less chaotic and much more constructive view emerges. The first chart on the following page reveals that, with bear markets included, the S&P 500 has climbed within in a remarkably steady uptrend over the 77 years from the end of WWII to today. The appreciation of the index over that interval works out to 7.3 percent per annum. Of course, the investor also received dividends along the way equal to roughly two percent per annum, which were not assumed to be reinvested in this example but paid out each year. So the total return for owning 500 of arguably among the largest, most seasoned businesses in the U.S. was more than nine percent per annum, pretty consistently delivered over a span of almost four generations.
Since 1945, the S&P 500 has advanced in a well-defined uptrend
S&P 500 performance
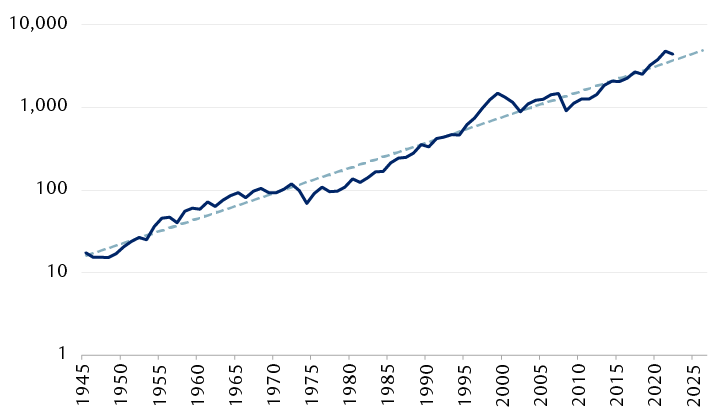
The line chart shows the annual performance of the S&P 500 Index since 1945 on a logarithmic scale, and a trend line illustrating the steady uptrend. The Index rose from approximately 17 in 1945 to over 4300 in 2022.
Source - Standard & Poor’s; annual data shown on a logarithmic scale
Importantly, as revealed in the chart below, just because the index went from a low value in 1945 to a very high value today doesn’t mean it went from “cheap” to “expensive.” Rather, it appreciated in value exactly as fast as the earnings of those 500 companies grew—it was a “dead heat” with both the value of the S&P 500 itself and the earnings per share of the index advancing at a rate of 7.3 percent per annum over those 77 years.
Share prices have risen with earnings…
S&P 500 Index performance vs. operating earnings per share

The line chart compares the annual performance of the S&P 500 Index and the operating earnings per share of S&P 500 companies since 1945 on a logarithmic scale indexed to 1945 = 100. The two data series track closely together over the time period shown.
Since 1945, both stocks and earnings have risen by an average of 7.3% per annum.
Source - RBC Wealth Management, Standard & Poor’s; annual data shown on a logarithmic scale
And it is also reassuring to discover, as the final chart on the following page shows, that 7.3 percent per annum is not some “magic” number that one has to accept on faith. Instead, it is a rate of growth almost entirely governed by the growth of the U.S. economy over that time. The growth of so-called “nominal GDP” averaged 6.4 percent per annum from 1945 to the present. (Nominal GDP is GDP without adjusting for inflation, which we use here because neither the S&P 500 nor earnings are inflation-adjusted.) In our opinion, the best explanation for why earnings and average share values were able to grow almost one percentage point per annum faster than the economy is that an increasing proportion of the firms in the index were successfully growing their businesses outside the U.S., as well as inside, over those years.
…and earnings have risen somewhat faster than the economy has grown
Operating earnings per share vs. nominal U.S. GDP
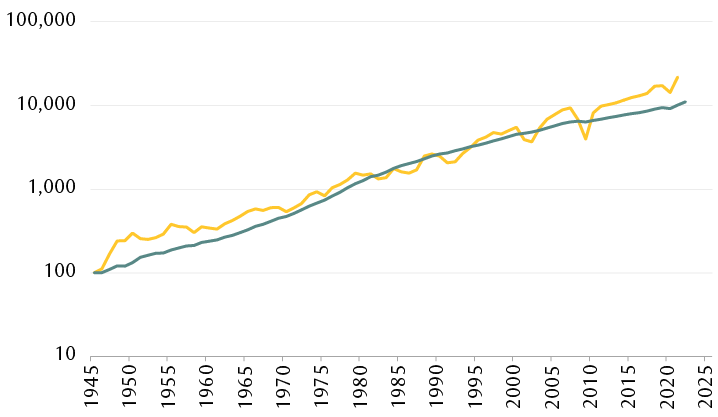
The line chart compares annual operating earnings per share for S&P 500 companies and the nominal U.S. GDP on a logarithmic scale indexed to 1945 = 100. The two data series track closely together, but earnings have risen faster.
Since 1945, nominal U.S. GDP has risen by 6.4% per annum, while earnings have risen by 7.3% per annum on average.
Source - RBC Wealth Management, Standard & Poor’s, U.S. Federal Reserve; annual data shown on a logarithmic scale
So this longer-term view reveals that the economy and businesses are constantly adapting to changing conditions. Sometimes that adaptation is painful. But if recessions are the painful periods, then they are typically very short. Over the 77-year time span we are looking at, the economy was in recession for a total amount of time equivalent to 12 years or about 15 percent of the time. This minority of time spent in recession is underscored in the chart above. If you look closely at the line representing GDP, you can just about make out six very shallow dimples that coincide with periods of recession. But there were a total of 13 recessions over that stretch, so six are barely visible while seven are not visible at all.
Making big portfolio asset allocation decisions based on the premise that the economy and already successful businesses are going to lose this ability to adapt, or that the challenging periods are going to last much longer than they have seems out of proportion to the historical record, in our opinion.
On the other hand, leaning more heavily toward quality and sustainable dividends and away from individual company risks that may come home to roost in a recession looks to us like a good approach as we enter 2023.