
The Federal Reserve continues to march to the beat of its own drum, with another outsized rate hike, and a supercharged rate outlook, but it’s the impact of those rate hikes on the economy that was our focus at this week’s policy meeting. As Fed Chair Jerome Powell stated in his August speech at the Jackson Hole Economic Symposium, there would likely be some “pain” ahead for consumers, and the Fed’s latest outlook suggests just that.
A recession by any other name would smell just as awful
The Fed remains hopeful of engineering a “growth recession” according to its updated projections and Powell’s post-meeting press conference. Market reaction was less optimistic as equities sold off sharply and various Treasury yield curve measures dropped deeper into inversion, suggesting to us that another round of economic “hard landing” fears will likely rattle markets in the weeks and months ahead.
So how much pain might higher rates inflict? As the chart shows, following this week’s 75 basis point (bps) hike to an upper bound of 3.25 percent and into “restrictive” territory as judged by Powell, the Fed now envisions raising rates to around 4.5 percent by the end of this year, and to 4.75 percent sometime next year—both levels handily exceeding our, and seemingly everyone’s, expectations.
Market agrees with the Fed’s near-term rate hike outlook, but sees earlier and deeper rate cuts
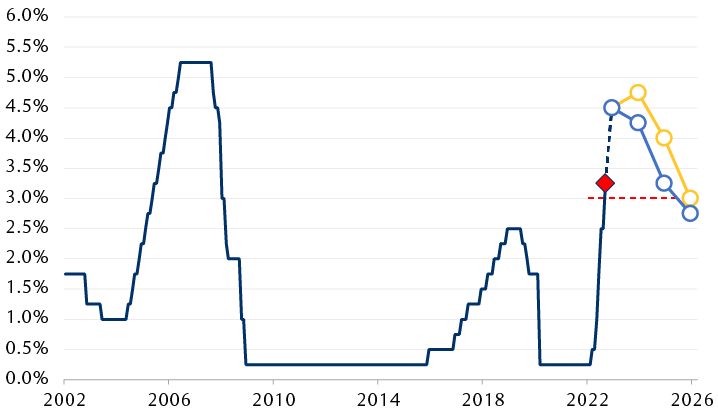
Line chart showing the evolution of the Fed's policy rate over the past twenty years. The Fed's updated projections at the September meeting show rate hikes continuing this year to an upper bound of 4.50%, with one more rate hike to 4.75% in 2023. But while markets are on the same page with respect to a 4.50% rate this year, markets expect rate cuts to begin next year.
Source - RBC Wealth Management, Bloomberg; market expectations based on fed funds futures data; restrictive level based on the upper range of Fed’s longer-run rate projection
That outlook is now at the heart of the Fed’s hoped-for “growth recession”: below-potential growth, which the Fed still judges to be 1.8 percent, for a stretch with real growth expected at just 1.2 percent next year and 1.7 percent in 2024, before economic growth returns to 1.8 percent in 2025, likely as a result of the rate cuts the Fed also has penciled into its projections. On the back of that, unemployment is seen rising to 4.4 percent in both 2023 and 2024, before dropping back to 4.3 percent in 2025; all levels above the Fed’s estimate of “full employment” of 4.0 percent, while inflation is seen falling to the 2.0 percent goal by 2025. So then—not great, but could be worse.
Wait, will it be worse?
If we take the Fed at its word, and there’s little reason not to over the near term even if we have more concerns about the long term than policymakers do, and rates rise to 4.5 percent by December—that’s 425 bps of policy tightening over a span of just nine months.
Needless to say, there’s little precedent for that outside of the Volcker era of the 1980s. While some may argue rates remain historically low, it’s the magnitude of the hikes that matters, in our view, particularly given the lagged impact of monetary policy on the economy. We believe policymakers will ultimately take that into consideration as this rate hike cycle nears its end.
And to that end, RBC Economics maintains a more cautious outlook with a mild recession expected in early 2023 that gives way to unemployment rates closer to 5.0 percent, before the Fed delivers rate cuts in the back half of next year. But even if the Fed might not come out and say it—that kind of scenario may actually be its goal, in our view. As Powell stressed in his press conference, returning price stability to the economy sooner rather than later should ultimately set the stage for a longer and more sustainable expansion, of the variety that we have seen for much of the past three decades.
The upside of up
But while still-high inflation has meant that questions remain about whether the Fed will succeed in bringing inflation down, markets have spoken. In March, when the Fed began its rate hike campaign, the Treasury Inflation-Protected Securities (TIPS) market traded with expectations that inflation would be nearly 5.0 percent over the next two years; today that expectation is just 2.4 percent. The same is true across the entirety of the TIPS yield curve. The top chart shows how real yields available to investors have shifted since March and are now not only above zero percent but also at the highest levels since 2009.
Real Treasury yields, adjusted for expected inflation, exceed 1% across the curve, highest levels since 2009
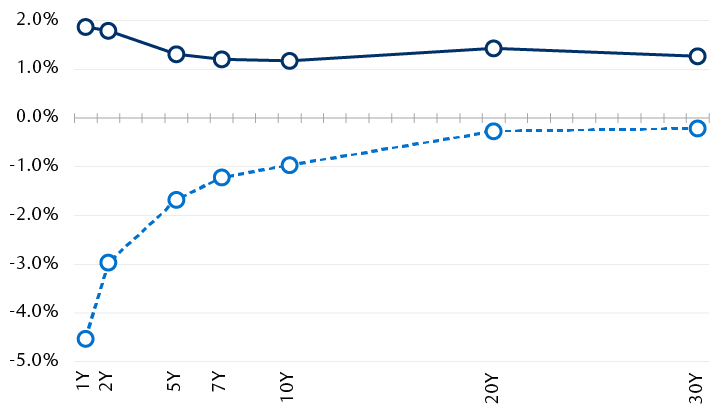
Line chart showing how 'real' yields have shifted sharply higher since the Fed began raising rates as market-based inflation expectations have dropped just as sharply. As a result, the real return bond investors earn from Treasuries is now at the highest levels since 2009.
Source - RBC Wealth Management, Bloomberg
For example, the nominal two-year Treasury yielded about 2.0 percent at the end of March, but as noted above, expected inflation baked into markets was nearly 5.0 percent, for a “real” yield of minus 3.0 percent. That has since flipped—the two-year nominal Treasury now yields 4.1 percent with expected inflation of just 2.4 percent, for a real yield of nearly 2.0 percent, something rarely seen in recent decades and which we believe should begin to attract the attention of investors.
But wait, there’s more
As the bottom chart shows, the Fed’s efforts thus far have increased the potential return of U.S. fixed income across a wide swath of sectors, with yields at or near decade highs. Investment-grade corporate bonds now yield 5.2 percent compared to a 20-year average of just 4.3 percent.
The Fed’s aggressive rate hike campaign has translated to decade-high yields for much of U.S. fixed income
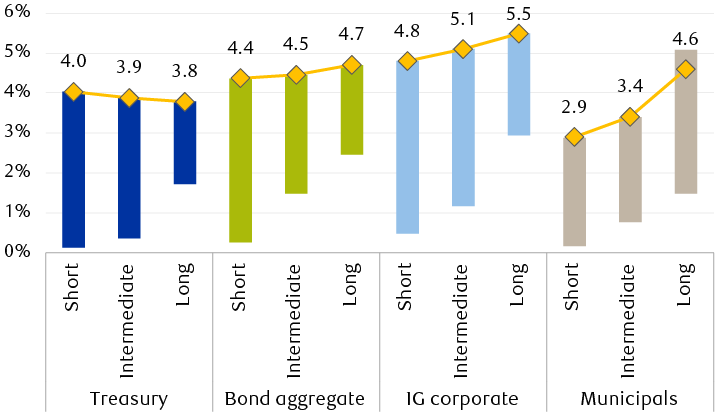
Chart showing current short-term, medium-term, and long-term yields for major U.S. fixed income indexes (Treasury, bond aggregate, investment-grade corporate, and municipals) relative to their ranges over the past ten years. Most are at decade highs. Current index yields are as follows. Treasury: short, 4.0%; intermediate, 3.9%; long, 3.8%. Bond aggregate: short, 4.4%; intermediate, 4.5%; long, 4.7%. Investment-grade corporate: short, 4.8%; intermediate, 5.1%; long, 5.5%. Municipals: short, 2.9%; intermediate, 3.4%; long, 4.6%.
Note: Bars show 10-year range of yields ex 2020
Source - RBC Wealth Management, Bloomberg Bond Indexes
After being passed over by investors for much of the past decade, and perhaps rightly so given the anemic potential returns, we believe fixed income just might make sense again for a broader set of investors with yields at historically attractive levels. But as noted above with respect to rate hikes, and the potential for rate cuts: here today, gone tomorrow. Our base case remains that slowing global growth will ultimately force the Fed’s hand, with the central bank bringing the rate hike cycle to an end this year, and at a level below 4.5 percent.