
We have a feeling people who have been to the grocery store and have paid utility bills lately won’t be surprised by this … U.S. inflation pushed higher yet again as the Consumer Price Index (CPI) surged 9.1 percent in June compared to the same month a year ago. Core CPI, which excludes food and energy, rose 5.9 percent year over year. Both readings exceeded economists’ consensus forecasts. Some of the standout price increases compared to June 2021: Gasoline +59.9 percent, natural gas utilities +38.4 percent, airline fares +34 percent, electricity +13.7 percent, food at home +12.2 percent, new vehicles +11.4 percent, and eating out +7.7 percent.
Further breaking down the data, it was one of the biggest monthly increases on record. The CPI rose 1.3 percent in June compared to May, the hottest month-over-month rise of this inflation cycle and the 12th highest since 1947. Four of the previous jumps above 1.3 percent occurred during the high inflation surges from 1973–1980.
U.S. consumer inflation (year-over-year % change)
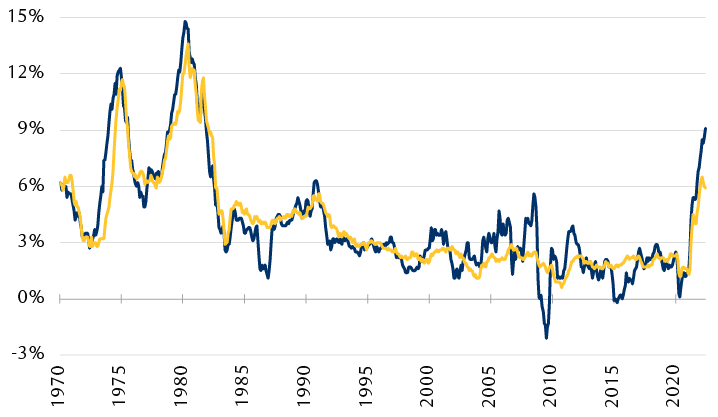
The line chart shows U.S. consumer inflation since 1970, represented by the Consumer Price Index (CPI) and the Core CPI rate (which excludes food and energy). Both indexes began at 6.2% in 1970. After retreating somewhat, they spiked in 1975 to around 12%. Then they retreated back to around 6%, but spiked to roughly 15% in 1980. Then they declined sharply through 1985, and then decelerated further to below 3% by the mid-1990s and stayed there until 2021. At that point, both indexes increased sharply. In June 2022, the CPI rose to 9.1%, and the CPI core registered at 5.9%, the highest levels since the early 1980s.
Source - RBC Wealth Management, Bloomberg; monthly data through June 2022
RBC Capital Markets, LLC Chief U.S. Economist Tom Porcelli does not expect much relief on the inflation front over the near term. He thinks year-over-year headline CPI will remain elevated even if month-over-month inflation decelerates because the data is running into difficult comparisons from last year.
RBC Global Asset Management Inc. Chief Economist Eric Lascelles notes that the energy price shock is now bleeding into other sectors, and this process takes time as price hikes filter across the economy. He wrote, “The point is that economic actors are still playing ‘hot potato’ with rising costs” with one industry passing along price hikes to another, and on down the line to consumers. Lascelles added, “Even as the labor market begins to soften, wage growth may not be done exerting upward pressure on inflation.”
Recession risks continue to rise
With persistent inflation and big Fed rate hikes expected—the Treasury market is now pricing in a strong possibility for a 100 basis point (bps) rate hike at the Fed policy meeting in late July and another 100 bps of hikes for the remainder of the year—the bond market is signaling forthcoming deterioration in economic activity.
This is demonstrated by the all-important 10-year to 1-year Treasury yield curve, which we view as the most reliable of our seven recession indicators. It inverted for the first time this week, as the 1-year yield moved higher than the 10-year yield by 27 basis points on July 13, the day the CPI data was released. This is an abnormal relationship—typically, short-term yields are lower than longer-term yields, except during periods that precede recessions.
For our recession scorecard, the final call on this “inversion” (a potential shift in the indicator to red from yellow) will come at the end of the month because the historical data we have used for this indicator incorporates monthly average yields. But we don’t expect this yield curve inversion to reverse over the remaining days in July. In our view, this means recession risks have risen notably and justify defensive equity positioning, as we explained in the latest update of our recession scorecard.
Porcelli is also concerned about recession risks—even more so than near-term inflation risks. During its fight against inflation, he thinks the Fed could overreach by hiking rates too much, thus slowing economic activity more than is necessary and “forcing” a recession. He believes the U.S. economy is already “quickly losing momentum,” as evidenced by the Fed’s own Beige Book Survey released yesterday. Porcelli points out the Fed is aggressively tightening into this deceleration, which could exacerbate the slowdown.
Is an earnings retreat the next shoe to drop?
Because of heightened recession risks, we think Wall Street’s consensus S&P 500 earnings estimates for future quarters are too optimistic and are bound to come down. Currently, they assume profits will rise through 2023. However, surrounding the previous 11 recession periods, corporate earnings retreated.
Yes, one can make a case that this cycle is different because some companies are clearly benefiting from pricing power that accompanies inflation. But if further slowing in the economy takes root in the coming quarters (remember, pressure on the economy from Fed rate hikes works with a lag), we think companies will start to experience declines in demand. While some S&P 500 firms may be able to offset this with robust price increases, others probably will not be able to keep pace with inflation and also could be hit by lower sales volumes, thus crimping overall S&P 500 profit margins, revenues, and earnings, in our view.
In this vein, equity investors should consider prior periods of earnings retrenchments during recessions. RBC Global Asset Management found that S&P 500 earnings retreated 23.6 percent, on average, as the table shows. But like a lot of historical equity market data, there are nuances.
Corporate profits retreated in each of the prior 11 U.S. recessions
S&P 500 earnings declines surrounding recession periods
| Recession start | Earnings peak | Earnings trough | Earnings decline duration (months) | Earnings peak per share | Earnings trough per share | EPS change peak to trough |
|---|---|---|---|---|---|---|
| July 1953 | Dec. 1950 | Dec. 1953 | 36 | $2.8 | $2.5 | -11.6% |
| Aug. 1957 | Feb. 1956 | March 1959 | 37 | $3.6 | $2.8 | -23.4% |
| April 1960 | June 1960 | June 1961 | 12 | $3.6 | $3.0 | -14.6% |
| Dec. 1969 | April 1969 | June 1970 | 14 | $6.1 | $5.1 | -16.2% |
| Nov. 1973 | Jan. 1975 | Feb. 1976 | 12 | $9.6 | $7.6 | -21.6% |
| Jan. 1980 | July 1980 | Aug. 1981 | 13 | $15.6 | $13.7 | -11.9% |
| July 1981 | Aug. 1982 | July 1983 | 11 | $16.3 | $12.1 | -25.8% |
| July 1990 | Aug. 1989 | May 1992 | 33 | $25.7 | $15.5 | -39.7% |
| March 2001 | Sept. 2000 | March 2002 | 18 | $55.8 | $41.3 | -25.9% |
| Dec. 2007 | Aug. 2007 | Oct. 2009 | 26 | $89.8 | $45.1 | -49.8% |
| Feb. 2020 | Jan. 2020 | Feb. 2021 | 12 | $152.5 | $122.8 | -19.5% |
| Average | 20 | $34.7 | $24.7 | -23.6% | ||
| Median | 14 | $15.6 | $12.1 | -21.6% | ||
Source - RBC Global Asset Management
Excluding the two periods associated with unique financial system turmoil (1990, 2007), which caused overall S&P 500 earnings to decline much more, the average retrenchment was 18.9 percent. And if we zero in on just the four recession periods associated with inflation shocks (1953, 1973, 1980, 1981), the average earnings decline during those periods was 17.7 percent.
Looking out to consensus S&P 500 earnings estimates for the next four quarters (Q3 2022 through Q2 2023), the forecast is for $241 per share, as measured by Refinitiv I/B/E/S. The estimate for full-year 2023 is for $250 per share. We think estimates for both of these periods are too high in light of recession risks.
While it’s too soon to gauge which quarter will represent peak earnings, we think it’s prudent to consider scenarios in which S&P 500 earnings could decline roughly 10 percent to 25 percent from the peak, similar to retrenchments during prior inflationary periods.
In the coming quarters, if broad segments of the economy do indeed show further signs of slowing that start to strain corporate operations, management teams could be compelled to revise down their projections, and then so too would Wall Street industry analysts whose estimates make up the consensus forecasts. We will be monitoring management guidance during the current Q2 earnings reporting season with interest.