The Dow Jones Industrial Average (aka “the Dow”), out of habit and tradition, is still widely considered to represent “the market” by individual investors in the U.S.
It’s no wonder. The Dow is by far the oldest major equity benchmark in the world, stretching back to 1896—it’s the “granddaddy” of them all. And it has a storied past. In good times and bad it has been the most-cited equity index. Even in recent decades, investors associate key events such as “Black Monday” in 1987 or major milestones like the first trip to “Dow 10,000” in 1999 with this blue-chip benchmark.
Changes in the Dow, especially as consequential as the ones that were recently implemented, can impact how this part of the market trades and how the U.S. economy is perceived.
Before and after
Today the Dow looks quite different than it did before the changes took place on August 31 when three stocks were added (salesforce.com, Amgen, and Honeywell) and three were removed (Pfizer, Exxon Mobil, and Raytheon). Last but certainly not least, the simultaneous four-for-one stock split of Apple shares also altered the Dow’s structure.
The Apple stock split actually had a big impact. The stock went from representing a whopping 11.9 percent of the Dow’s total value to just 2.9 percent after the split, as the table shows. This is due to the unique method by which individual stocks influence the overall value of the benchmark. The Dow is price-weighted, so stocks with the highest price per share have the greatest influence on the Dow’s overall value and trajectory.
A major reshuffling of Dow stocks
Changes implemented to the 30-member Dow Jones Industrial Average (DJIA), effective August 31, 2020
| Proportion of DJIA (weight in %) | |||
|---|---|---|---|
| Company (ticker symbol) | Old | New | Difference |
| Added to benchmark | |||
| salesforce.com (CRM) | 0.0 | 6.2 | 6.2 |
| Amgen (AMGN) | 0.0 | 5.8 | 5.8 |
| Honeywell (HON) | 0.0 | 3.9 | 3.9 |
| Removed from benchmark | |||
| Pfizer (PFE) | 0.9 | 0.0 | -0.9 |
| Exxon Mobil (XOM) | 1.0 | 0.0 | -1.0 |
| Raytheon (RTX) | 1.5 | 0.0 | -1.5 |
| Adjusted for stock split | |||
| Apple (AAPL) | 11.9 | 2.9 | -9.1* |
*Any discrepancies in calculations are due to rounding
Source - National research correspondent, Standard & Poor's, FactSet, RBC Wealth Management; data as of 8/31/20
When Apple was first added to the Dow in 2015 at almost $120 per share ($32 split-adjusted), it represented 4.7 percent of the index. But since then, the stock’s price per share surged to more than $500 per share ($120 split-adjusted), climbing 320 percent, and its impact on the Dow rose significantly along the way. While the four-for-one stock split doesn’t change the total value or market capitalization of Apple’s stock, its representation in the Dow declines with the lower split-adjusted stock price.
The Apple stock split, combined with the other Dow changes, had the net effect of:
- Removing the distortion that Apple had on the benchmark
- Broadening out Tech exposure by adding another stock in the sector, salesforce.com
- Meaningfully increasing Health Care exposure by adding Amgen and removing Pfizer (adding a stock with a high price and removing a stock with a lower price)
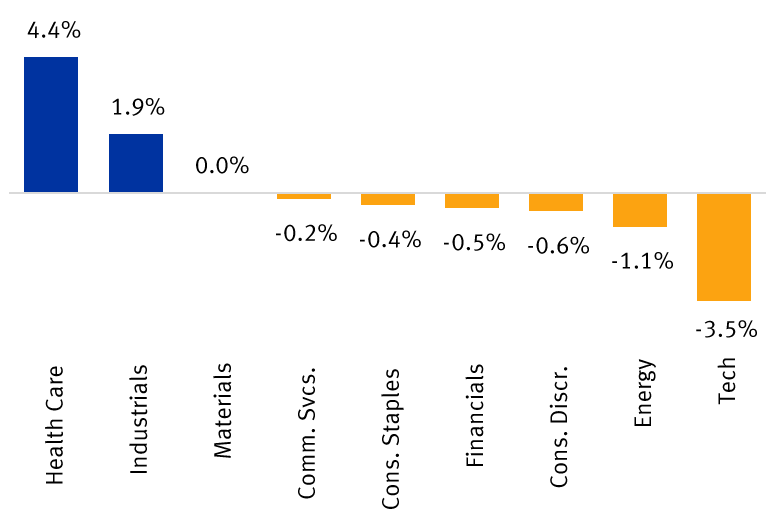
- Boosting the representation of the Health Care and Industrials sectors, and reducing the Tech sector, as the top chart illustrates
How the Dow changes impact sectors
Changes in Dow Jones Industrial Average sector weightings*

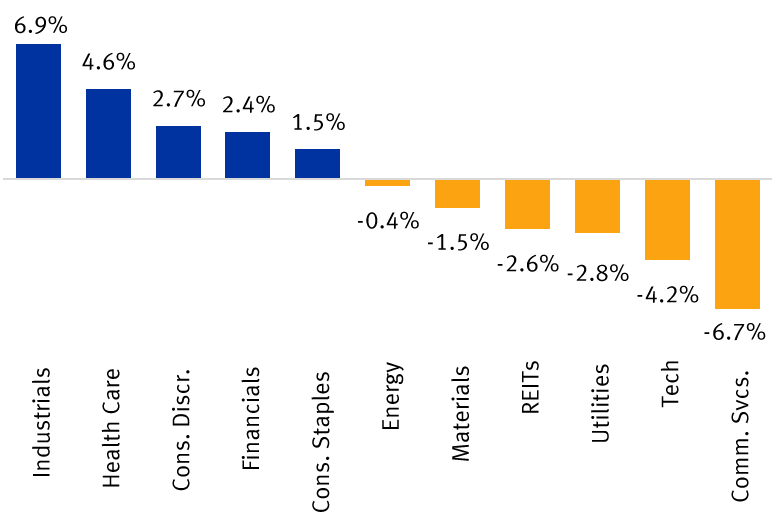
Differences in sector weightings: Dow Jones Industrial Average vs. S&P 500 (Dow minus S&P)*

* Sector abbreviations: Cons. Discr. = Consumer Discretionary; Cons. Staples = Consumer Staples; Comm. Svcs. = Communication Services; REITs = Real Estate Investment Trusts; Tech = Information Technology.
Source - National research correspondent, Standard & Poor's, FactSet; data as of 8/31/20
When comparing the Dow and S&P 500 benchmarks on a sector basis, the Dow now tilts more toward Industrials and Health Care, and has relatively less exposure to Tech and Communications Services than the S&P, as the lower chart shows.
The Dow ≠ the economy
We think the Dow is now more representative of “the market” than it was before, especially since Apple shares will no longer distort its trajectory.
However, we don’t view the Dow (or the S&P 500, for that matter) as being particularly reflective of overall U.S. economic conditions, especially in this COVID-19 environment.
Both of these benchmarks are made up exclusively of large, publicly traded corporations, many of which are multinationals. The sphere of mom-and-pop businesses, which make up so much of the fabric of the broader U.S. economy are not represented in these benchmarks—nor are they intended to be.
While there are loose sector representations—meaning, a favorite local restaurant or hardware store would technically fall under the Consumer Discretionary sector—small and medium-sized businesses face far different challenges and opportunities than large corporations. The COVID-19 shutdowns and restrictions have borne this out.
This is a key reason there is currently a disconnect between “the market” and the broader economy. Both of the major U.S. benchmarks have roared to record highs since the brutal COVID-19 selloff in February and March, while many small and medium-sized businesses are still struggling and some are at risk of closing their doors.
So when considering how “the market” is trading—whether via the Dow or S&P 500—it’s best to think of the major benchmarks as reflecting how the largest segment of corporate America is faring rather than the economy as a whole.
Non-U.S. Analyst Disclosure: Jim Allworth, an employee of RBC Wealth Management USA’s foreign affiliate RBC Dominion Securities Inc. contributed to the preparation of this publication. This individual is not registered with or qualified as a research analyst with the U.S. Financial Industry Regulatory Authority (“FINRA”) and, since he is not an associated person of RBC Wealth Management, may not be subject to FINRA Rule 2241 governing communications with subject companies, the making of public appearances, and the trading of securities in accounts held by research analysts.
In Quebec, financial planning services are provided by RBC Wealth Management Financial Services Inc. which is licensed as a financial services firm in that province. In the rest of Canada, financial planning services are available through RBC Dominion Securities Inc.
