Voici un résumé de nos Perspectives techniques (anglais) publiées en décembre. Nous croyons que notre approche procure une perspective importante en étudiant les tendances et les cycles du marché au moyen d’analyses techniques. La combinaison d’approches macroéconomiques fondamentale et technique peut permettre de déterminer si les deux sont d’accord ou en désaccord, ce qui se traduit par une vision plus éclairée de la dynamique des marchés.
Au début de chaque année, pour évaluer les risques et les occasions qui pourraient se présenter au cours de celle-ci, les investisseurs prennent souvent du recul en fonction de leurs attentes à l’égard de la rentabilité des sociétés, qui sont sous-tendues par les perspectives de croissance économique, d’inflation, de taux d’intérêt, de politique gouvernementale, de situation géopolitique, etc. La combinaison de cette vision « macroéconomique » et de notre approche technique peut fournir un contexte utile pour prendre des décisions de placement.
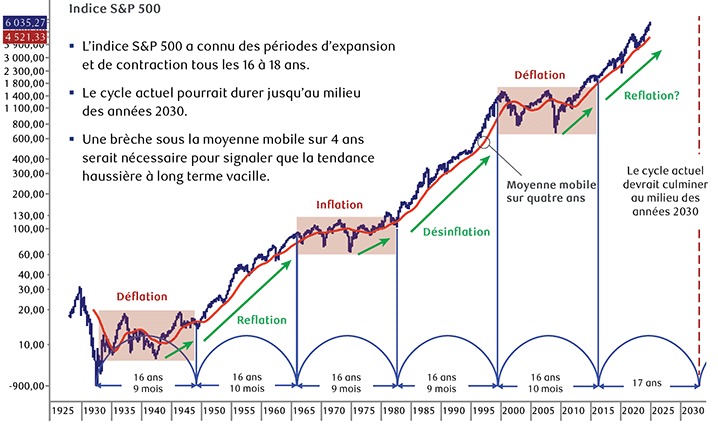
Le graphique ci-dessous montre que le marché boursier américain traverse des cycles d’expansion et de contraction/consolidation d’environ 16 à 18 ans. De ce point de vue, nous entrevoyons une possibilité que le cycle actuel se poursuive jusqu’au milieu des années 2030, avant qu’une autre période prolongée de consolidation latérale n’émerge. Même si des replis sur plusieurs trimestres se produisent souvent en cours de route, il est préférable de conserver ses placements pour profiter de la tendance haussière à long terme actuelle.

Le graphique montre le rendement de l’indice S&P 500 des années 1920 à la fin de 2024. Il met en évidence des cycles d’expansion et de contraction de 16 à 18 ans depuis la fin de la Grande Dépression. Comme le montre la moyenne mobile sur quatre ans, l’indice a progressé en période d’expansion et a stagné ou a reculé en période de contraction. Le graphique indique que le cycle d’expansion actuel devrait atteindre un sommet au milieu des années 2030.
Sources : RBC Gestion de patrimoine, Bloomberg et Optuma
Cycles de marché haussier
Les marchés haussiers structurels des années 1950-1960, 1980-1990 et 2010-2020 sont composés de petits cycles en escalier qui atteignent leur creux environ tous les quatre ans, souvent près d’une moyenne mobile haussière de quatre ans. Ces cycles de quatre ans ne sont aucunement symétriques, certains cycles s’étendant au-delà des remontées habituelles de 2 à 3 ans, suivies d’une correction de 9 à 12 mois, dont 1987 et 2007 sont deux exemples évidents.
Qu’est-ce qui dicte ces cycles? La liquidité fournie par les banques centrales et la réaction de l’économie et des bénéfices des sociétés à cette liquidité sont les principaux catalyseurs, à notre avis. Même si les rendements varient considérablement pour chaque cycle de quatre ans, pendant les marchés structurels haussiers, la hausse moyenne sur quatre ans s’est située près de 110 % et la baisse moyenne a été de 23 %. Fait intéressant, le marché haussier de 2020-2021 (+120 %) et le marché baissier de 2022 (-27 %) se comparent aux moyennes historiques.
Nous estimons que les conséquences pour le cycle actuel, qui a atteint un creux au quatrième trimestre de 2022, sont que les actions devraient encore progresser en 2025 et qu’une fenêtre de correction devrait avoir lieu en 2026. Le cycle haussier actuel de quatre ans a touché un creux au quatrième trimestre de 2022, se situant à la moyenne mobile en hausse de quatre ans (ligne rouge). En outre, après avoir grimpé à de nouveaux sommets au début de 2024, il continue de tendre à la hausse (voir le graphique ci-dessous).

Le graphique montre l’indice S&P 500 de 1945 à la fin de 2024, mettant en évidence un cycle plus court de trois à quatre ans, les principaux creux cycliques se produisant environ tous les quatre ans depuis la Seconde Guerre mondiale.
Sources : RBC Gestion de patrimoine, Bloomberg et Optuma
Points de pause
Lorsqu’un marché ou un titre atteint de nouveaux sommets, une méthode technique pour repérer les points de pause de hausse potentiels consiste à prendre la fourchette de négociation précédente, dans ce cas-ci la fourchette de 2022 à 2024, et à la multiplier par 1,618 et 2,618 (ces deux nombres font partie du nombre d’or de la moyenne). Nous comprenons que cela puisse sembler une façon étrange de prévoir les niveaux de hausse potentiels, mais nous sommes impressionnés par la fréquence à laquelle les marchés évoluent près de ces marqueurs arithmétiques. Fait intéressant, c’est lors de la première extension de 161,8 % que les indices S&P 500 et Nasdaq 100 ont stagné en juillet. Même si nous prévoyons un premier semestre de 2025 volatile, le prochain niveau de hausse de l’indice S&P 500 est près de 7 000, soit le niveau d’extension de 261,8 %.
Bien que ces données nous laissent entrevoir un nouveau potentiel de hausse en 2025, après une remontée de deux ans, le cycle risque d’arriver à maturité. L’indicateur de momentum dans la partie supérieure du graphique s’est avéré utile pour suivre les précédents cycles de marché de trois à quatre ans. Après avoir touché un creux au quatrième trimestre de 2022, cet indicateur est passé en territoire de surachat et pourrait devenir négatif en 2025. Qu’est-ce qui pourrait faire culminer le cycle boursier actuel? Les taux de rendement obligataires élevés en sont souvent la cause. Même si nous nous attendons à ce que le taux de rendement des obligations du Trésor américain à 10 ans se négocie dans une fourchette de 3,25 % à 5 %, un passage au-dessus de 5 % serait probablement un catalyseur pour que le cycle boursier actuel culmine.

Le graphique montre l’indice S&P 500 de 2008 à la fin de 2024, en mettant en évidence le momentum du marché découlant de l’analyse des fourchettes de négociation périodiques.
Sources : RBC Gestion de patrimoine, Bloomberg et Optuma
Suivi de l’ampleur du marché
Au-delà de l’indice S&P 500, l’une des principales préoccupations des investisseurs a été le nombre restreint de titres de croissance importants qui dominent.
L’indice S&P 500 équipondéré et l’indicateur cumulatif hausse-baisse de la Bourse de New York (voir les graphiques ci-dessous) éliminent une grande partie de la distorsion induite par les titres de croissance à mégacapitalisation en essor et fournissent un indicateur du comportement du titre à petite capitalisation moyen.
Jusqu’à la fin de décembre 2024, le taux de participation (mesuré par l’indice S&P 500 équipondéré et le nombre d’actions en hausse par rapport à celles en baisse) s’améliorait depuis le quatrième trimestre de 2023. Ce qu’il faut retenir de ces graphiques, c’est que même si un repli à court terme a lieu, les tendances demeurent positives, demeurant soutenues à partir environ de leur moyenne mobile sur 40 semaines en hausse.
Selon nous, une rupture sous la moyenne mobile sur 40 semaines serait plus préoccupante. Cette rupture a été le signal technique négatif qui s’est développé pour l’indicateur cumulatif hausse-baisse de la Bourse de New York au premier trimestre de 2022 au début du marché baissier (indiqué par la flèche bleue). Encore une fois, nous estimons qu’un taux de rendement des obligations du Trésor américain à 10 ans passant au-dessus de 5 % représente le principal risque pour le maintien de la tendance haussière.

Le graphique montre l’indice S&P 500 équipondéré et l’indicateur cumulatif hausse-baisse de la Bourse de New York (les deux sur une base hebdomadaire) depuis le milieu de 2020. Ces mesures réduisent au minimum les effets du nombre restreint de titres de croissance à mégacapitalisation qui dominent le marché. Les tendances des deux mesures demeurent positives, malgré un repli à court terme.
Sources : RBC Gestion de patrimoine, Bloomberg et Optuma
Principaux niveaux pour les taux d’intérêt
Comme les taux d’intérêt jouent un rôle dominant dans la façon dont les investisseurs évaluent les catégories d’actif, la tendance des obligations américaines à 10 ans demeurera une priorité technique majeure pour nous jusqu’en 2025.
Comme nous l’avons mentionné plus tôt, le principal catalyseur de l’élargissement du nombre de titres participant au rendement au quatrième trimestre de 2023 a été le sommet de 5 % du taux de rendement des obligations du Trésor américain à 10 ans, qui a ensuite baissé pour évoluer dans une fourchette tout au long de 2024.
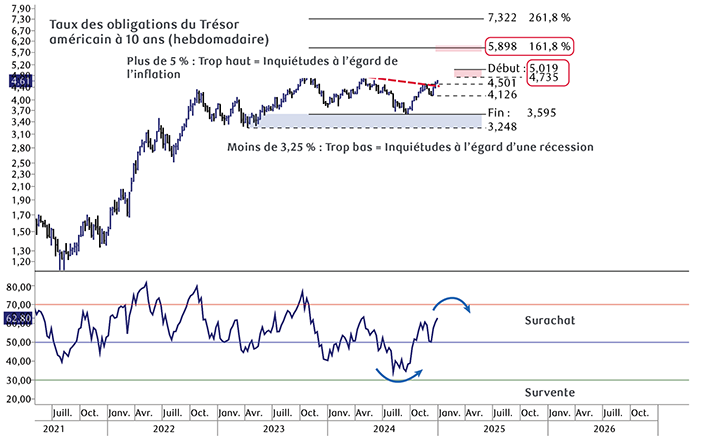
Selon notre scénario de base, le taux de rendement des obligations à 10 ans sera confiné dans une fourchette de 3,25 %-5,00 % pendant la majeure partie de 2025, et des fluctuations lors du premier et du deuxième trimestre devraient définir la fourchette de négociation. Pour suivre ces fluctuations, nous utilisons un simple indicateur de momentum (partie inférieure du graphique ci-dessous), qui s’est révélé utile pour repérer les points de retournement en 2024. Nous nous attendons à ce que cet indicateur atteigne un autre sommet tactique au début du premier trimestre.
Risque : Nous continuons de considérer la bande entre approximativement 4,7 % et 5,0 % comme un seuil de hausse important et, bien que notre scénario de base soit que les taux culminent sous ce niveau, nous pensons qu’un passage au-dessus de cette fourchette signalerait une rupture importante, le prochain niveau de hausse étant tout juste inférieur à 6,0 %, ce qui correspond à l’extension de 161,8 % de la fourchette de négociation de 2024. Comme nous l’avons mentionné auparavant, un passage au-dessus de 5 % devrait exercer d’importantes pressions à la baisse sur les marchés boursiers.

Le graphique montre le taux de rendement des obligations du Trésor américain à 10 ans depuis le milieu de 2021. Depuis le quatrième trimestre de 2023, le taux de rendement oscille entre 3,25 % et 5,00 %.
Sources : RBC Gestion de patrimoine, Bloomberg et Optuma
Rotation sectorielle
Selon nous, les secteurs boursiers se divisent en trois grandes catégories : croissance structurelle, croissance cyclique et défensive.
Étant donné que l’indice S&P 500 est dominé par les titres de croissance à très grande capitalisation, notamment dans les secteurs des technologies et des services de communications, nos perspectives techniques à l’égard des titres de croissance structurelle sont conformes à nos perspectives à l’égard de l’indice S&P 500 dont il a été question ci-dessus. Bref, ces titres de croissance affichent toujours des tendances positives, mais il est, selon nous, moins opportun d’établir de nouvelles positions aux niveaux actuels après les très importantes avancées des deux dernières années.
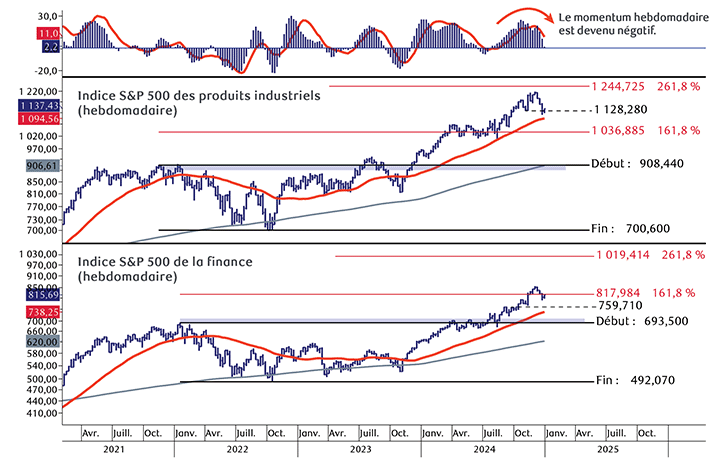
Les secteurs cycliques, les plus sensibles à l’économie sous-jacente, ont tendance à être volatils, affichant des rebonds sur un à deux trimestres suivis de fourchettes de négociation agitées sur plusieurs mois. Ci-dessous, le graphique des secteurs des produits industriels et de la finance de l’indice S&P 500 illustre ces fluctuations sur plusieurs mois à partir d’une tendance haussière à long terme qui s’est accélérée au quatrième trimestre de 2023, après que les taux d’intérêt aient culminé à 5 %. Après avoir fait une pause au premier semestre de 2024, les secteurs cycliques se sont fortement redressés aux troisième et quatrième trimestres de la dernière année, la remontée suivant les élections ayant fait en sorte que les deux secteurs ont culminé près des niveaux techniques d’extension. Même si les deux secteurs tendent à la hausse à long terme, le contexte technique nous donne à penser que les investisseurs devraient demeurer patients en vue d’obtenir de meilleurs points d’entrée au premier trimestre.
Enfin, les secteurs défensifs, comme les services publics, les biens de consommation de base, les soins de santé et l’immobilier, ont inscrit un rendement nettement inférieur à celui de l’indice S&P 500 depuis le début du marché haussier au quatrième trimestre de 2022. Bien que nous n’observions aucune preuve qu’un renversement du rendement relatif se produit dans ces domaines, une liste croissante d’actions qui sont selon nous défensives devient survendue et, comme le momentum du cycle de l’indice S&P 500 progresse, nous nous attendons à ce qu’il soit plus opportun de profiter des occasions que ces secteurs présenteront à mesure que le premier semestre de 2025 s’écoulera.

Le graphique montre les sous-indices des secteurs des produits industriels et de la finance de l’indice S&P 500 depuis 2021. Ces deux secteurs affichent une tendance généralement haussière qui s’est accélérée au quatrième trimestre de 2023. Après une pause au premier semestre de 2024, les deux secteurs se sont redressés jusqu’à la fin de l’année.
Sources : RBC Gestion de patrimoine, Bloomberg et Optuma
Ressources pour les recherches
Au Québec, les services de planification financière sont fournis par RBC Gestion de patrimoine Services Financiers. qui est autorisé comme une société de services financiers dans cette province. Dans le reste du Canada, les services de planification financière sont disponibles à travers RBC Dominion valeurs mobilières.
