
Dear Clients,
We are writing to provide you with a Portfolio Update, having just concluded the first half of 2022. Without a doubt, the past six months have been among the most challenging for markets and also for our portfolios.
There is a combination of factors that have contributed to this weakness. Most notable is the sharp rise in inflation brought about by pandemic-related imbalances such as supply chain disruptions and labour market tightness, further exacerbated by the war between Russia and Ukraine, which resulted in energy shocks. To combat inflation, central banks, led by the US Federal Reserve, have embarked on an aggressive path to raise interest rates. During past rate-hike cycles, equity markets have tended to perform well because the very reason behind rate increases typically is economic strength. However, this year, markets have very quickly sold off to the point of reflecting fears of a recession. It is possible that the US and the developed world are already in a recession as the pandemic and its after-effects have created challenges that are not common to normal economic cycles. A positive consequence of this is that we already see signs of easing in inflation as labour market pressures subside and goods-selling companies begin to mark-down and reduce excess inventories. This, combined with structural disinflationary factors that we have discussed in previous notes, such as the impact of technology and demographics, has allowed for a stabilization of bond yields at relatively low levels and should, eventually, allow central banks to back off their aggressive tightening stances.
In such periods of uncertainty, it is important to reiterate our investment approach. Above all, our strategy emphasizes investing in high-quality companies with strong, profitable business models and capable management teams. They have more financial flexibility and are able to sustain pricing power based on the superior quality of their products and services. We also look for businesses in areas that benefit from long-term growth tailwinds.
The companies we favour span a range of industries but there is a bias towards the consumer products and technology sectors. These sectors are very diverse and the separation between winners and losers is particularly significant, creating opportunities for leading players to profitably dominate and grow over time. In recessionary market conditions, stocks in these sectors can be especially hard-hit as many market participants focus on near-term cyclical downside. The opportunity lies in taking a longer-term view with the understanding that the value of a stock is determined by its life-time profit potential, not just a few quarters of performance. When economic conditions inevitably improve, these strong businesses stand to benefit from market share gains and incremental growth opportunities. This forms the basis of our confidence in the companies we own. Of course, we are always willing to make adjustments as we see fit.
In closing, we urge patience as we work hard to navigate through this dynamic investment climate. As always, if you have any questions for us, please do not hesitate to let us know.
Warm regards,
Woon Ai on behalf of Woon Ai Tsang Wealth Management Group
*To illustrate our point about the significant performance differentials between winners and losers in the consumer and technology sectors, we have prepared some graphs to compare four pairs of companies:
1. This chart below shows the difference between Lululemon’s stock performance (in blue) and Under Armour’s (in green). Over the last 10 years, Lululemon (LULU) has more than quintupled while Under Armour (UAA) has returned -36%.
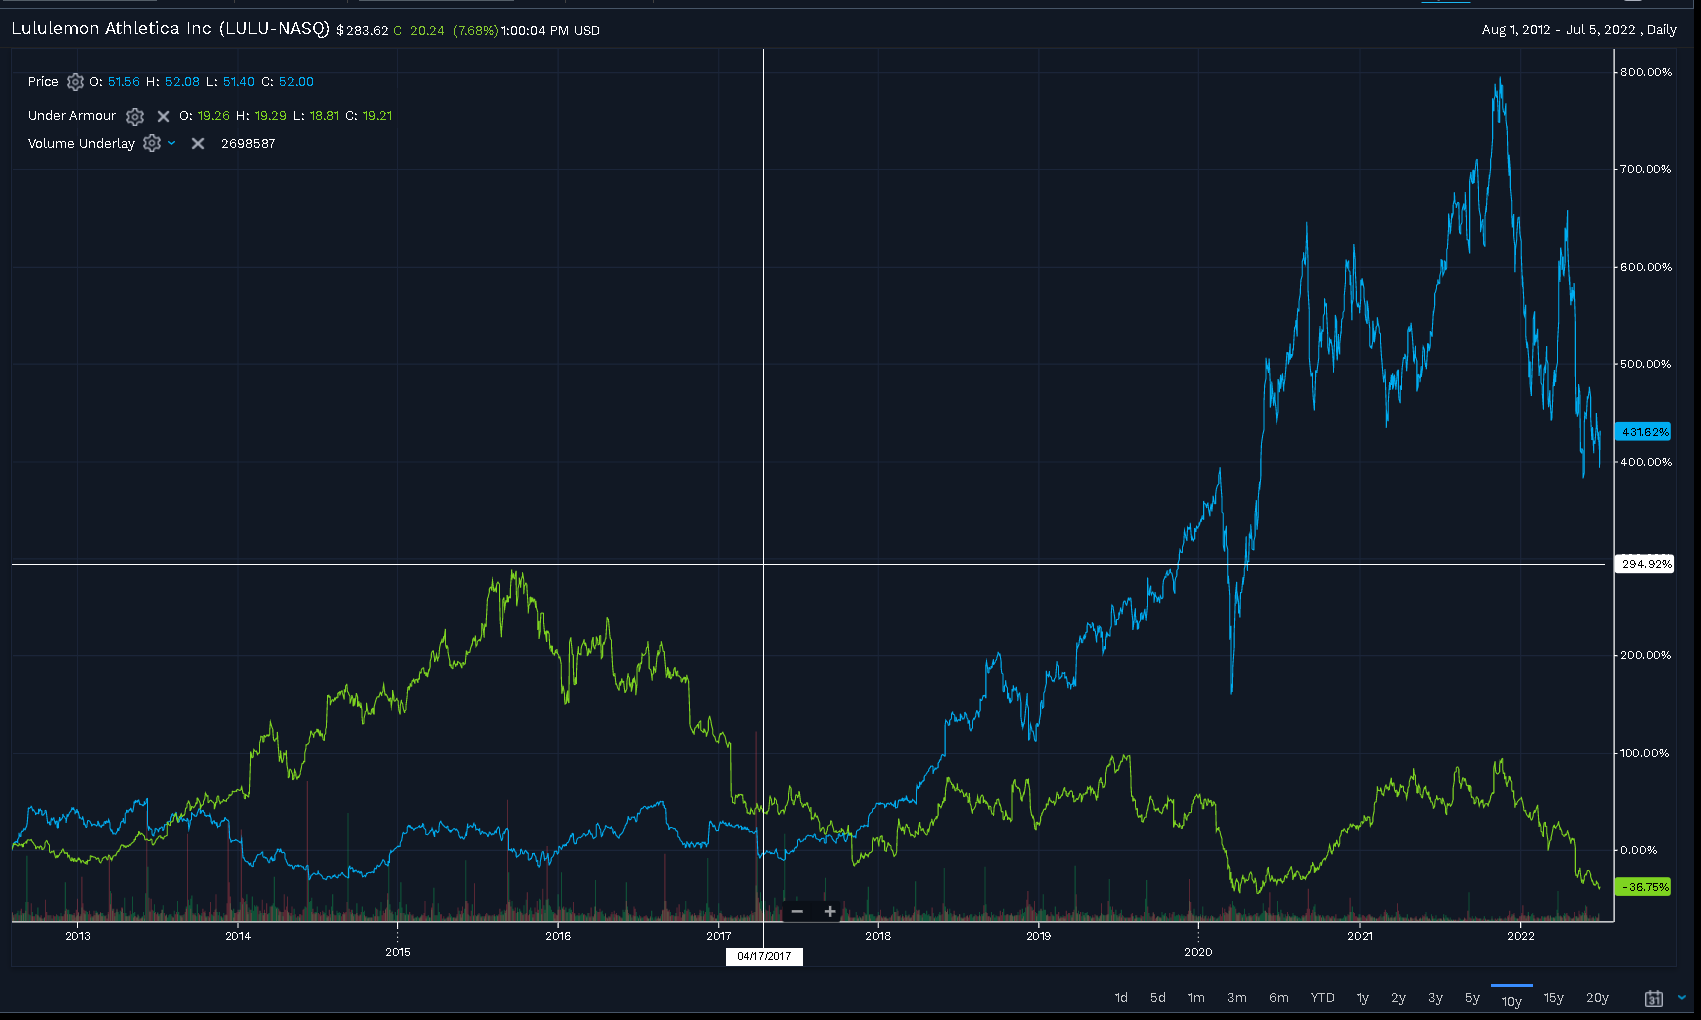
Graph taken from FactSet Web Application.
Lululemon’s stock performance (blue below) is supported by its significant growth in earnings per share (EPS, green), which reflects both revenue strength from market share gains in a growing category, and profitability improvement.
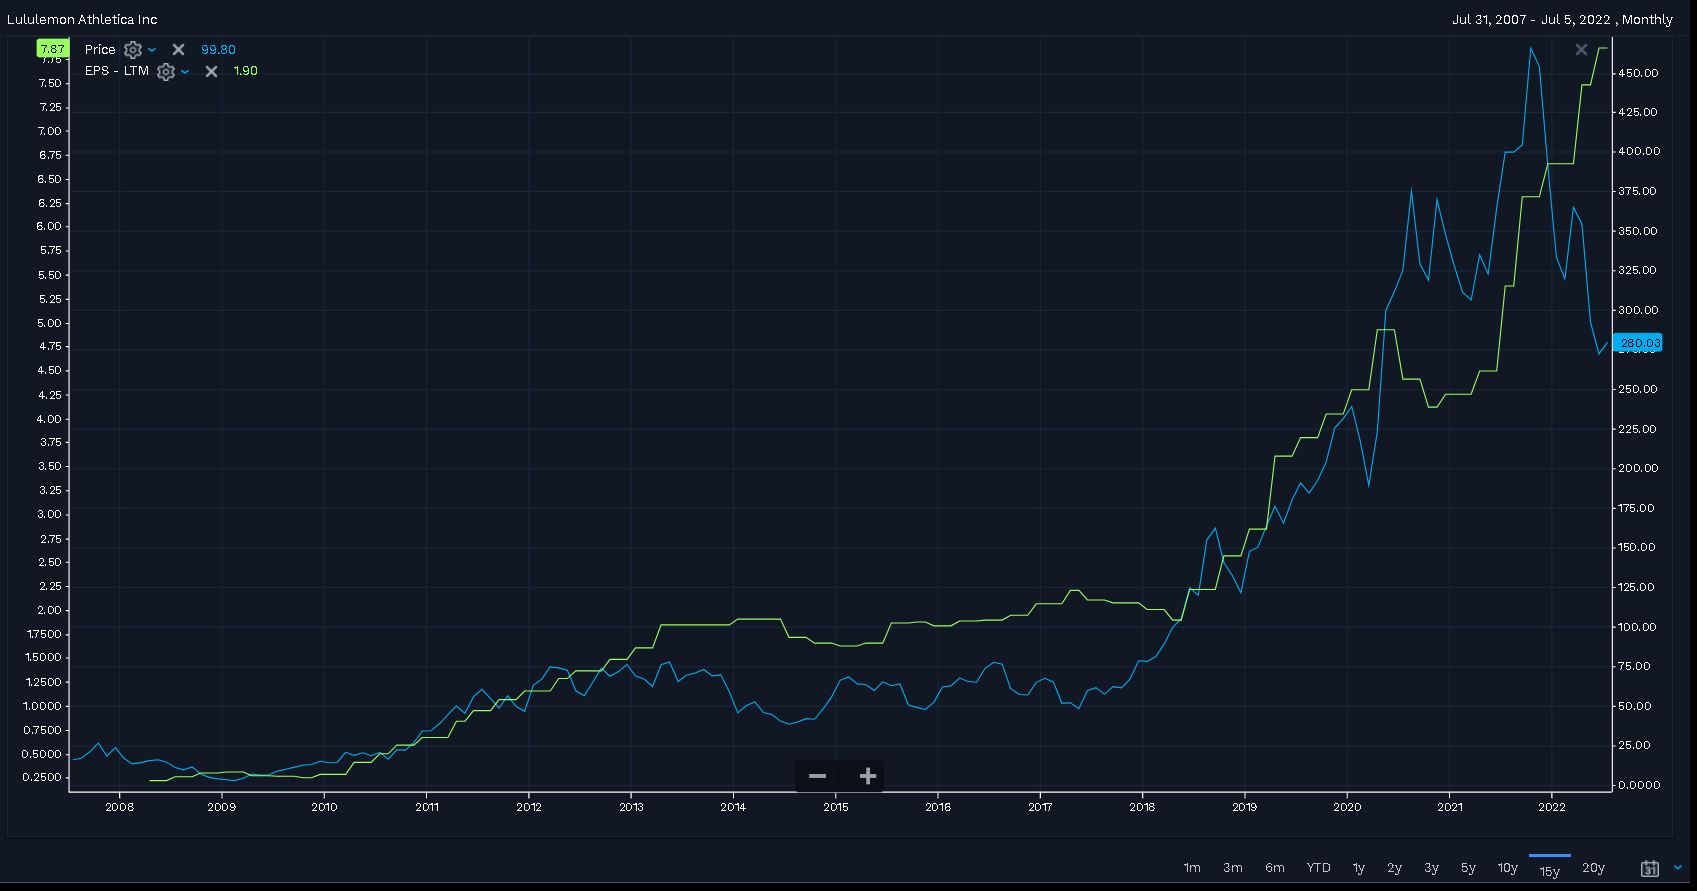
Graph taken from FactSet Web Application.
On the other hand, Under Armour’s poor long-term performance (blue below) can also be attributed to its lack of earnings growth (green). Early on, as it gained popularity, earnings grew and the stock did well. However, the growth was unsustainable as it was achieved through rapid expansion of wholesale distribution, where it does not have control over selling price, and through excessive licensing of the brand, where product quality gets easily diluted. The brand subsequently lost desirability and still struggles to regain stature.
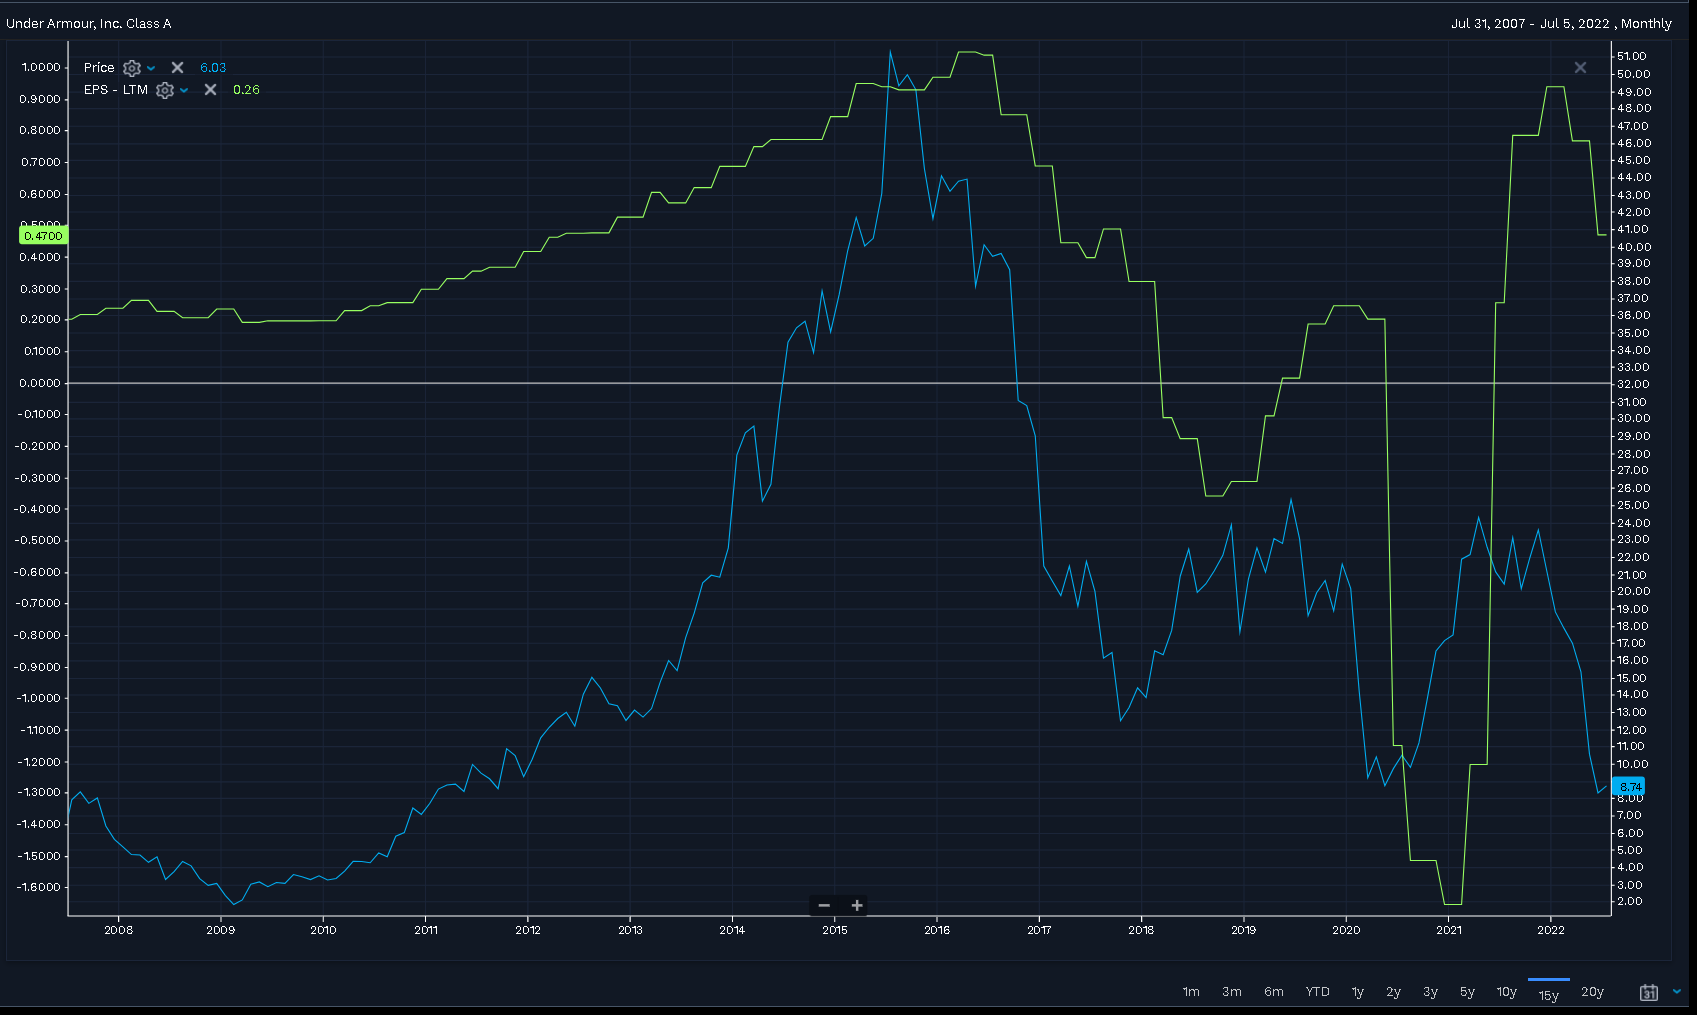
Graph taken from FactSet Web Application.
2. Here we compare the performance of LVMH (MC-PAR, blue) with Capri (CPRI, green), owner of Michael Kors. LVMH represents the premium end of the luxury goods sector, which continues to gain revenue and profit share at the expense of lower-tier players such as Michael Kors.
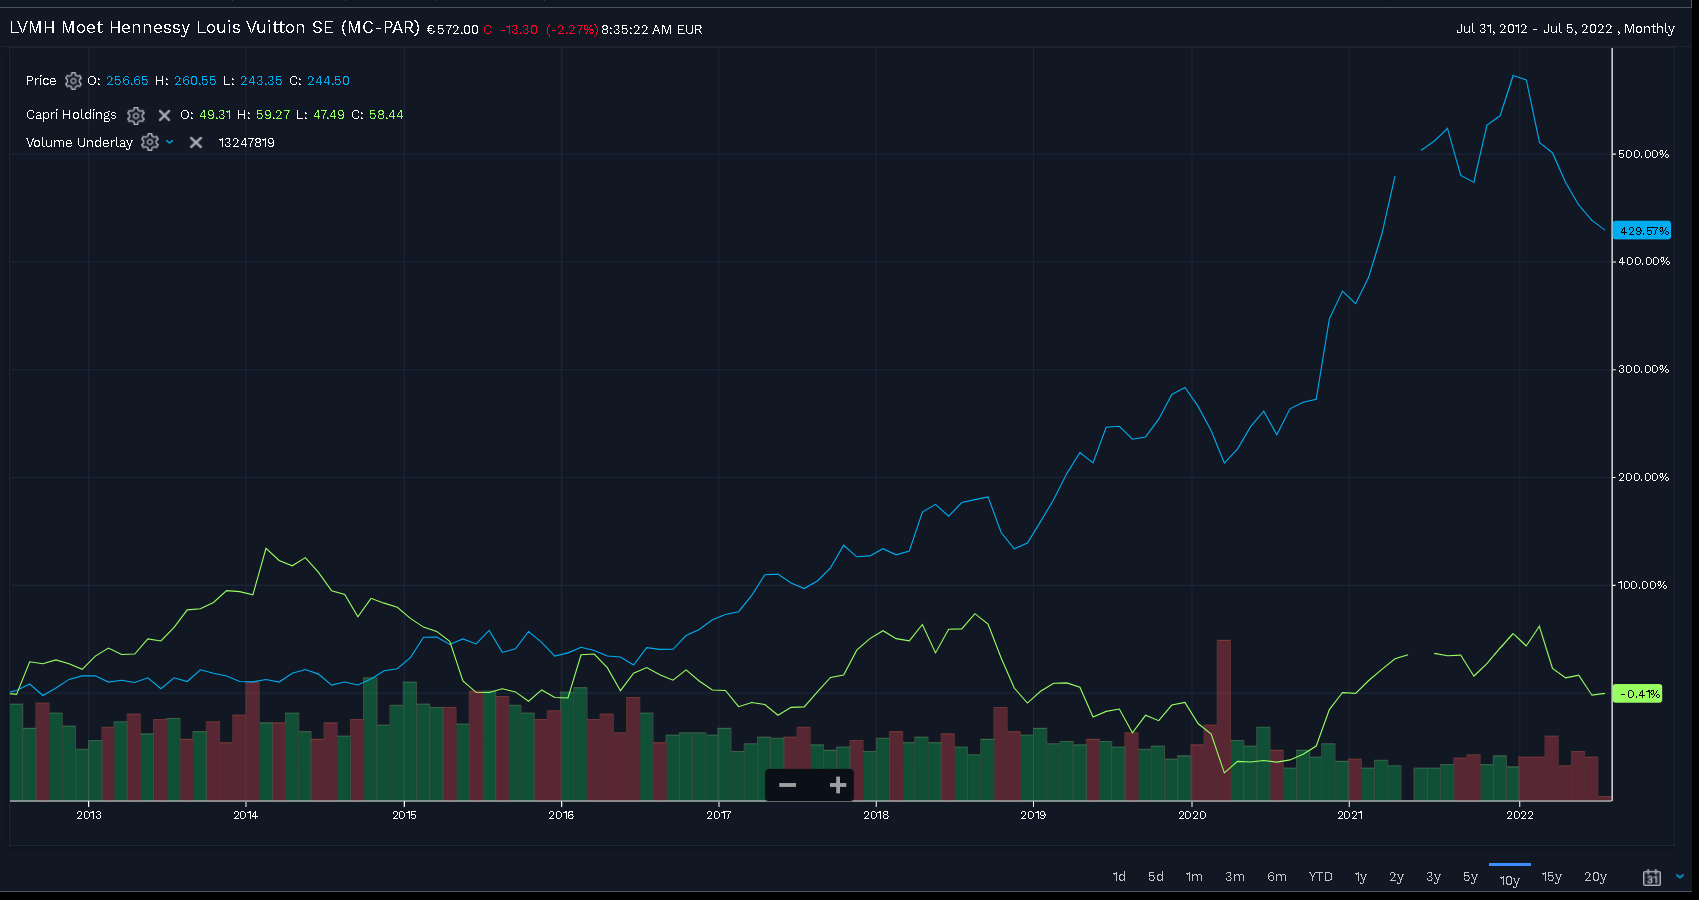
Graph taken from FactSet Web Application.
Similar to Under Armour, Capri did well early on; however, the low-quality growth was brand-dilutive and unsustainable. On the other hand, LVMH’s performance (blue below) is supported by consistent earnings growth (green).
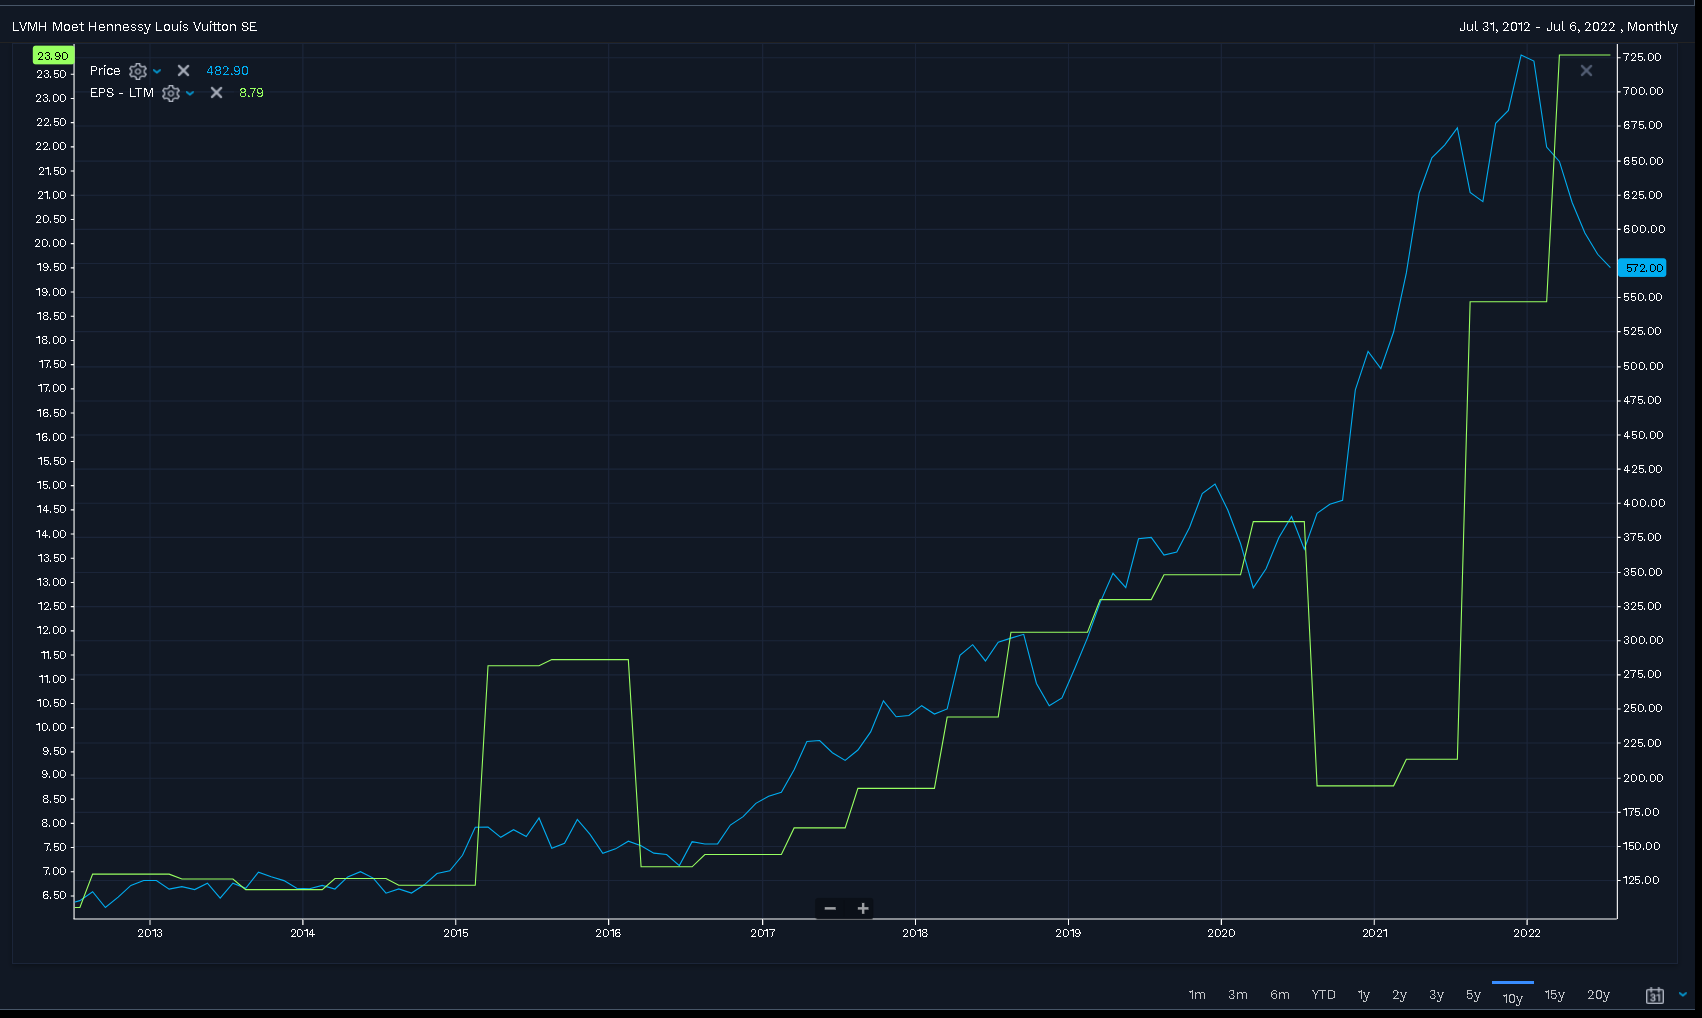
Graph taken from FactSet Web Application.
3. This chart demonstrates the dramatic outperformance of Advanced Micro Devices (AMD, blue below) against Intel (INTC, green) since 2012, when AMD’s current CEO, Dr. Lisa Su, began to lead the company.
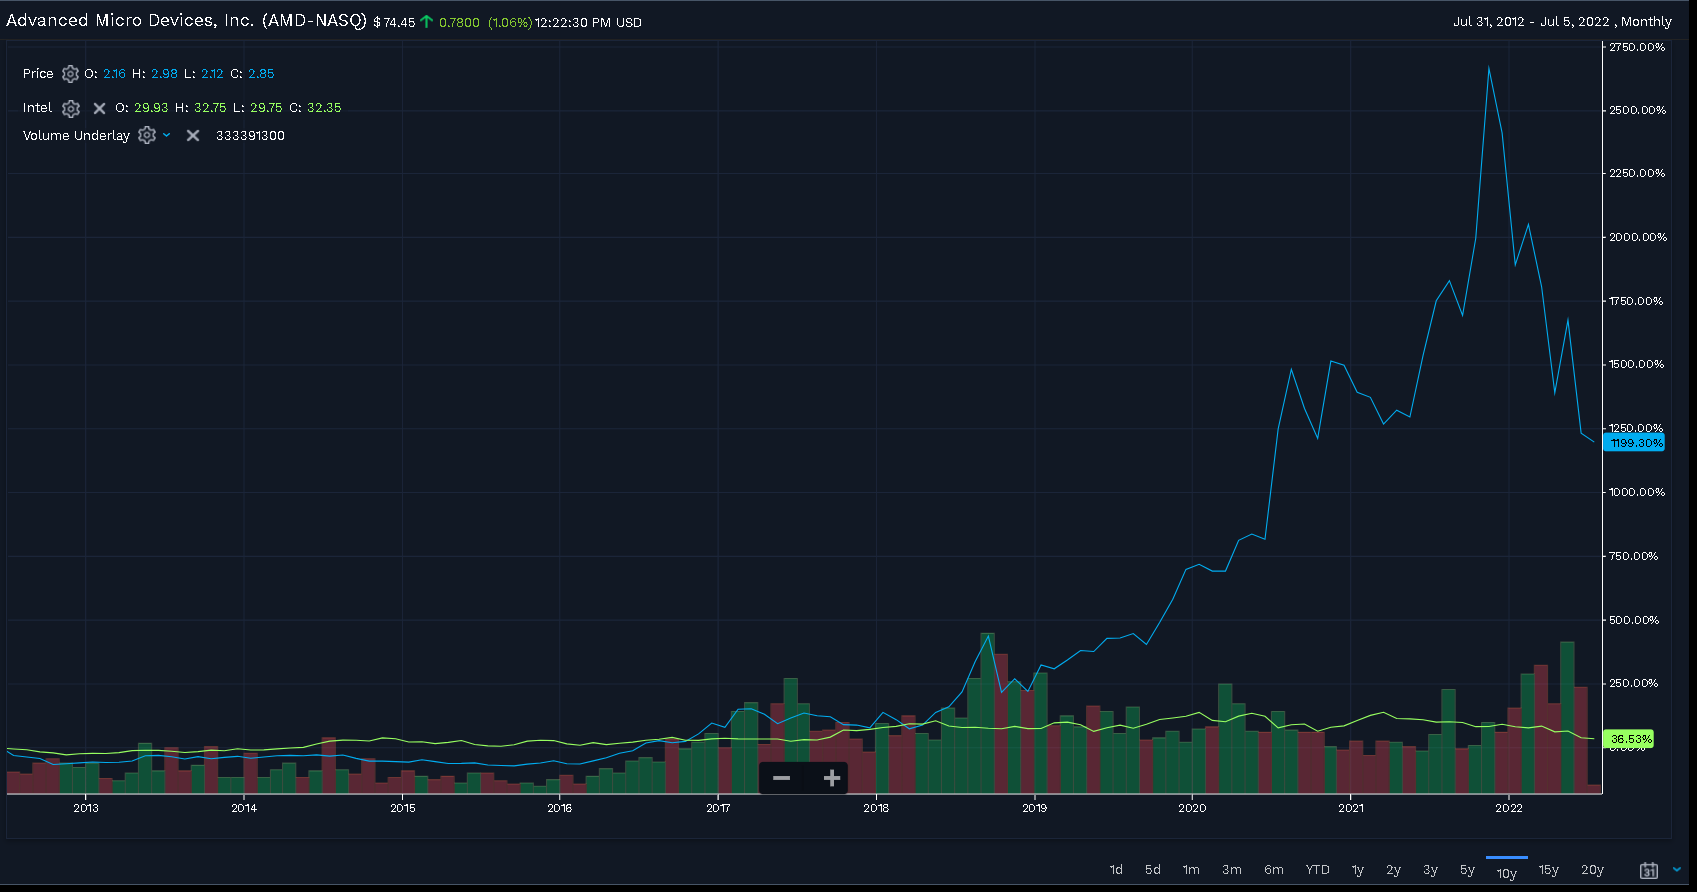
Graph taken from FactSet Web Application.
AMD’s strong performance (blue below) can be attributed to the visionary leadership of Dr. Su, who has led the company to gain meaningful market share in microprocessors against its archrival, Intel, and establish a leadership position in the fast-growing data center semiconductor business, ultimately driving powerful profitability growth (green).
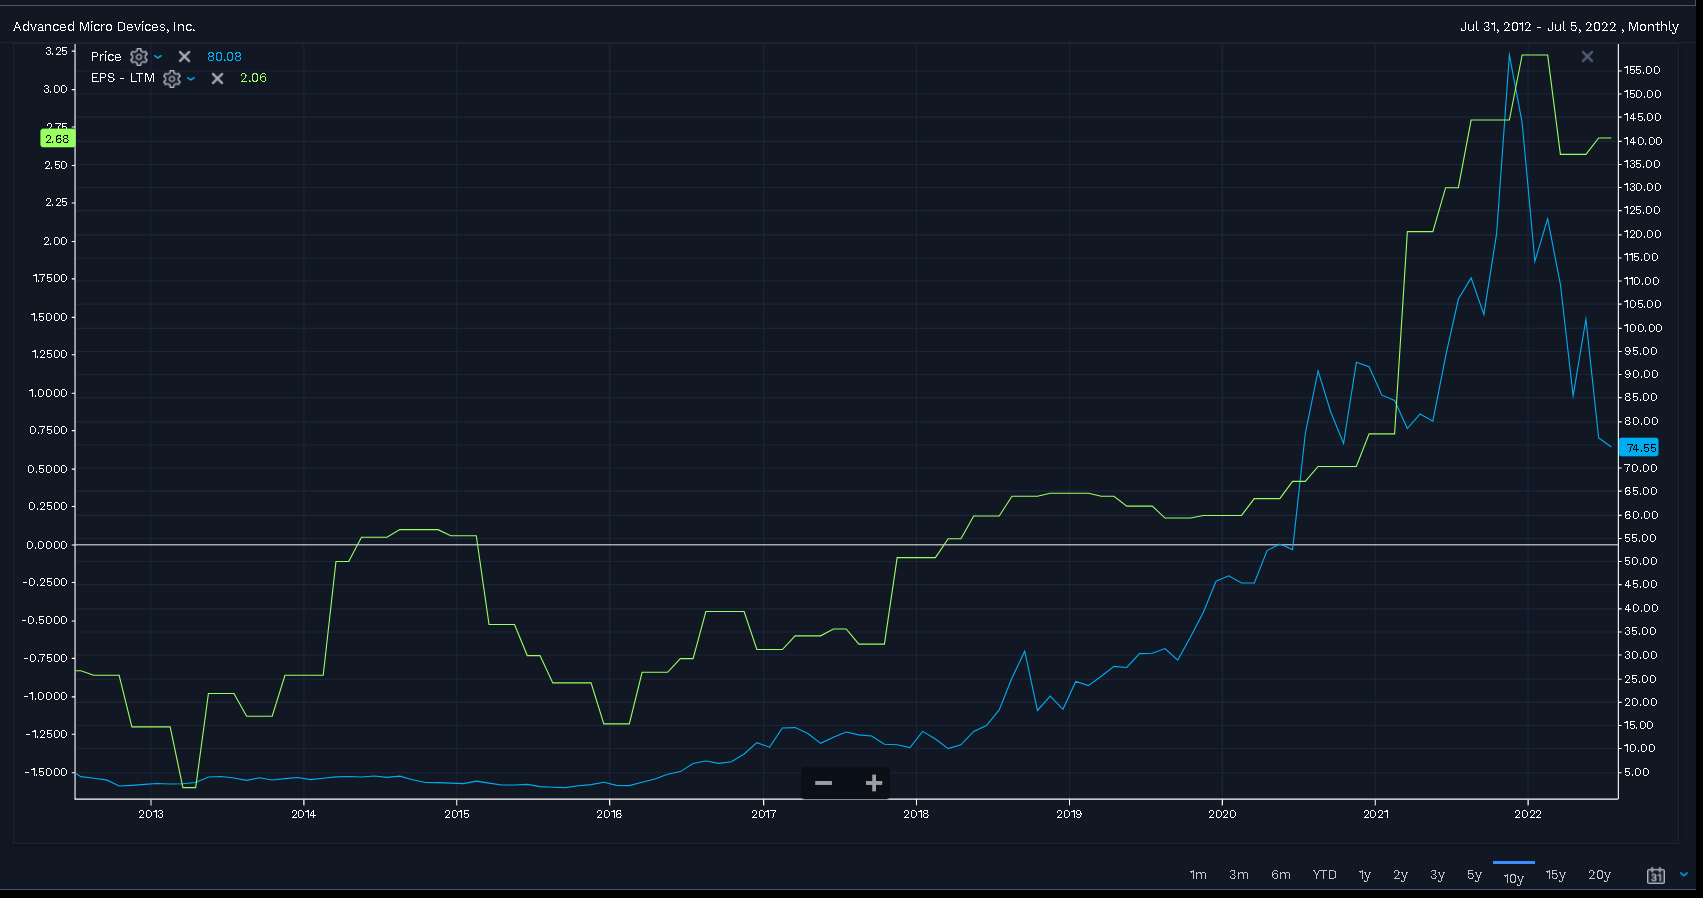
Graph taken from FactSet Web Application.
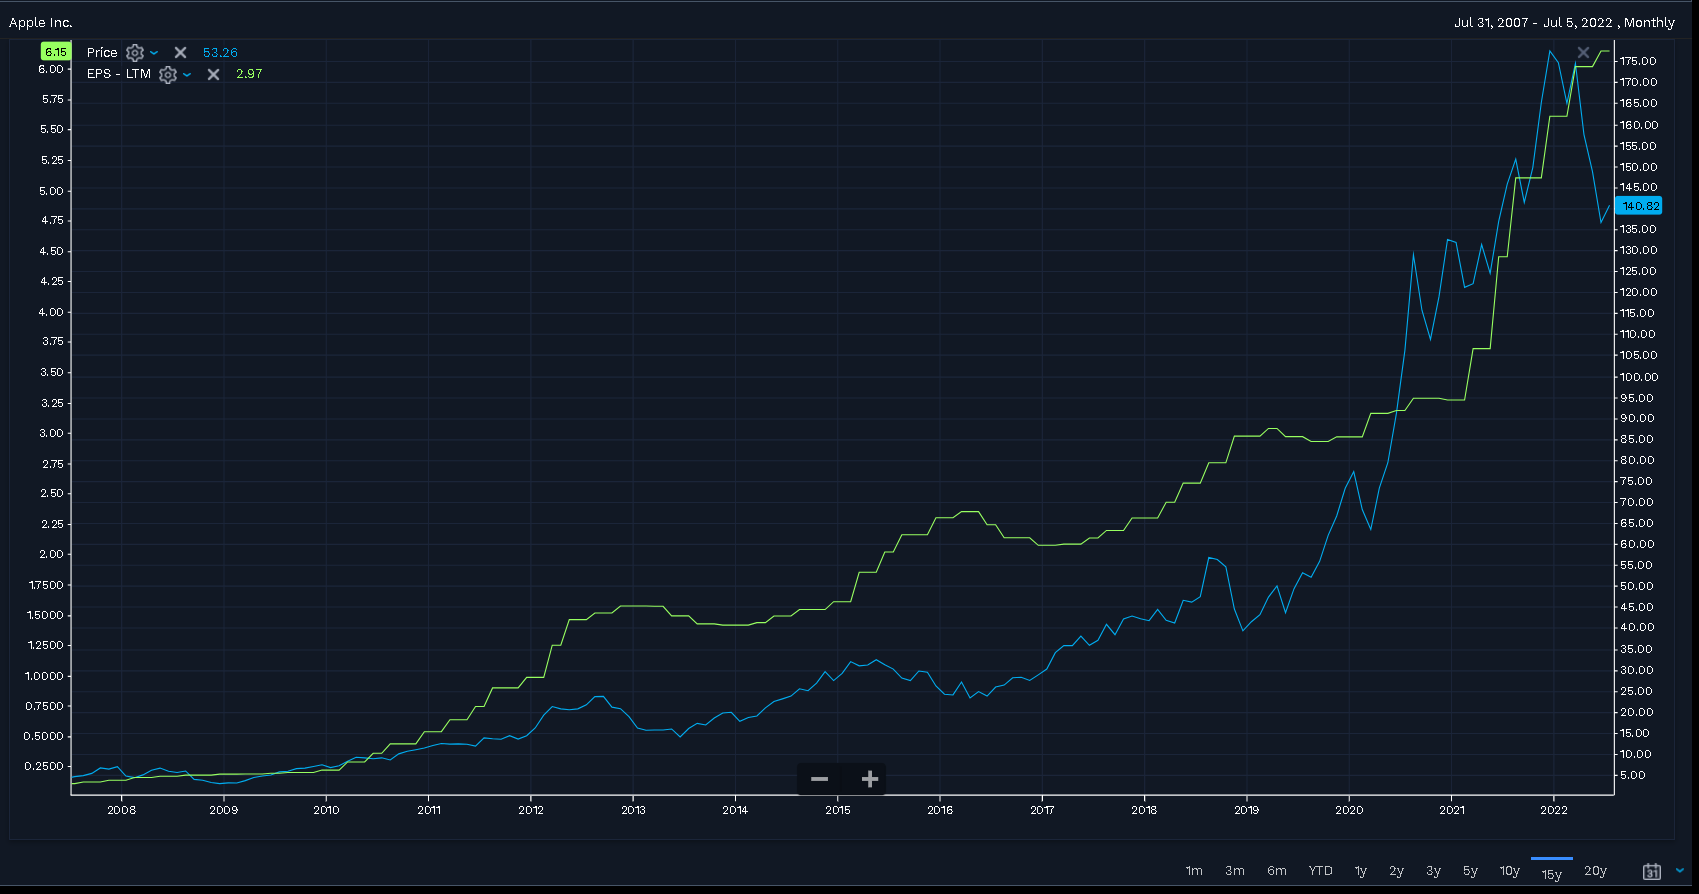
4. Finally, we compare Apple’s (AAPL, blue) stock performance with Blackberry’s (BBRY, orange).
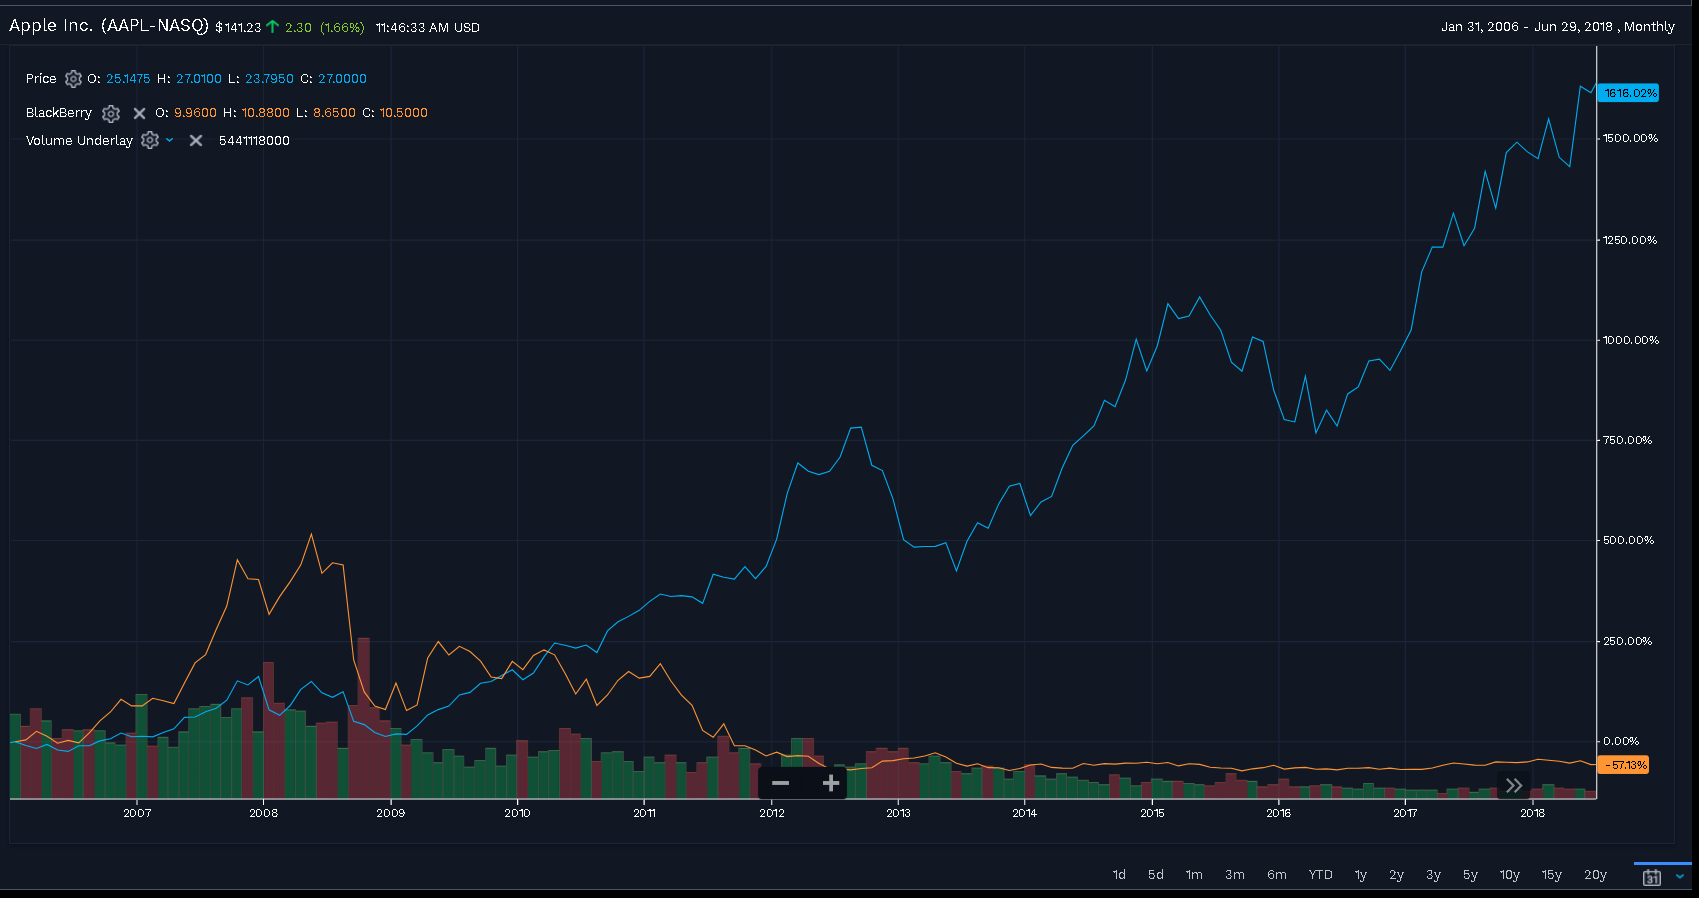
Graph taken from FactSet Web Application.
The theme remains consistent that Apple’s stock performance is supported by its earnings growth.
Graph taken from FactSet Web Application.