As wealth management professionals we have been keeping a close eye on inflation, and its implications for the economy and investment market. It has been a bumpy road of aggressive interest rate increases and stock market volatility, and at long last, inflation may be very near its peak. What comes next?
First let’s take a look at what inflation is – the Consumer Price Index (CPI) represents inflation by measuring changes in prices experienced by consumers. It measures price changes by comparing, through time, the cost of a fixed basket of goods and services.
On October 13, 2022 the U.S. Consumer Price Index surprised economists with an increase to 8.2% between September 2021 and September 2022, compared to economists targets of an 8.1% increase. These numbers are lower than the 12 month inflation rate of 9.1% between June 2021 and June 2022. We are a long way off the U.S. Federal Reserve’s target rate for inflation of 2.0%.
Immediately following the announcement on October 13th, bond markets responded by lifting the yield on the 2-year U.S. Treasury bond by more than 25 basis points (0.25%), reaching its highest level since mid-2007 – indicating that the U.S. Federal Reserve’s aggressive interest rate hikes are expected to continue.
The graph below shows the annual inflation rate over time from 1951 to 2022. The red dots on the graph indicate 15 previous periods of cyclical inflation where the inflation rate has peaked before subsequently declining. The grey area represents periods of time where the U.S. economy has been in a recession.
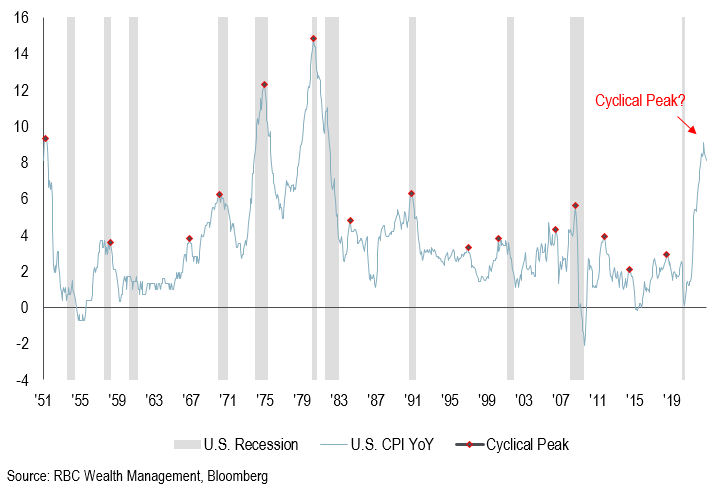
It is possible that we have seen a peak for inflation, and if so, we look to the past as a guide for what may lie ahead.
Below is a chart showing the average performance of the S&P 500 index (consisting of the 500 largest publicly traded U.S. companies) for 3 months, 6 months, 12 months, and 18 months following peak inflation, compared to the overall average S&P 500 returns for the same time periods.
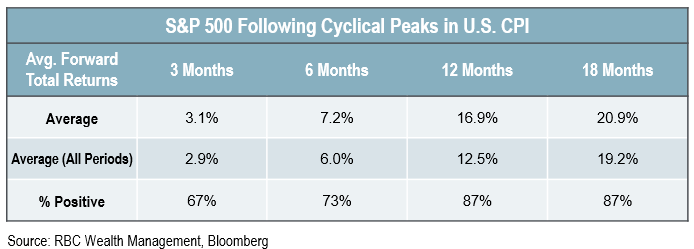
The 15 times that inflation peaked between 1951 and 2022 we found that the S&P 500 performed better than average for 3, 6, 12, and 18 month periods that followed. That is just the news we wanted to hear.
Breaking down the stats a little further… of the 15 peaks, seven of them have coincided with a recession, while eight did not. The chart below shows the 3 month, 6 month, 12 month, and 18 month returns following peak inflation when the peak coincides with a recession.
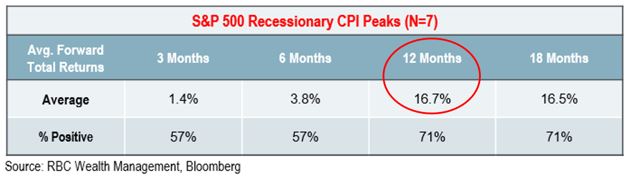
You will notice that the average stock market return for each period was positive. Above, I have circled the average return for the S&P 500, over a 12 month period (after inflation peaks and while coinciding with a recession) which was 16.7% higher.
The uncertainty within today’s economic environment can cloud our views and cause investors to question their long term wealth management strategies. A well designed plan, coupled with high quality investments always prevails over time.
Thank you to RBC Portfolio Advisory Group’s Sean Killin for sharing research and content with me for my blog.
If you have any questions regarding your wealth management plan, or would like a second opinion, do not hesitate to reach out. We are always happy to help.
Brad Weatherill, CIM
Senior Wealth Advisor
Specializing in providing highly customized wealth management solutions for people who expect individual attention, superior customer service, and positive financial results.