Key points
- Growth stocks are a powerful element within most portfolios over the mid and long term given performance dominance.
- Following the strong double-digit returns in 2023, many investors have high hurdles for fundamentals that growth companies will need to deliver.
- Historical Nasdaq performance in the midst of new technology introductions may provide clues to potential performance.
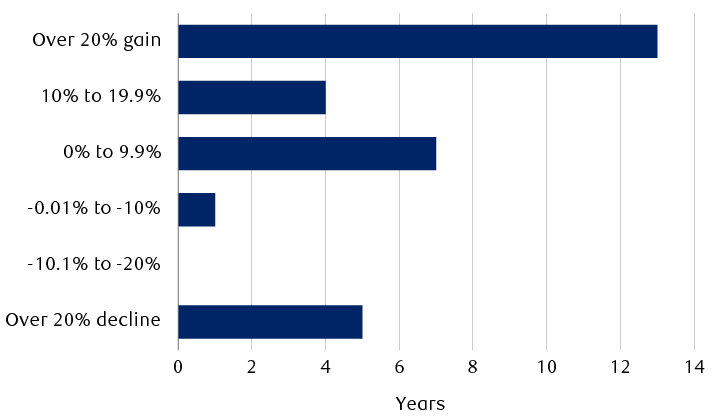
Painful as that year was, 2022 marked only the second year of negative returns for the growth group since 2008; the other down year, 2018, saw a three percent decline. Growth returns tend to go big or go home. Since 1994, growth stocks produced positive returns 80 percent of the time. Forty-three percent of the time, the annual returns were over 20 percent, eight years delivered positive returns over 30 percent, with only two years down over 30 percent (rounding up last year’s decline of 29.8 percent in that calculation). This chart below shows the magnitude of the annual occurrences over that time period.
The Russell 1000 Growth Index has produced a positive annual return in 24 of the past 30 years

The bar chart breaks down Russell 1000 Growth Index annual returns over the past 30 years based on the percentage of gain or loss in that year. The index has had positive returns in 24 of 30 years. Returns have been greater than 20% in 13 years. Returns between 10% and 19.9% occurred in four years. Returns between 0% and 9.9% have occurred in seven years. One year had a negative return between -0.01% and 10%, and there were no years with negative returns between -10.1% and -20%. The index declined by more than 20% in five of the 30 years.
Source - RBC Wealth Management, FactSet; data through 12/31/23
Good returns, great expectations
The compound annual growth rate (CAGR) for the Russell 1000 Growth Index has averaged 18 percent over the past five years. These returns may naturally prompt the question, “What type of companies tend to be included in this elite group, known as growth stocks, and why would an investor stomach the wild volatility that can accompany owning them?”
Although definitions are plentiful about what constitutes a growth stock, most growth companies would check several, if not all, of the following metrics:
- The companies generate annual revenue growth consistently and above the overall growth of the broader economy, typically measured against gross domestic product (GDP), or the S&P 500.
- The growth rates for revenue outpace the specific company’s broader industry in which it operates.
- The revenue, income, and free cash flow growth are expected to sustain elevated levels driven by company-specific initiatives and strategies that grow market share and end-markets.
- Growth companies are often able to sustain superior growth rates for longer than most investors expect by virtue of business models that benefit from secular versus cyclical growth. Secular growth is supported by drivers, themes, and technology that often materially change how individuals live and work, and companies operate. “Cyclical growth” relates to firms that are materially influenced by the business cycle.
- Investors tend to be less discerning, and more accepting, of paying higher valuations for growth companies. Popular valuation methodologies include price-to-earnings; enterprise value-to-sales, which is often used when companies lack earnings (think of Amazon for its first six years of being public, although operating income really began its ramp up after 2015); enterprise-value-to-earnings before interest, taxes, depreciation, and amortization (another alternative valuation methodology when earnings remain negative but the company is profitable before interest and taxes); and/or enterprise value to free cash flow.
- Growth companies tend to operate in the Information Technology, Consumer Discretionary, Health Care, and Industrials sectors. These sectors are weighted within the Russell 1000 Growth Index at approximately 52 percent, 19 percent, 10 percent, and 10 percent, respectively.
A different setup in 2024
With the gift of hindsight, the forces behind the pendulum of growth returns from the 2022 correction to the 2023 rally, were in place to start last year.
First, the year began with investor sentiment at levels as bearish as during the worst of the 2008–2009 global financial crisis. Such a level of extreme bearishness has always proved unsustainable and often precedes a period of strong outperformance.
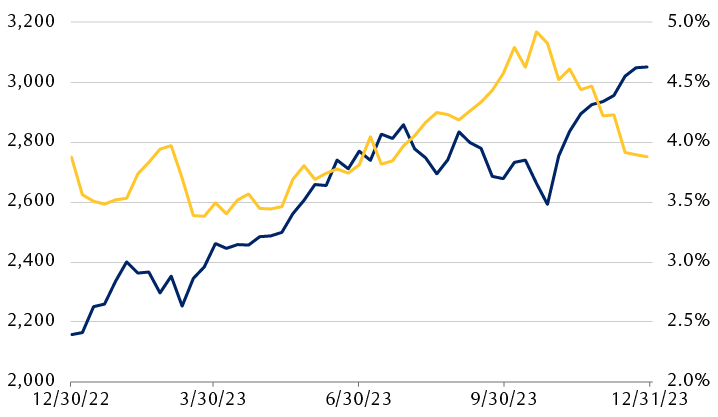
Second, growth tends to outperform value when the 10-year Treasury yields come down. In reality, the 10-Year Treasury yield began 2023 at 3.88 percent and, interestingly, ended the year at that very same level. The relationship is shown on the chart below.
Over the course of the year investors became hopeful as inflation cooled, that the Federal Reserve would end its rate hike cycle and probably move on to rate cuts in 2024. That promise of future rate declines lent more and more valuation support to the growth contingent throughout the year. So too did the very strong arrivals of Artificial Intelligence (AI) and Generative AI. The introduction of ChatGPT at the end of November 2022 was like pulling a rabbit out of a hat, reigniting the Technology trade throughout 2023.
Russell 1000 Growth Index price versus the 10-year Treasury in 2023

The line chart compares the Russell 1000 Growth Index and the 10-Year U.S. Treasury yield over the course of 2023. The 10-year Treasury yield began the year at 3.88% and ended the year at the same level, hitting a low of 3.29% in late March and peaking in October at 4.99%. The Russell 1000 Index rose from just under 2,200 at the start of the year to over 2,800 at the end of July, then moved unevenly lower to just under 2,600 at the end of October before rising steadily to end the year above 3,000.
Source - RBC Wealth Management, FactSet; data through 12/31/23
Different starting line today
Investor sentiment ended the year toward the enthusiastic side of the spectrum, at levels where the forward returns for the overall market could be expected to be more muted. Investors have already priced in an expectation that many companies will sustain strong revenue and earnings growth by exploiting AI. Consensus earnings growth expectations for the Tech-heavy Nasdaq versus the S&P 500 are for fundamentals to accelerate in 2024. Today, the Nasdaq forward multiple is 27.3x, and approximately 470 basis points, or 20 percent, has been added to it since the start of 2022. We think this valuation metric only becomes a concern if this group of stocks can’t continue to sustain or accelerate revenue and earnings in 2024. Those companies now need to deliver that kind of performance in 2024.
Nasdaq earnings growth expected to be almost twice that of the S&P 500 in 2024
| Index and metric | 2016 | 2017 | 2018 | 2019 | 2020 | 2021 | 2022 | 2023E | 2024E | 2025E |
|---|---|---|---|---|---|---|---|---|---|---|
| S&P 500 EPS | $117.42 | $130.19 | $158.00 | $157.22 | $135.89 | $205.05 | $214.33 | $217.06 | $242.59 | $273.98 |
| Nasdaq EPS | $244.65 | $279.03 | $327.98 | $292.67 | $281.21 | $431.45 | $401.09 | $456.57 | $562.00 | $678.65 |
| S&P 500 growth | 0.8% | 10.9% | 21.4% | -0.5% | -13.6% | 50.9% | 4.5% | 1.3% | 11.8% | 12.9% |
| Nasdaq growth | 5.5% | 14.1% | 17.5% | -10.8% | -3.9% | 53.4% | -7.0% | 13.8% | 23.1% | 20.8% |
Source - FactSet; data through 1/17/24
A note on the Nasdaq
The Nasdaq ended 2023 advancing 43 percent, a bit higher than the Russell 1000 Growth Index. The Nasdaq is approximately 57 percent weighted with the Technology sector. This sector’s performance surpassed the other 10 by returning almost 56 percent this past year. History provides some insight as to what the future may hold for growth stocks following a year of heady double-digit returns driven by the promise of a transformative technology.
Three examples come to mind. First, the Apple computer was created in 1976. Second, Netscape became the first browser introduced and established the World Wide Web for the masses in 1994. Third, Amazon launched Amazon Web Services in 2006 with Apple’s iPhone arriving the following year. The table immediately below shows the six years of consecutive Nasdaq returns starting with the introduction of the three watershed technologies.
Near-term Nasdaq performance following technology transformations
| Year | Return |
|---|---|
| 1976 | 26% |
| 1977 | 7% |
| 1978 | 12% |
| 1979 | 28% |
| 1980 | 34% |
| 1981 | -3% |
| Year | Return |
|---|---|
| 1994 | -3% |
| 1995 | 40% |
| 1996 | 23% |
| 1997 | 22% |
| 1998 | 40% |
| 1999 | 86% |
| Year | Return |
|---|---|
| 2006 | 10% |
| 2007 | 10% |
| 2008 | -41% |
| 2009 | 44% |
| 2010 | 17% |
| 2011 | -2% |
Source - RBC Wealth Management, FactSet
There is at least one other factor to consider with respect to growth stock investing in 2024. The Nasdaq began trading in February 1971. There have been 13 U.S. elections since that time, and 10 of those produced positive returns with an average of 20 percent. The three election years that experienced negative returns averaged a 30 percent decline. Comparing the growth style of investing to value during these periods, data since 1980 for 11 elections shows value outperformed growth 72 percent of the time.
Growth has lagged value investing during most election years
| Year | Russell 1000 Growth | Russell 1000 Value |
|---|---|---|
| 1980 | 35.2% | 16.3% |
| 1984 | -3.9% | 3.5% |
| 1988 | 8.5% | 17.2% |
| 1992 | 2.7% | 9.4% |
| 1996 | 21.5% | 18.1% |
| 2000 | -22.8% | 4.9% |
| 2004 | 5.2% | 13.7% |
| 2008 | -39.3% | -38.8% |
| 2012 | 13.3% | 14.5% |
| 2016 | 5.3% | 14.3% |
| 2020 | 37.1% | 0.1% |
Source - RBC Wealth Management, Bloomberg; annual data 1980–2020
Patience, pullbacks, and possibility
The Russell 1000 Growth Index has outperformed the Nasdaq, S&P 500, and Russell 1000 Value over the past five years, and holds a top 2 position on three-year and 10-year bases. The performance dominance of this investing style makes it a powerful tool in both portfolio construction and investment returns. Growth stocks tend to be more volatile and have deeper corrections as a group and, therefore, exposure should be managed to personal risk tolerance. We think patience is required to capitalize on both the volatility and opportunity.
