
Below is a summary of some of the relevant news items from the Capital Markets and the Economy from the past week extracted from RBC Global Insights and FactSet Research.
You can catch up on the past four weeks’ Weekly Update in the link to my Blog.
Read my latest Smart Investor newsletter on my website. The Q3 2025 edition covers Market Review for first half of 2025, the impact of tariffs, and alternative investments. Shiuman’s Corner is about classical music as balm.
Markets
Market scorecard as of close on Friday August 8, 2025.
| Country | Equity Indices | Level | 1 week | YTD |
| Canada | S&P/TSX Composite | 27,759 | 2.7% | 12.3% |
| U.S. | S&P 500 | 6,389 | 2.4% | 8.6% |
| U.S. | NASDAQ | 21,450 | 3.9% | 11.1% |
| Europe/Asia | MSCI EAFE | 2,680 | 2.8% | 18.5% |
Source: FactSet
- TSX closed little changed. Most sectors higher. Communication services the top performer. Canadian equities 2.7% weekly gains were led by tech and precious metals.
- US equities finished higher in uneventful Friday trading, though ended a bit off best levels. Nasdaq set a fresh record high. Stocks notched strong weekly gains with S&P up more than 2% and Nasdaq up nearly 4%. Big tech was mostly higher.
- On balance, strong corporate earnings results to date, alongside a series of constructive trade developments, have provided a foundation for cautious optimism. Nevertheless, with equity markets trading near all-time highs and elevated valuations, we remain mindful that expectations have risen meaningfully. While corporate fundamentals remain broadly supportive, this heightened bar of expectations could leave markets relatively more sensitive to negative surprises in the near term.
Economy
Canada
- U.S. tariffs officially took effect on Aug. 1, raising duties on Canadian imports to 35%, up from the 25% imposed in March. The U.S. justified the increase by citing Canada’s insufficient actions to curb fentanyl trafficking and its retaliatory trade measures. However, goods covered under the United States-Mexico-Canada Agreement (USMCA) remain exempt and, according to RBC Economics, Canada should maintain one of the lowest effective tariff rates of any major U.S. trade partner.
U.S.
- Momentum in the U.S. economy appears to be fading, with several key indicators flashing warning signs. The July jobs report disappointed, showing just 73,000 non-farm payrolls added—well short of expectations for 115,000. Meanwhile, July’s ISM Services report added to the concern: the U.S. Services Purchasing Managers’ Index slipped to 50.1—barely above contraction.
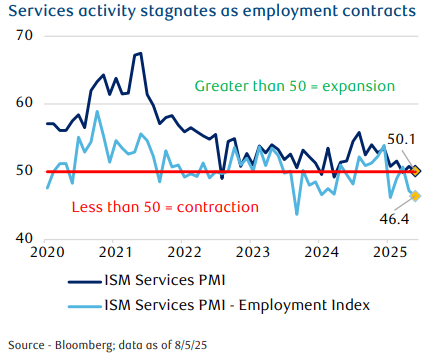
- Taken together, the data suggest to us the slowdown is no longer isolated but is starting to spread across the economy.
Further Afield
- U.S. President Donald Trump doubled tariffs on Indian goods to 50% as a penalty for its purchases of Russian oil. While only a small share of India’s gross domestic product (GDP) relies directly on U.S. demand, a tariff of this magnitude is material enough to have meaningful effect on exports.
- India’s tariff rate is also much higher than those imposed on other Asian countries such as Vietnam (20%), Indonesia and the Philippines (19% each), and even China (around 40%). We believe this rate would erode India’s attractiveness as a China alternative for supply-chain diversification.
Notes About Companies in Model Portfolio
- The Q2 S&P 500 earnings reporting season has been fair-to-good so far, from our vantage point. Earnings are on pace to grow 10.4 percent year over year (y/y), well above the 2.8 percent consensus estimate just before the reporting season began, according to Bloomberg Intelligence data. A little over 81 percent of firms have exceeded the consensus earnings growth forecast, above the 75 percent average since 2014.
-
- RBC Capital Markets, LLC Head of U.S. Equity Strategy Lori Calvasina pointed out that management teams’ comments on earnings conference calls have reflected the lackluster levels of corporate confidence in recent CEO and CFO surveys. After reviewing numerous earnings call transcripts, she remarked that “we have a long way to go to understanding how the recent changes in trade policy will impact demand and 2026 outlooks.”
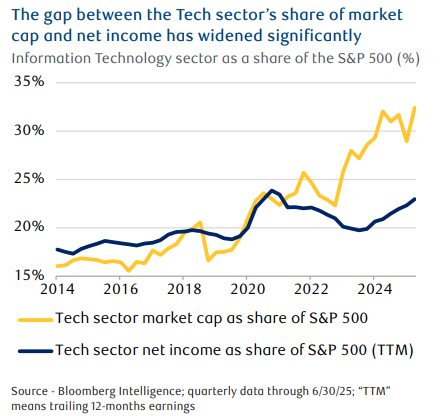
- Since late 2022, the Tech sector’s market capitalization (market value) as a proportion of the S&P 500’s total market cap has expanded meaningfully, from around 22 percent to over 32 percent. Yet at the same time, the Tech sector’s net income (net earnings or net profits) as a proportion of the S&P 500’s total net income hasn’t moved up much. It’s risen from 21 percent in late 2022 to 23 percent recently.
- Element Fleet Management (EFN) Reports results for Q2 2025. Net revenues grew 6% year-over-year, supported by higher services and net financing revenue despite an unfavourable foreign currency translation impact of $10 million. On an adjusted basis, diluted EPS of $0.30 in Q2 2025 represented a 7% year-over-year increase.
- Eli Lilly (LLY) reports results for Q2 2025. Revenue in Q2 2025 increased 38% to $15.56 billion driven by volume growth from Zepbound and Mounjaro. Q2 2025 EPS increased 92% to $6.29 on a reported basis and increased 61% to $6.31 on a non-GAAP basis.
- Pembina Pipeline Corporation (PPL) Reports results for the Q2 2025: second quarter earnings of $417 million, adjusted EBITDA of $1,013 million, and adjusted cash flow from operating activities of $698 million ($1.20 per share).
Feel free to contact me with any questions and/or to discuss investment ideas.
Regards,
Shiuman
PS: To unsubscribe, simply reply with “Unsubscribe” in the subject line.