
The Q4 2023 rally in seemingly everything caught most investors off guard, particularly in fixed income markets. The U.S. 10-year Treasury yield peaked near 5.0 percent on Oct. 19, only to fall to around 3.9 percent by the close of 2023. A drop of that magnitude over such a short timespan has only been seen about five times dating back to 1990. And it is a similar story globally as the German 10-year Bund yield ascended to a decade high of nearly 3.0 percent in October, only to drop back below 2.0 percent by year end. The decline in sovereign bond yields helped to fuel a well-publicized rally in risk assets, with most major global stock indexes also posting historically strong rallies.
All of which was largely predicated on the idea that not only have central banks well and truly reached peak policy rate levels, but that greater progress on inflation than markets expected could cause banks to pivot to modest rate cuts, and perhaps sooner than many market participants had anticipated.
As is usually the case, the path forward for central bank policy rates and sovereign bond yields will likely dictate the trajectory of asset class returns this year, and therein lies the near-term risk—did bond markets run too far, too fast?
A thief in the night
In our Global Insight 2024 Outlook, we projected a base case of low double-digit returns for most U.S. bond sectors, with the potential for even greater returns should the benchmark 10-year Treasury yield fade below 4.0 percent by year end.
Unfortunately, Q4 of last year perhaps robbed 2024 of some of those returns. As the chart shows, the Bloomberg U.S. Aggregate Bond Index advanced by 6.8 percent as yields fell, the best quarterly performance in at least 30 years. Bond prices, which move inversely to yields, jumped as a result. The average bond price in the index bounced from $86 to $92 over the course of Q4.
Bloomberg US Aggregate Bond Index posts a quarter for the record books
Quarterly total returns
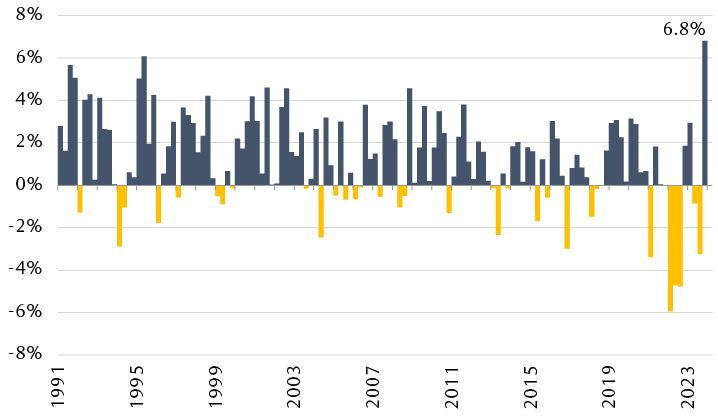
Bar chart showing quarterly total returns for the Bloomberg US Aggregate Bond Index since Q1 1991, with Q4 2023 posting the largest gain during this period with a return of 6.8%.
Source - RBC Wealth Management, Bloomberg; quarterly data through Dec. 2023
In the U.S., while the Federal Reserve projected three 25 basis point rate cuts this year to an implied target range of 4.50 percent to 4.75 percent at its December policy meeting, the market is currently priced for significantly more cuts down to an implied target range of 3.75 percent to 4.00 percent by year end, with a first cut potentially by the March meeting—though that is not yet our base case.
Given the current divergence between Fed and market rate cut expectations, broad volatility will likely remain elevated as each key piece of economic data could spark market swings one way or the other as traders gauge both the timing and extent of central bank rate cuts this year.
Bond strategy
Despite the recent run in bond market performance, we still expect healthy returns in 2024 for bonds. However, we would turn slightly cautious over the near term. While we strongly favored a strategy of swapping cash and short-dated securities in favor of longer-dated bonds in the back half of 2023 in order to lock in historically high yields, cash or money market funds which still offer annualized yields north of 5.0 percent could be a worthwhile parking spot on a tactical basis in anticipation of more attractive entry points into longer-dated bonds. Of course, investors need to be cognizant of the fact that those short-term yields will begin to fade if and when the Fed embarks on a rate cut journey.
In framing the near-term outlook, we focus on the benchmark U.S. 10-year Treasury yield. Currently around 4.0 percent, we view approximately 4.3 percent as a potential ceiling and where we would look to put money to work should the market dial back rate cut expectations. On the downside, we see a floor for the 10-year around 3.50 percent this year.
Economic and market optimism has pushed valuations in U.S. municipal and corporate bond markets to historically rich levels relative to comparable Treasuries. Therefore, we would also take a cautious approach for the time being to those sectors.
Not much of a wake-up call
The first reality check for markets in 2024 was this week’s U.S. Consumer Price Index report. On the surface, inflationary pressures rose more than Bloomberg consensus estimates had expected, but the market reaction was relatively muted regardless. As Fed Chair Jerome Powell has often stated, the path back to two percent annual inflation was always going to be a bumpy one, and the inflation data for December was perhaps one of the bumpy ones as headline inflation rose to 3.4 percent year over year, up from 3.2 percent annually in November—though core prices (excluding food and energy) fell to another low of 3.9 percent annually.
Despite a slight uptick in inflation, real wages—adjusted for inflation—were shown to have increased by 0.8 percent over the past year, marking the eighth month running that incomes have outpaced inflation. As a result, consumers remain in a strong position to consume, which likely caused RBC Economics to boost its near-term economic outlook for the U.S., seeing Q1 GDP growth as being flat, up from minus 1.0 percent previously, with the U.S. economy seen as now likely to avoid a recession again this year.
Everything in moderation
Of course, with the unemployment rate still well below four percent and inflation north of the Fed’s two percent target, it may be natural to ask why the market is even entertaining the idea of multiple rate cuts, let alone any rate cuts.
As the chart shows, it simply comes down to policy calibration. Despite an uptick in inflation last month, the trend of lower inflation is likely to remain in place as RBC Capital Markets still expects further declines this year, along with comparable reductions in the Fed’s policy rate.
“Normalization” of inflation should drive a “normalization” of policy rates
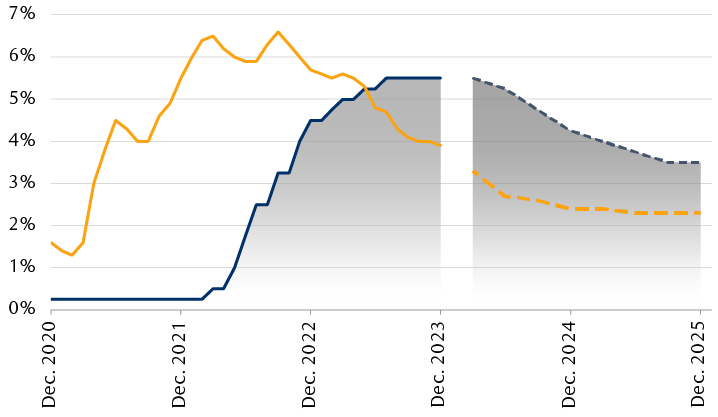
Line chart showing the evolution of inflation and the Federal Reserve's policy rate response since December 2020. RBC Capital Markets forecasts suggest the Fed will gradually ease policy rates as inflation continues to fade toward the Fed's 2% target by the end of 2025.
Source - RBC Wealth Management, Bloomberg; dashed lines show RBC Capital Markets quarterly forecasts
The gap between the Fed’s policy rate and the rate of inflation is the “real” rate, and that’s the rate which has actual implications for the economy, in our view. The main point being that even if the Fed cuts rates multiple times this year, monetary policy may not actually be easing, but simply remaining steady and therefore not risking undue economic damage, in our view, should real policy rates rise too far, and for too long.
All told, we still see rate cuts on the horizon, but the road there likely won’t be without some bumps, with bond markets potentially being a near-term source of broader market volatility.