The Inverted Yield Curve
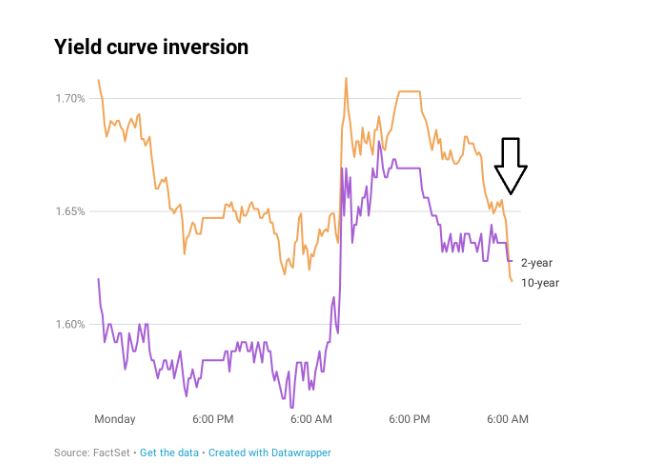
For those of you on holiday, or just happy to enjoy your life without fretting daily about the stock market, you may have missed the little upset we had this week. Specifically the much watched relationship between 2 year interest rates and 10 year interest rates in the U.S. Historically, when 10 year rates dip below 2 year rates, at some point in the (relatively) near future, we have an economic recession. On Wednesday we briefly saw 2 year rates at 1.632% and 10 year rates slightly lower at 1.623% (by days end this inversion had vanished, with 2 year rates dropping to 1.58% and 10 year remaining at 1.63%).
So what does this really mean?
The last time we saw this rate “inversion” was in 2005, over 2 years before we saw the recession of 2007/08, which saw a decline in the equity markets of over 40%. However, historically the time lag has averaged 22 months, so no need to panic quite yet. Without getting into technicalities, this inversion means that investors would rather buy 10 year bonds than they would 2 year bonds, indicating their nervous short term outlook for the economy, versus their more positive longer term outlook.
However, although yield inversions have preceded most recessions over the last 50 years, there have been occasions where no recession followed their inversion.
Historically,
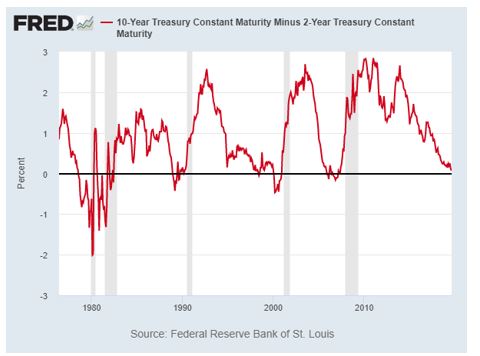
- The last five 2-10 inversions have eventually led to recessions.
- A recession occurs, on average, 22 months following an inversion.
- The U.S. market is up, on average, 12% one year after a 2-10 inversion.
- Average time to recession (and a downturn in the market) after an inversion is 18 months.
- Historical inversions of the 2-10 curve (recessions marked in gray)
So while we may be in for slower markets at some point in the future, the likelihood of that happening in the short term (12 – 18 months) is relatively low, and not being invested may lead us to missing out on some significant gains. However 18 months out from now, we should look to reduce equity exposure in anticipation of a more significant decline, and that is exactly what I will be doing early in 2021.
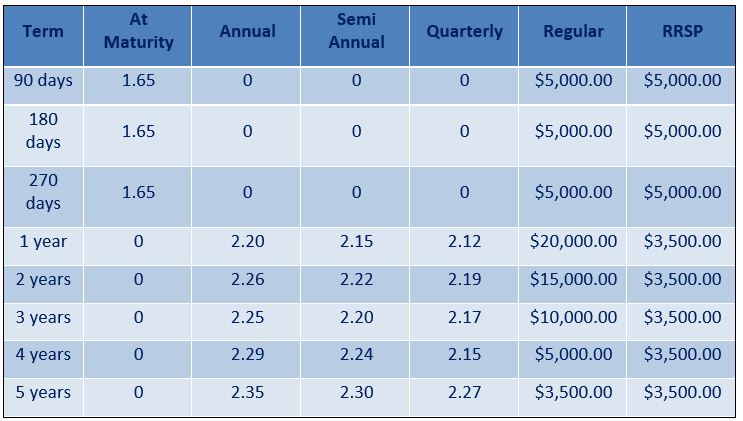
Current GIC rates*
Privacy & Security | Legal | Accessibility | Member-Canadian Investor Protection Fund
RBC Dominion Securities Inc. and Royal Bank of Canada are separate legal entities which are affiliated. *Member-Canadian Investor Protection Fund. RBC Dominion Securities Inc. is a member company of RBC Wealth Management, a business segment of Royal Bank of Canada. ® / TM Trademark(s) of Royal Bank of Canada. Used under licence. © RBC Dominion Securities Inc. 2018.
All rights reserved.