“Most people who have been really successful in the securities markets say the same thing — that they’re not smart enough to get into the market and out of it. So they tend to remain more or less in the market at all times.” – Walter Schloss (one of the investing greats)
Note that the contents of this memo are all my thoughts, and not the views of RBC Dominion Securities.
Friends & Partners,
This month I bring you my memo a few days early – it has been a few years since my family is to head on vacation for a few days, so I’m trying to reserve some quality time with them. Though, as most of you know by now, I’m never really ‘off’ regardless of a vacation, time of the day or day of the week (as I’m writing this note in part at 5am on a weekend morning). Being a steward of many people’s wealth brings its unique pressures, but I also enjoy it thoroughly and wouldn’t want it any other way. I would also expect this work ethic in my wealth managers.
Markets remain very volatile as interest rates shoot higher, and punish most investors in both equities and bonds. This is on top of spiking commodity prices and inflation, the war in Ukraine, negative fiscal stimulus, and COVID lockdowns accelerating an economic slowdown in China. Markets can take negative news, but tend to struggle with the unknown – and the current unknown remains how high rates will go and how quickly they will get there. Krishna Guha from ISI pointed out last week that “markets are abuzz with talk of a possible 75bp hike from the Fed after formerly dovish San Francisco Fed president Daly discussed the possibility of moving in 25, 50 or 75bp increments... Daly's comments were read by many as suggesting that 75bp is seriously in play.” This is a big move in interest rates and fast.
Both global stocks and bonds are down significantly this year, and punishing the traditional 60/40 portfolio mix. It is rare to see them both down at the same time – bonds are traditionally the ‘ballast’ to equities, and rise when equities fall. Not so much this time – and this is has been a very loud and core message of mine for the past 18 months (and in more detail on the presentation at the top of the main page of my website).

On top of this, market sentiment is at 30 year lows, and lower than the depths of Covid in spring 2020 – if you’re scared, cautious and bearish, you’re not alone! But remember, the masses are the most bearish at bottoms, not tops. Or as Warren Buffett says: "You want to be fearful when others are greedy, and greedy when others are fearful."
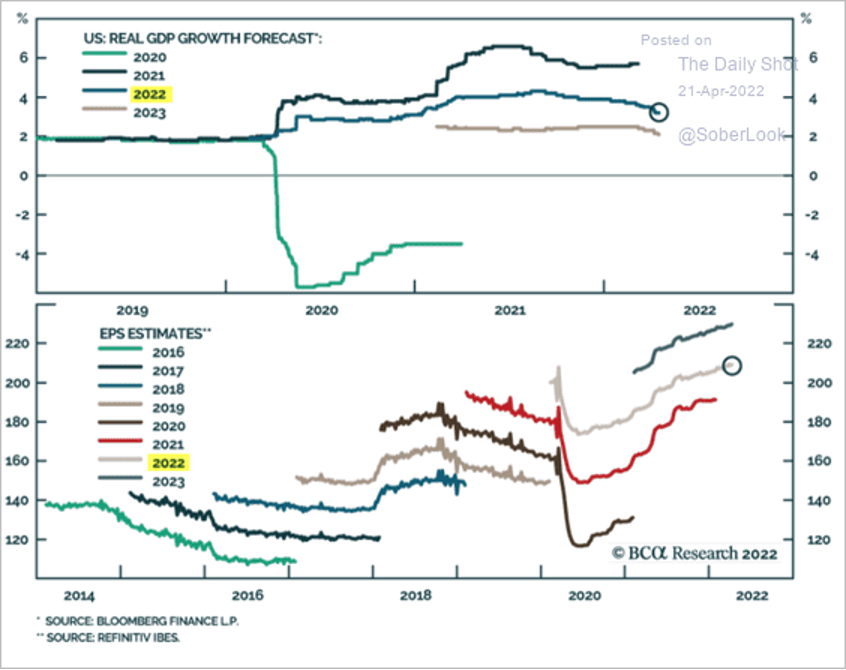
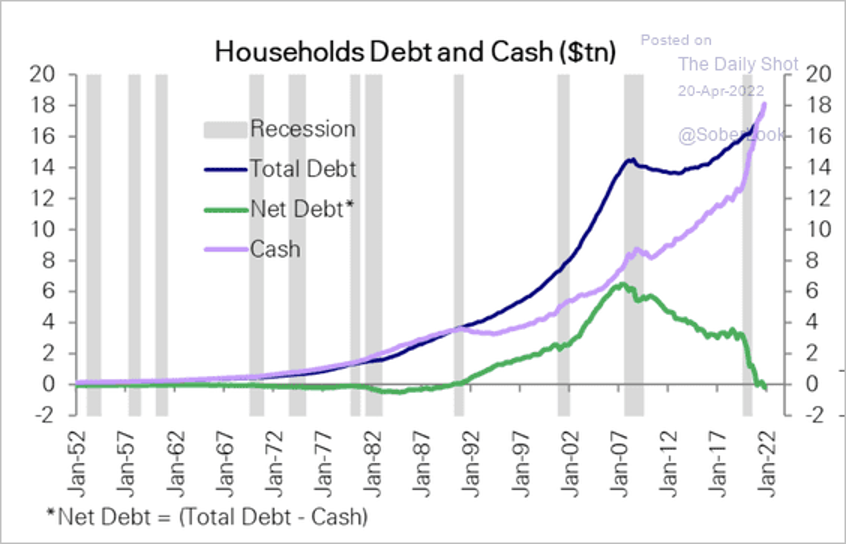
As negative as many are on the economic outlook as well as company earnings, earnings estimates have been actually strengthening despite projections for slower GDP growth. And US consumers are flush with cash – in fact, household cash exceeds debt for the first time in 30 years (in Canada that’s a different story, cue the real estate Armageddon predictions).
So the outlook isn’t all bleak, and may be decent if you think medium and longer term (as you should be!) – 2022 will likely continue to be volatile and chop along as markets grapple with the changing interest rate environment, but then we could be off to the races. There is a respectable probability of a replay of the environment we experienced in 1994, a year that saw 250 bps of Fed tightening, something we haven’t seen since. So here’s what happened in 1994 (excerpts from infamous PM Bob Decker), does this sound familiar?
In 1994, the bond markets are rocked by a surprisingly hawkish Federal Reserve after they hike rates, removing the stimulus provided during a severe recession two years prior. This year becomes a famously brutal year for bond investors and even included a 75 basis-point hike. Interest rates rise throughout the year and stock prices chop sideways as valuations compress, but earnings rise.
The economy continues to do better than the stock market until signs of a slowing economy are sufficient to allow a rally in both bonds. The equity bull market resumes after a choppy trading range year. Bullishness soars after a tough transition to a higher rate regime.
Maybe the 'soft landing' scenario is too Pollyanna for you… But no one believed it in '94 either.
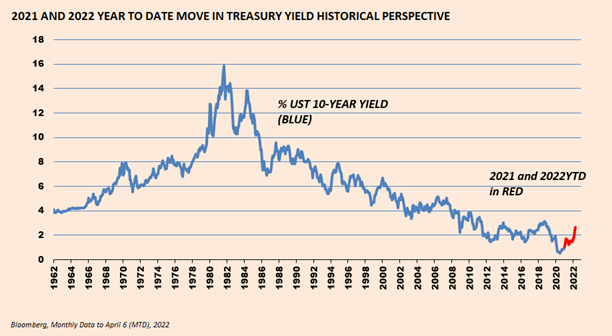
Traditionally ‘Safe’ Assets Are Getting Crushed, Along With Your ‘Balanced’ Portfolio*
This means fixed income, which has had its roughest start to the year in decades.
If you have investments with another Advisor, or with a bank or investment deals, chances are you own some of these funds below. Combine that with the inflation rate, and you’ve potentially lost over 20% in real dollars since Jan 1/21:

Do you think the pain is over for fixed income assets? Potentially in the short term as markets tend to overshoot, but look at this move in the longer-term context:
The Bear Market is Here, But Has it Passed?*
The average S&P 500 stock has already experienced a bear market decline of at least 20%.
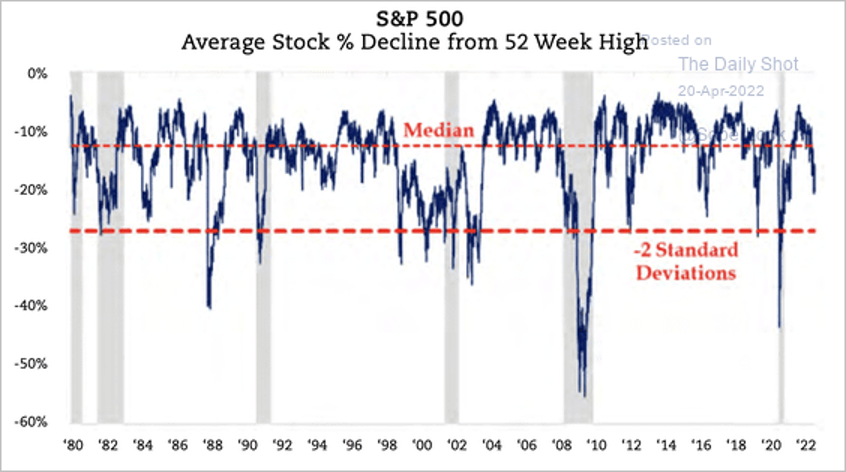
Source: Spinnaker
After negative equity periods like this, performance has traditionally been solid longer term. We looked at the worst 15 quarters for U.S. equities over the past 20 years, and most remember the drawdowns but not the following rebounds. Notably, the recent quarter (Q1 2022) finished 12th worst out of 15 (-4.6%). So what can we learn from this historical data? Here are some key findings: 1) there are very few periods where returns remained negative after 1 and 3 years. And a majority of the time, investors saw double-digit gains one year out. 2) the average quarterly drawdown is -11.1%, and the average return one year afterwards is 17.1%; and 3) this table demonstrates the markets ability to add value over the long term, despite short-term shocks, which are relatively common.
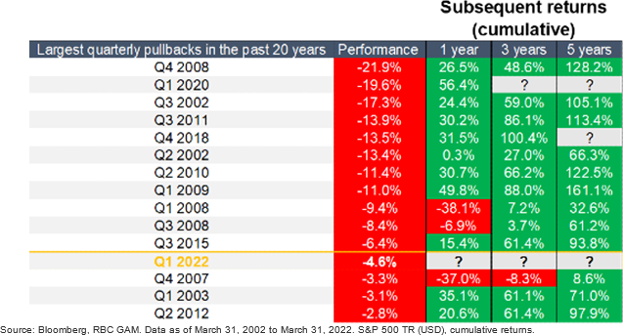
The million dollar question from looking at that data is “are we in another 2007/8 period?” I’m going to take the ‘over’ on that one for now.
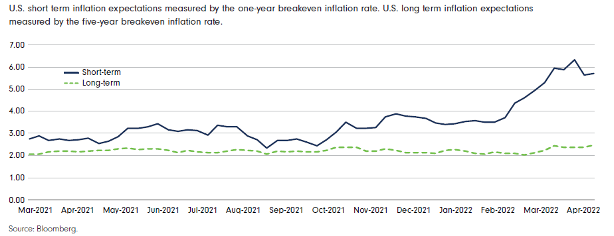
Are we at Peak Inflation?*
We all know inflation is bad, and feel it every day.
The process of taming inflation is never easy, and supply chain bottlenecks will get fixed over time but labour scarcity is a slow moving animal. Demand remains strong, but that may subside, especially if we get an eventual recession. Long term inflation expectations are what really drive ugly inflation over time, and they remain anchored thankfully. Ultimately, we are likely in a deflationary environment longer term, though that is difficult to believe today, and may not get there for a few years yet.
What is the Outlook for the Economy and Corporate Profitability?*
Despite all the warning signs for economic activity moving forward, earnings estimates have continued to rise interestingly:
Source: BCA
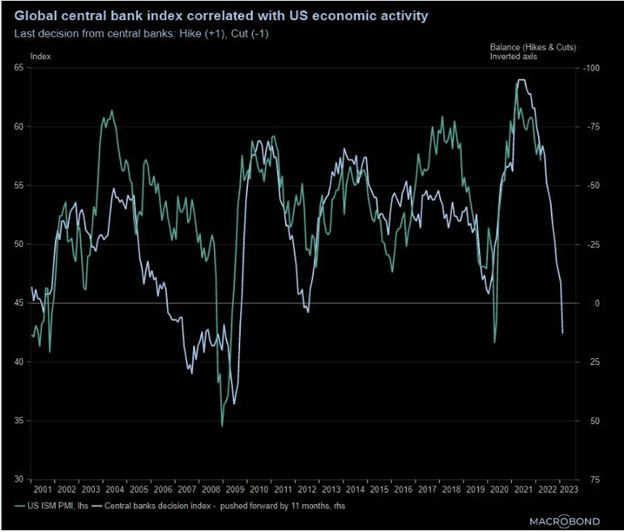
But the economic outlook is certainly mixed at this point, and tracked central bank activity eerily closely, and we all know that central banks are pulling away the punchbowl:
Source: MacroBond
So, for stocks, the million dollar question is will we see a recession, or can they engineer a ‘soft landing’?
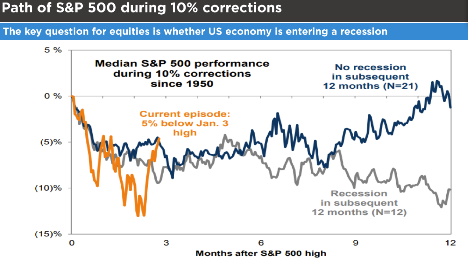
Source: Goldman Sachs
So How Can We Expect Equites to Act Following Yield Curve Inversions and During Hiking Cycles?*
Outside of a few instances, rate hikes don’t necessarily spell disaster for equities:
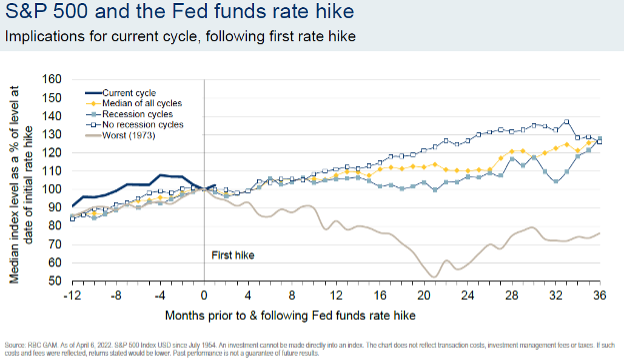
My friend and Chief Strategist at BMO Brian Belski is adamant the end of “Generation QE” (meaning Quantitative Easing) will not bring prolonged havoc as it relates to US stock market performance. He notes that while US stocks have struggled in the initial three months after the Fed’s first interest rate hike of the cycle (with the S&P 500 logging a 1.9% average loss), the index has done well thereafter, gaining 4.7% and 7.5%, on average, in the subsequent six and 12- months, respectively.
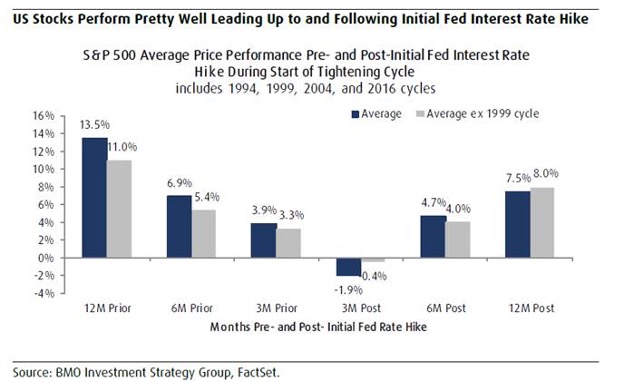
However, following a yield curve inversion, things get trickier. The maximum drawdown in the S&P 500 tends to occur over a year after the yield curve flattens/inverts. But perhaps we’re more like 1994 today which didn’t experience the typical drawdown?:

BONUS ROUND: What’s the Outlook for Real Estate?!*
I will leave you to debate this amongst each other, but it is obvious that interest rates are going higher, and fast. I won’t opine on the supply/demand dynamics in the Canadian housing market, but it’s safe to assume that things will slow at a minimum. The million dollar question is, how much pain will people feel with higher rates? Will that affect all parts of the real estate market?
Americans have learned their lesson from 2008 it appears, carrying less debt and hoarding more cash than their Canadian counterparts.
There are a number of factors that will make Canada more sensitive than the U.S. to rate rises―shorter fixed-term periods on mortgages, higher overall indebtedness, higher debt to disposable income. Canada overtook the U.S. ten years ago and the gap has only widened since; debt to disposable income is now at least 30 percentage points higher on comparable definitions. One thing is for sure, Canadians don’t seem to mind their leverage – so far:

In the US, household cash exceeds debt for the first time in 30 years. Nothing to see here:
Source: Deutsche Bank