"Time is the coin of your life. It is the only coin you have, and only you can determine how it will be spent. Be careful lest you let other people spend it for you." - Carl Sandburg

The world lost a great man last week – Paul “Rocky” Rodwell was a friend and colleague of mine for many years, and had a profound and positive impact on so many around him. He truly understood how to live life to its fullest. He was one of the most considerate people around, and I’ve heard countless stories of him going well out of his way for so many. He worked hard and played hard, and made the most of every moment. He cared deeply for his family and friends, and was one of the most respected and experienced traders on Bay Street – ever. A true juggernaut in every facet of his life. You won’t be forgotten, Rocky. You had a hell of a run.
Friends & Partners,
Equity markets have proven to be volatile, something I have continued to note in the last few monthly letters, and the wide variance of perspective means investors do not have an easy consensus as many pundits getting whipsawed in their ‘calls’ for the market direction. This market remains resilient, while so many keep expecting a significant pullback. We remain in a market with the path of least resistance continuing to be to the upside, with volatility abounding. The market keeps making new highs, COVID cases are generally rolling over but remain a risk, and economic and earnings data remains strong.
Rates continue to creep higher which is positive (reflationary signal), volatility remains subdued, and oil is back on its feet – these are just a few ‘affirmation’ signals. Earnings remain strong and that’s an important, and unsung, support factor for this market. Regarding COVID, markets embraced two potentially positive developments: first, COVID cases appear to be peaking right on schedule compared with previous Delta outbreaks in the UK and India. Second, the FDA approval of the Pfizer vaccine has emboldened numerous companies and organizations (Disney, Goldman Sachs among others) to require vaccines to work in the office, an effort that, while controversial, will continue to increase the vaccination percentage.
So, if we assume no Fed policy mistake on tapering (i.e. not tapering too quickly) and that we don’t have anything major happen on the U.S. fiscal front (i.e. no material tax increases), support remains for the markets through year end. And while that doesn’t guarantee material gains in equities and continued low volatility from here, it does significantly reduce the chances we see a sustained decline.
But, continue to expect volatility even if we continue to grind higher. We can dampen the effect of pullbacks by utilizing process and constructing resilient portfolios built to dampen the downdrafts while capturing the bulk of the upside. Yes, this is possible, but not easy...
Covid and the Delta Variant Aren’t Slowing Down the Markets or the Economy – How Could That Be?*
Part of the reason stocks are back at new highs is because markets have adopted the view that the Delta wave in the U.S. has peaked and as such the economic headwind has also peaked. That’s important because if this is the worst of any COVID-inspired economic slowdown, then the macroeconomic outlook remains bright (and the economic recovery will remain strong).
Other than seeing a slight decline in daily new cases (which can be volatile) the main reasoning for the growing view that COVID has peaked comes from the IHME, the Institute for Health Metrics and Evaluation. If you haven’t heard of this, it’s essentially a healthcare think tank/data aggregation organization that was founded in 2007 by the Gates Foundation and the State of Washington. Since 2020, they’ve been running prediction models on COVID trends, and they’ve been pretty accurate. And based on what we saw in India and in the UK Delta variant outbreaks, the IHME predicted that the peak of this COVID outbreak occurred on August 21. Positively, that prediction is largely being backed up by the fact that 1) The positivity rate of cases is now falling (down 1% to 9.7% over the past few days), 2) Hospitalizations (which are a lagging indicator but given insight into the peak of cases) are now falling and 3) The seven-day moving average of cases is starting to roll over. And, based on what happened in India and the UK, the IHME predicts that daily new cases will drop by 40% over the next month and be down by more than 50% by October.
U.S. regulators are also likely to approve COVID booster shots sooner than previously expected. Both headlines suggest we are getting closer to the end of the pandemic with each new measure and vaccine development, which is an obvious positive for economic growth going forward.
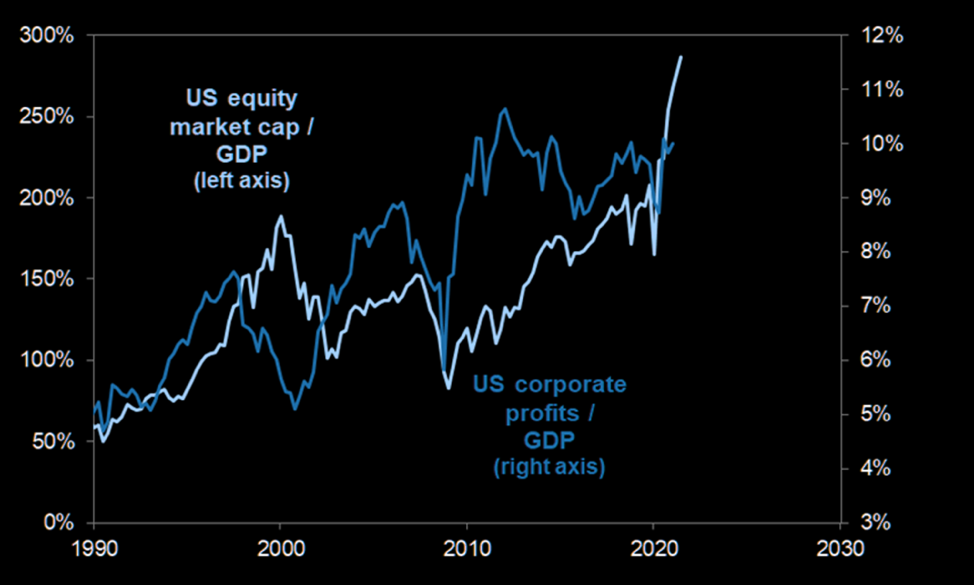
Valuations Remain High, and That’s the Case Across Pretty Much All Assets*
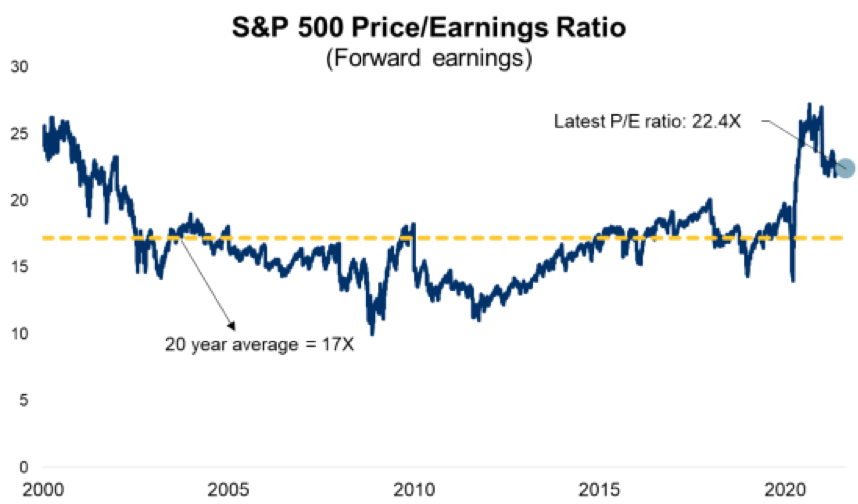
The massive recovery from the March 2020 lows has resulted in the S&P 500 trading at a forward price-to-earnings (P/E) ratio of 22x – this means investors will pay $22 for each dollar of earnings S&P 500 companies are expected to generate in the next 12 months. The 20-year average of this figure is 17x, so we’re at a solid premium today.
Here are the arguments supporting why this is the case, and may continue to be for some time yet:
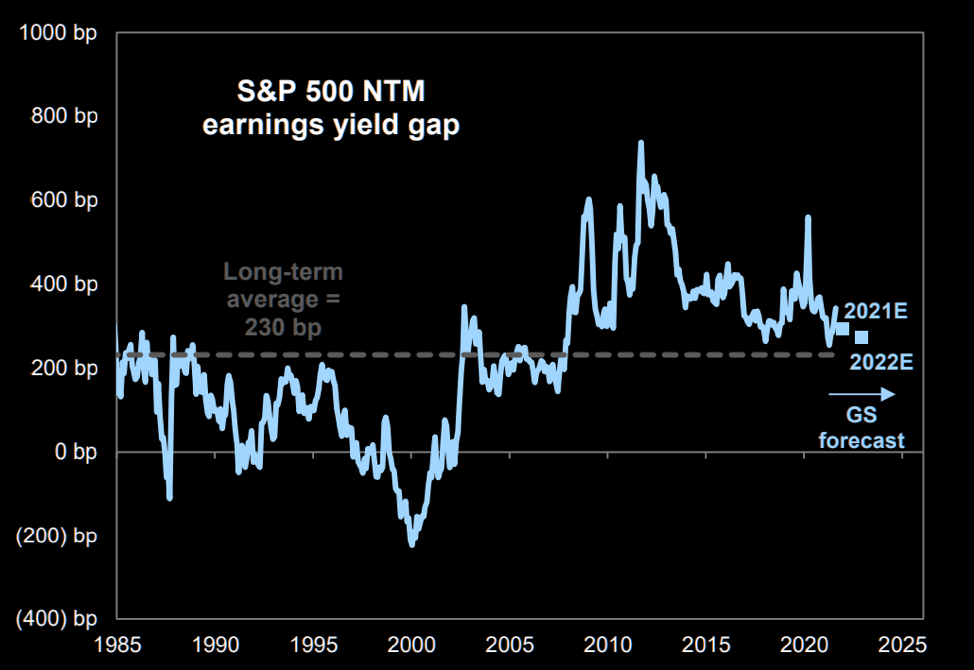
1. There is no alternative (TINA), driven by low interest rates: Given risk-free assets no longer offer investors with a compelling option, the alternative (e.g. stocks) start to look more attractive to long-term investors – driving up valuations. We are seeing this behaviour from large global institutions like pension funds who need an alternative to negative real yields on much of their portfolios (think bonds, etc). Relative valuation of equities is actually attractive vs. history – the S&P 500 earnings yield gap vs. 10-year Treasury yield is above average:
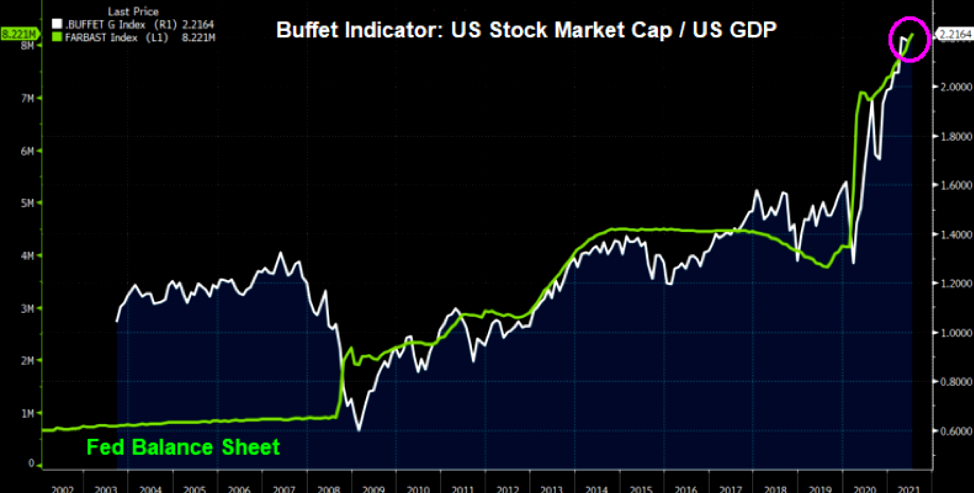
2. Central Banks continue to prime the pump:
3.The index has become heavy with growth stocks: The U.S. market has become tilted towards growth stocks in recent years as I’ve noted in past Partner Notes. The seven largest stocks in the S&P 500 are growth stocks (Amazon, Facebook, Apple, Google, etc), and comprise ~25% of the index weighting and therefore performance. These stocks don’t trade ‘cheap’ as you likely know…
4. There is becoming a dichotomy in valuations: Some sectors are quite ‘expensive’, while others are arguably ‘cheap’ by historical standards. Several sectors in the US, like financials, energy and materials, currently trade at valuations below their 20-year average. As I keep yelling from the rooftops, this is a market ripe for good active managers to add significant value moving forward.
5. Accounting standards throw off the valuation picture: Conventional accounting underestimates the earnings power of today’s companies because of “intangible assets” (e.g. research & development), which have become an increasingly important component in the valuation of companies. At the same time, conventional accounting practices call for all investments in intangible assets to be treated as expenses on the income statement - a different set of rules than what applies to investments in tangible assets (e.g. machinery). Therefore, companies investing heavily in R&D (something the market may reward with a higher stock price), will report lower earnings today.
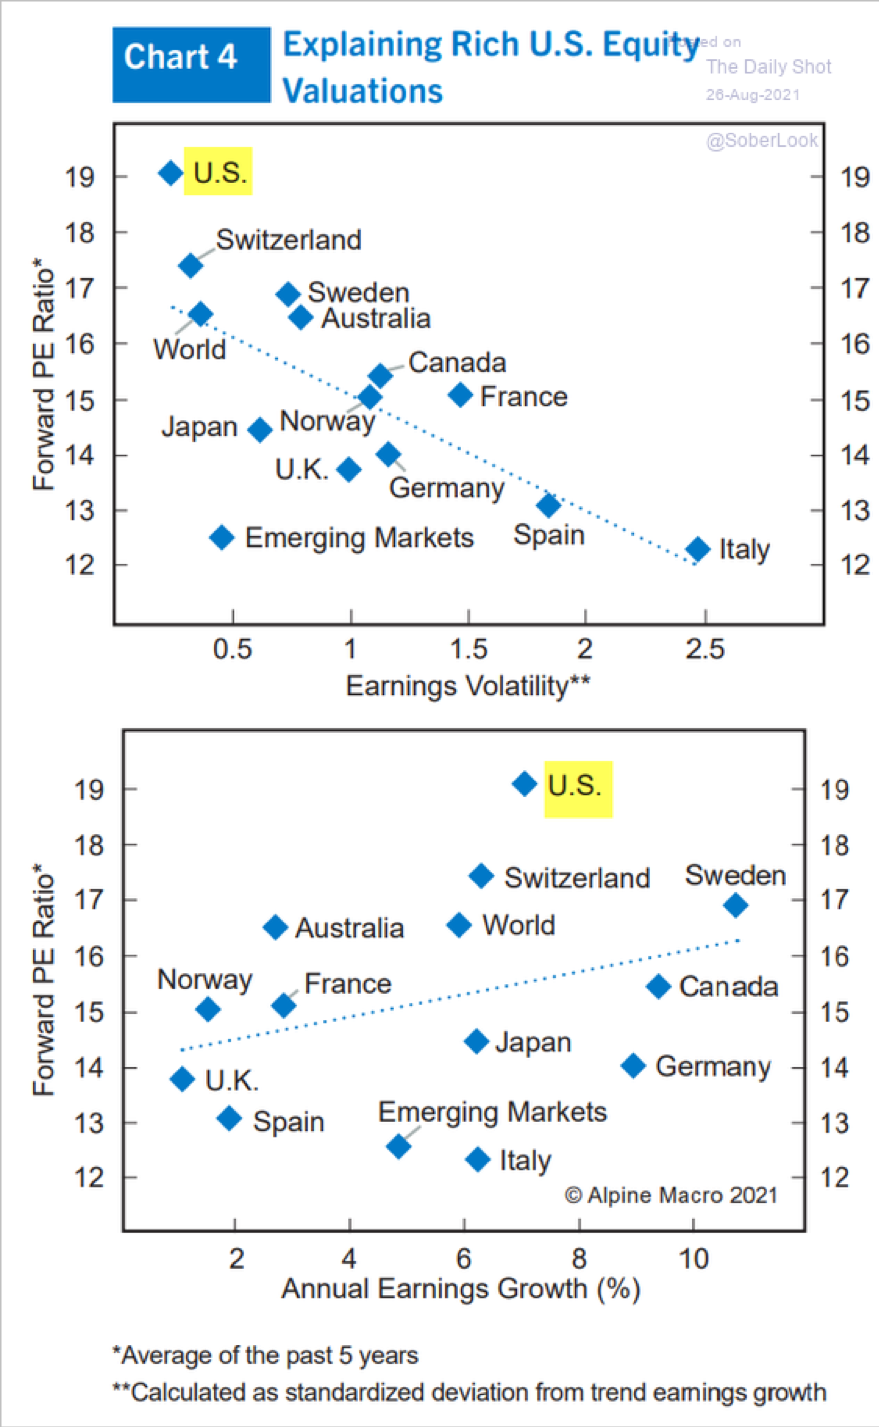
6. US stocks trade at a premium versus the rest of the world for the most part, but also have stronger and more stable earnings as a rule:
7. Companies are simply making a pile of money, and analyst estimates can barely keep up as they continue to raise their estimates:
In Canada, the second quarter marks the fifth consecutive period when TSX earnings have beat upwardly revised estimates by almost double-digit percentage levels. Furthermore, bottom-up 2021 earnings estimates have now been revised higher by a record 26% since the beginning of the year, the sharpest upward revision for annual EPS estimates in 20 years, and well ahead of the typical 7% downward revision exhibited over the first eight months of the year.
8. Companies are sitting on significant cash, and are buying back their stock with it: Free cash flow is high at companies, and they have been limited to how much stock they can buy back. Partly because of regulatory restrictions and partly for prudential reasons, even the most active buyback companies paid out less cash to shareholders than they generated up until recently. This led to deleveraging and rising cash stockpiles, so with all this cash just sitting there, management will be eager to boost share prices further via buybacks.
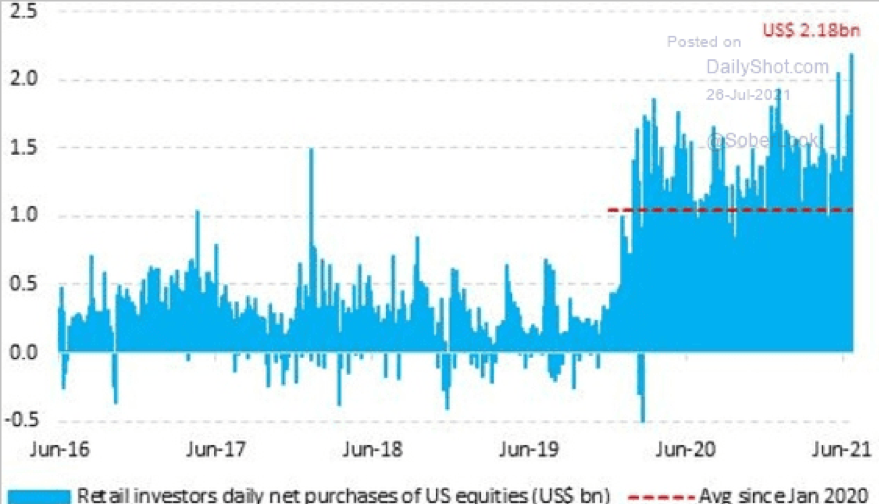
9. ‘Retail’ Traders continue to buy the dips, at least so far…
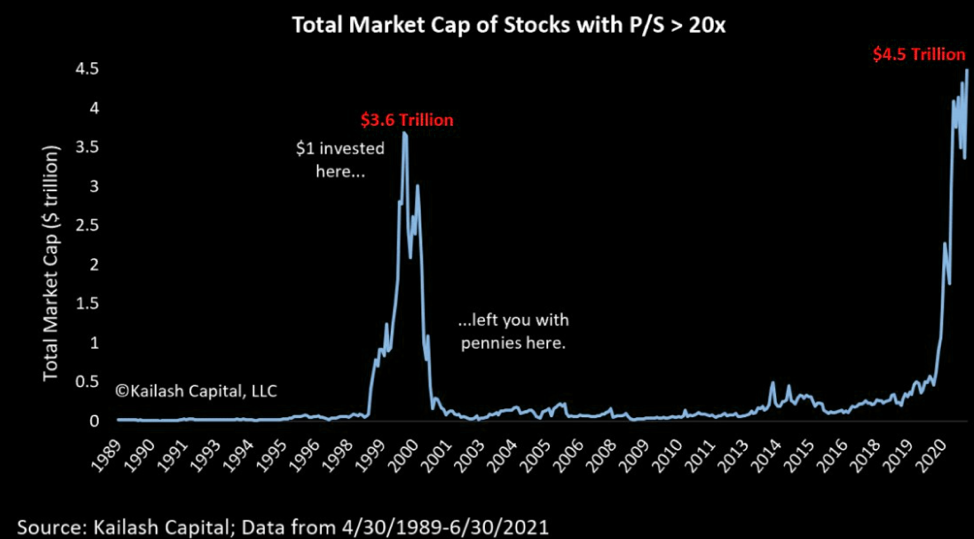
With Valuations Up Here, Are We In A Bubble? Is It Different This Time?*
This is a great perspective from the CEO of SUN Microsystems as he reflected on their 10x revenue valuation in the 99/00 bubble (meaning that they traded at 10x Price/Revenues): "At 10 times revenues, to give you a 10-year payback, I have to pay you 100% of revenues for 10 straight years in dividends. That assumes I can get that by my shareholders. That assumes I have zero cost of goods sold, which is very hard for a computer company. That assumes zero expenses, which is really hard with 39,000 employees. That assumes I pay no taxes, which is very hard. And that assumes you pay no taxes on your dividends, which is kind of illegal. And that assumes with zero R&D for the next 10 years, I can maintain the current revenue run rate. Now, having done that, would any of you like to buy my stock at $64? Do you realize how ridiculous those basic assumptions are? You don’t need any transparency. You don’t need any footnotes. What were you thinking?"
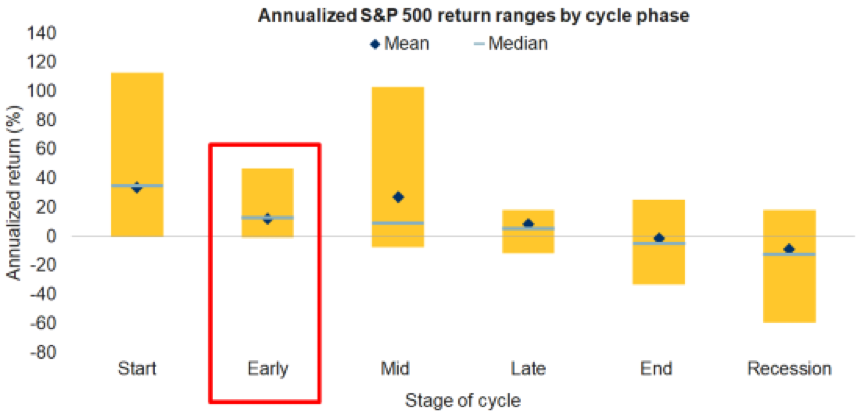
We Likely Remain in the Relatively Early Innings of the Business Cycle and Recovery*
The economy continues to improve, and we are still likely relatively early in the business cycle and recovery: In Canada, the recession is over. At their latest meeting on August 9, the C.D. Howe Institute Business Cycle Council declared that the recession caused by the coronavirus pandemic officially ended, but the economy is still on the path to recovery. According to the Financial Post, the council is tasked with establishing when the Canadian economy officially enters or exits a recession. In its latest release, it declared that the recession has ended, and that the economy has been recovering since reaching the trough in April of last year. Jeremy Kronick, one of the council’s co-chairs said, “It’s one of the most unique recessions on record in that it was the shortest recession on record but also the deepest since the Great Depression.”
RBC Global Asset Management notes that the economy is still at a relatively early point of the business cycle. In their view, “the takeaway is that this business cycle isn’t done yet. We certainly concede that it may be shorter than the average cycle to the extent that the recovery has occurred so quickly, but it will likely still be measured on the order of something like 5 years rather than the recent norm of ~10 years.”
Looking back over 70 years to gain an understanding of what markets do at different points in the business cycle, stocks have historically performed best throughout the beginning stages of economic cycles – which is where we are likely at now. This bodes well for future returns remaining positive:
Interestingly, Fundstrat has a very respected strategist who thinks that the S&P 500 could soar nearly 400% by 2038 as millennials drive the US economy to new heights. Demographics are destiny," according to Lee, who believes stock market returns will be strong for the next two decades as millennials drive the US economy to new heights.
Ultimately, Recessions Kill Bull Markets*
For some historical perspective, bear markets are caused by recessions. Of the five last major crashes, only the 1987 Crash was sparked by excessive valuation. In all cases except for the COVID Crash, the recessions were caused by the Fed tightening monetary policy.
At this point, there is no sight of a recession on the horizon, and Fed policy is accommodative and it is expected to be easy for some time (though tapering will start in the coming months, albeit slow and measured).
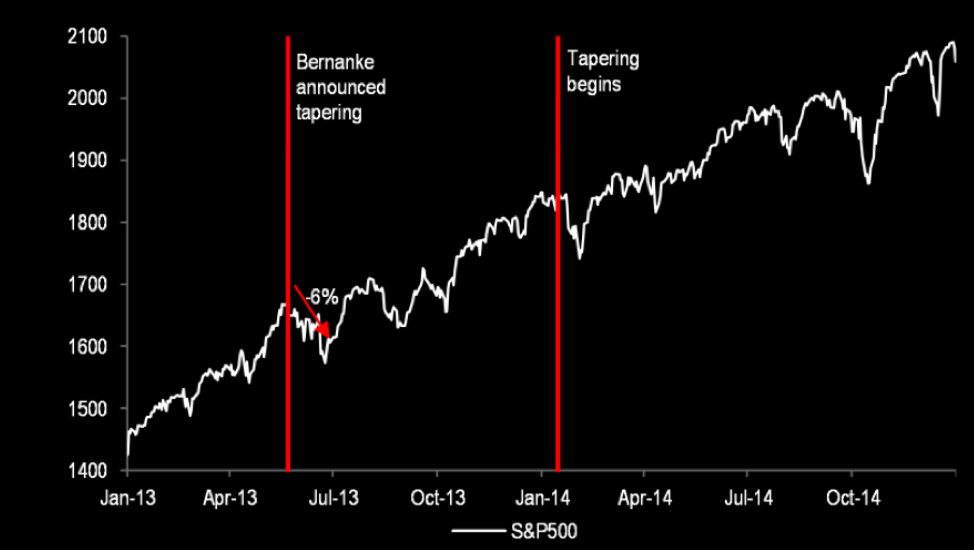
As central banks begin to take away the punch bowl and tighten (i.e. ‘taper’), many are worried that we will see a ‘taper tantrum’ and stocks will crater. But, recall that barring the initial wobble, stocks took the 2013-‘14 tapering in stride for the most part…
This Market Won’t Correct and Continues to Make New Highs – How Can I Possibly Invest Today?*
We’ve gone quite a while now without a material pullback. The doubling of the S&P in the last year is the fastest that the market has gone up twofold since World War II. Year to date, the S&P has closed at new all-time highs on 49 days, the most since 1995. The last time the S&P had a pullback of 5% or more was in October. Since 1929, the S&P has experienced nine-month streaks like this only 12 other times.
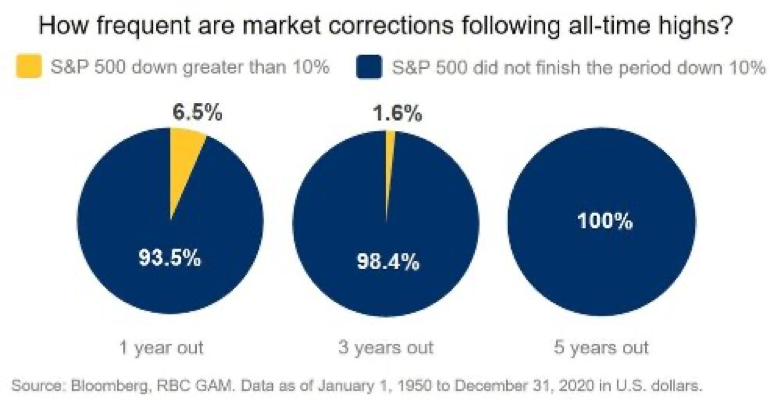
But, for long-term investors who are skeptical about investing in this environment, it may be helpful to show how rare market corrections from all-time highs are when we extend out the investment horizon. The charts below show how often the S&P 500 Index has finished down greater than 10% over various periods of time, following each of the 1,170+ all-time highs since 1950.
-
Looking out just one year from each all-time high in the S&P 500, market corrections greater than 10% have occurred only 6.5% of the time.
-
As we extend the time horizon, market corrections become even rarer. In fact, the S&P 500 has never been down by more than 10% at the end of a ten-year period following any of its all-time highs since 1950.
BOTTOM LINE: There remain major issues with the fiscal health of the U.S. that will need to be addressed in time, and there are near-term risks that must be monitored and volatility will continue to reign from various forces, including COVID variants, Washington budget battles, geopolitical risks and margin compression due to higher inflation. But for now, those are likely not going to ultimately overcome the substantially positive forces pushing stocks higher, and the main pillars of the rally that I’ve discussed for months (historic fiscal stimulus, Fed support, vaccine optimism and an overall strong economic recovery) remain in place, the path of least resistance for stocks likely remains higher for now. But we prepare our portfolios to be ready and resilient to the inevitable noise that markets and uncertainties will bring.