
The BEAR market is NOT over, the focus has shifted
Hope you have enjoyed what turned out to be a late-arriving, but beautiful summer.
This editorial in my view, is very important and is a little longer than the shorter summer notes published as of late.
The short posts will make a comeback after this one, since readers seemed to prefer them, but please read through and reach out with your questions, concerns and comments.
The Bottom Line:
It appears the next leg of the BEAR market in asset prices will shift from being a reaction to higher interest rates, to a rationalization of shrinking profits/earnings. Investor need to carefully consider their risk tolerances before attempting to navigate the coming 12 to 18 months.
“We’re building it up to break it back down
We’re building it up to burn it down
We can’t wait to burn it to the ground”
Burn it Down, Linkin Park, Chester Bennington
The Grind (Stocks):
Nick Drake, Bob Welch, Keith Emerson, Tommy Evans, Curt Cobain, Chris Cornell and Michael Hutchence…every generation tends to have a musician who took their own life that fans rally around as being prophetic.
Depending upon your age and taste in music, surely you could add to this list.
For me, the suicide of Chester Bennington—while a little out of my age demographic, I am a huge Linkin Park fan—hit me the hardest.
Chester was brilliant and creative.
He wrote songs about how he saw the world, and he saw much of the world far too clearly for his own good.
The US Federal Reserve has “built up” the greatest edifice of debt ever using their monetary policies, and are now in the process of “burning it back down,” by reversing these policies at a very fast rate.
They will “burn it to the ground,” if they are not careful.
This is where the hubris of the Federal Reserve exposes itself.
The Fed believes they can reverse the process of burning it down at their discretion and, because of this belief, are not too worried about short term asset price declines.
Nassim Nicholas Teleb speaks to the fallacy of such beliefs in his book, Antifragile. Note: this is not a recommended read unless you are strongly attracted to mathematics.
It has long been a fascinating study to watch how the prices of assets respond to the whims of the central banks.
If the economy gets a little sluggish, they just print money and lower interest rates to get it into gear.
If it truly was this simple, the world would not be at the place it finds itself today.
You see, there have been side effects, or maybe better said, collateral damage done by the central bank policies of never accepting a slowdown or recession.
An example of these side effects is how asset price growth rates have been far above economic growth rates.
Alice in Wonderland contains a segment where the Red Queen states:
“Now, here, you see, it takes all the running you can do, to keep in the same place. If you want to get somewhere else, you must run at least twice as fast as that.”
As asset prices ran higher the ability for incomes to keep up diminished, the Red Queen describes how younger people have felt since 2015.
The first chart below shows the inflation rate for FOOD, SHELTER and ENERGY.
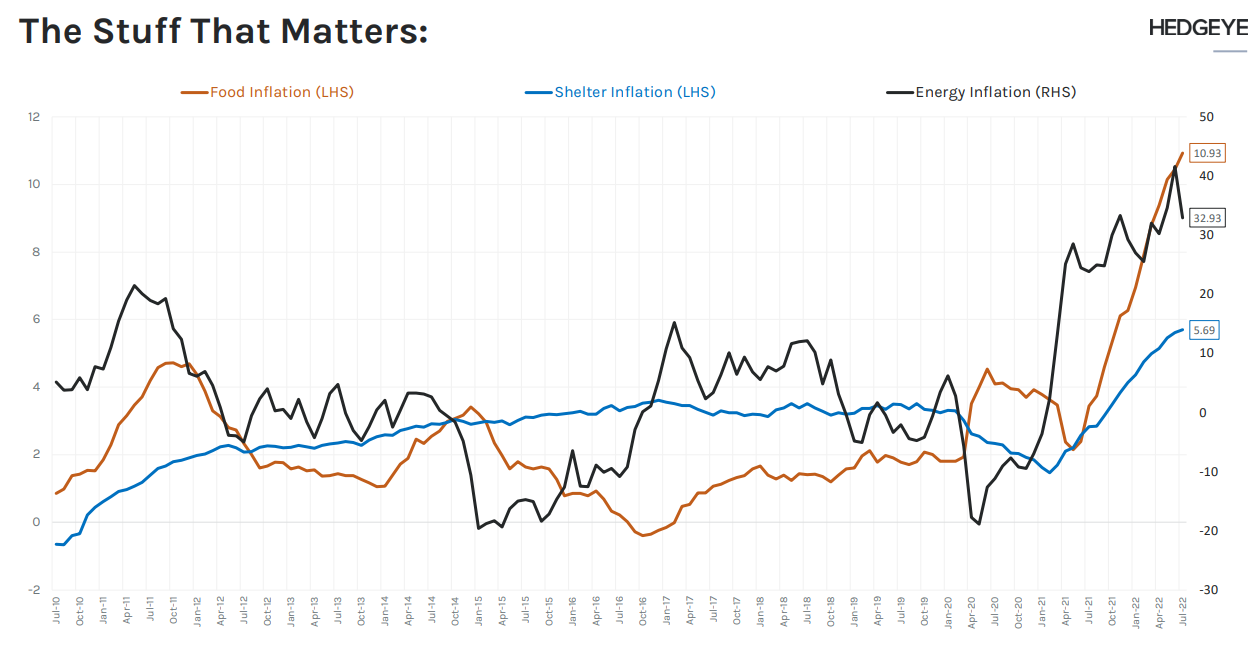
The next chart shows wage growth ADJUSTED for inflation.
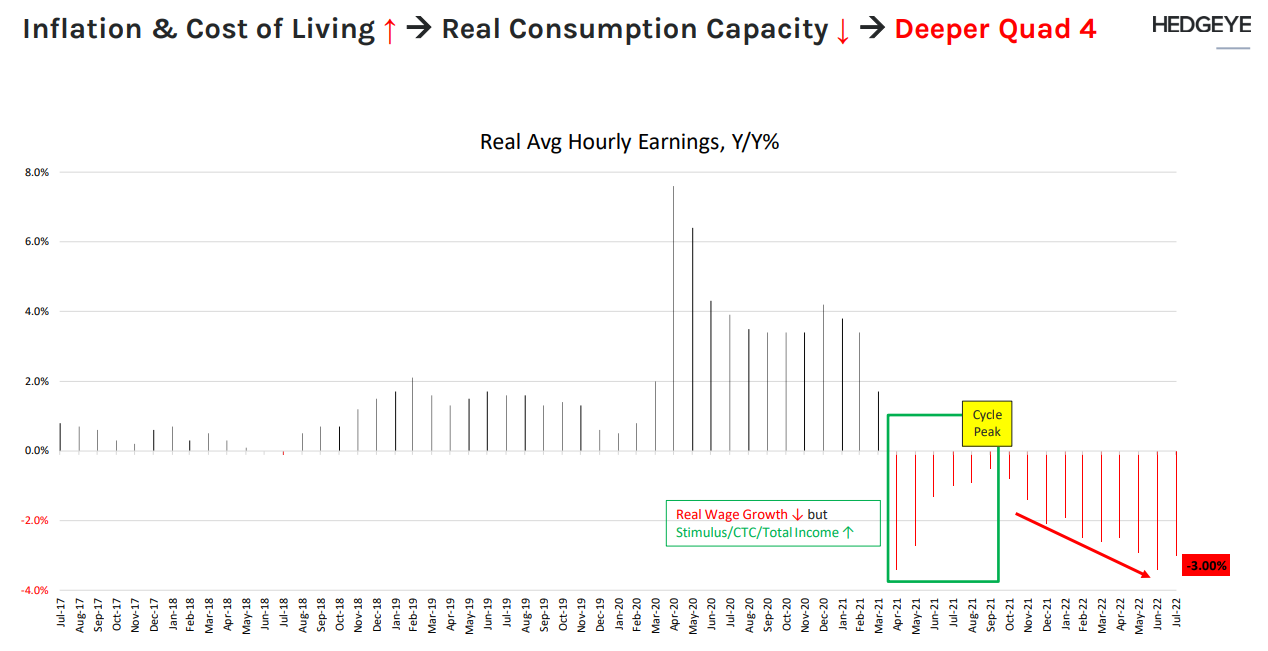
When adjusted for inflation, a 5% wage growth minus 8.5% inflation is equal to -3.5% REAL wage growth.
So what are we expecting in terms of the stock, bond and real estate markets in the next 12 months?
It appears that global asset prices are trying to find a new equilibrium relative to higher interest rates and Quantitative Tightening (QT).
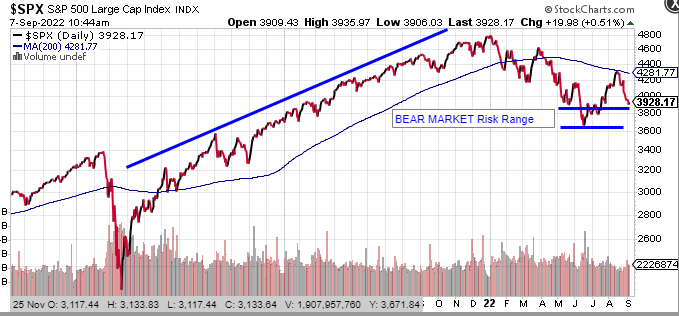
The stock market is squarely in the “chop bucket,” where it tends to trade erratically, in both directions.
Sometimes people like to say, that “the stock market has no memory from day-to-day” when it is choppy as illustrated in the S&P 500 chart above.
As long as the S&P500 remains in or above the BEAR Market Range mapped out at the bottom of the chart, my concerns about a deep decline are not roused.
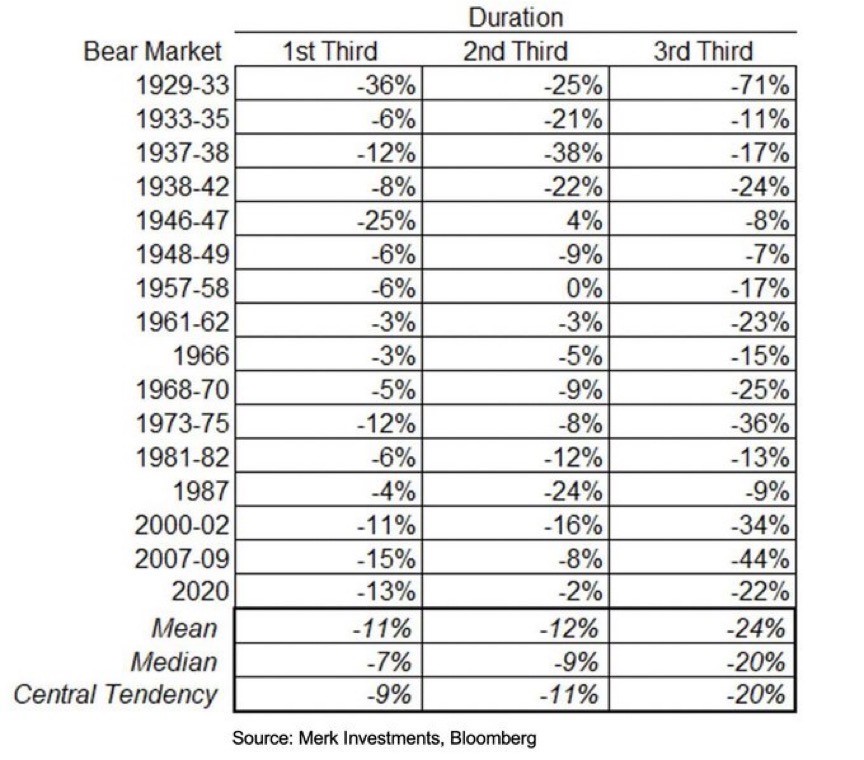
Please keep in mind however, that BEAR markets are back-end loaded.
This means the final leg down in a typical BEAR market is the most violent, as can be seen in the chart below.
For now, we will leave the stock market aside and jump over to look at interest rate markets.
Interest rates:
Interest rates are rising at record speed.
It takes time for higher interest rates to impact the economy, and economists estimate it can take up to 12 months for interest rate increases to filter through.
For sure, higher interest rates will slow economic growth, and this is especially true for a highly indebted country like Canada.
The first chart is a 12 year chart the Canadian 1 year Treasury bond.
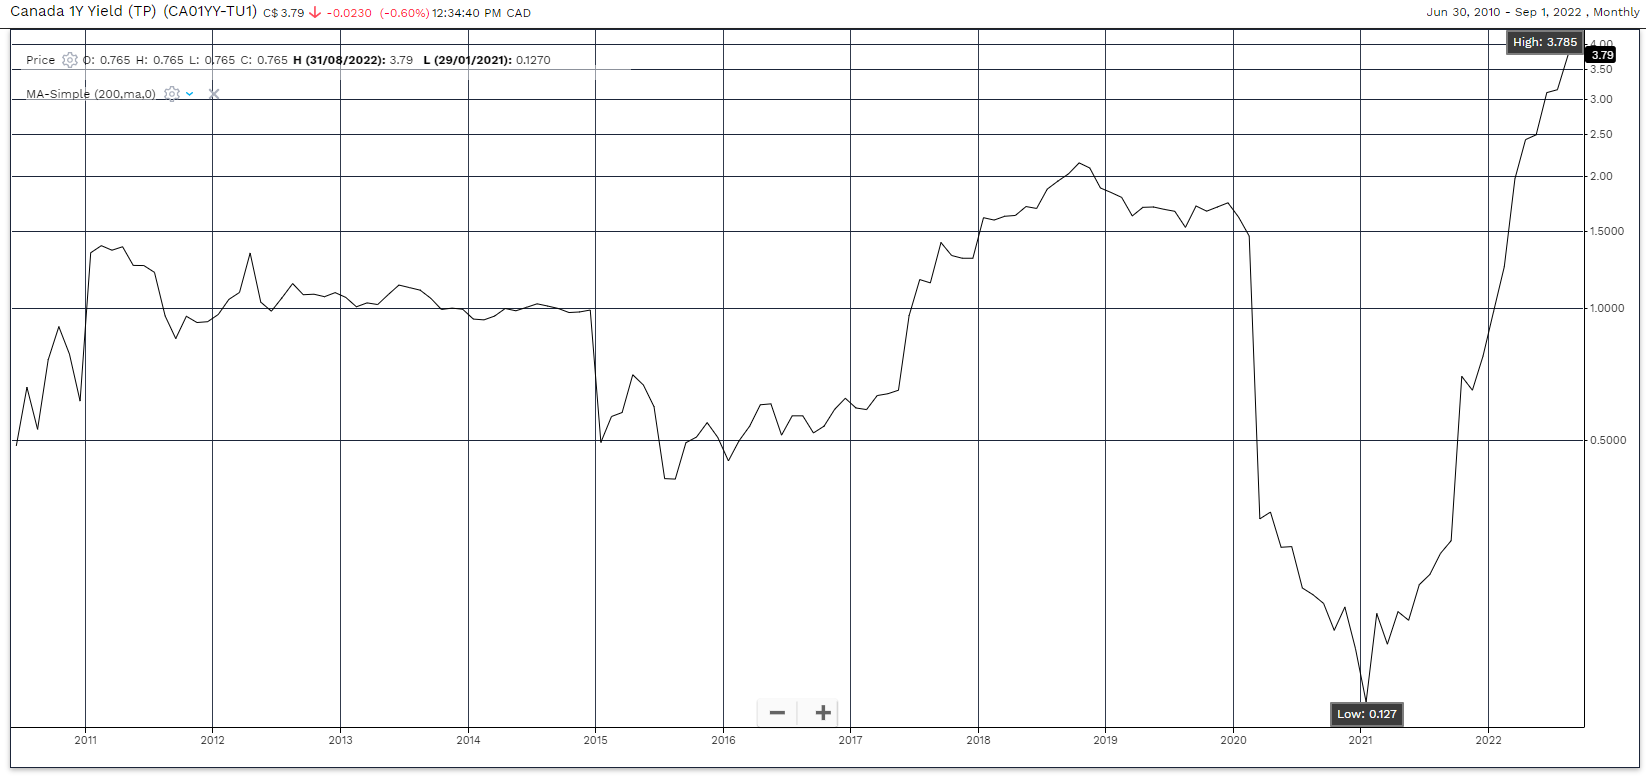
On Jan, 15, 2021, the yield on the one year bond was 0.127%. As of Sept. 1, 2022, the yield is 3.785%.
That is an incredible increase in interest rates!
Let’s consider what this means to people, companies and even our government.
People who were paying floating rates of debt have seen their interest rates more than double in the past year.
Companies that could borrow “nearly for free” are now paying 1000% more in interest.
And remember, the Government of Canada pays the interest on these bonds out of the tax revenue they collect.
Imagine the impact on the government budget when you consider the Canadian Government total bond issuance is now around $1.1 trillion.
The real key to focus on is the INVERSION of the Canadian yield curve.
An inversion refers to short term interest rates (1 year) being higher than longer term interest rates (10 year).
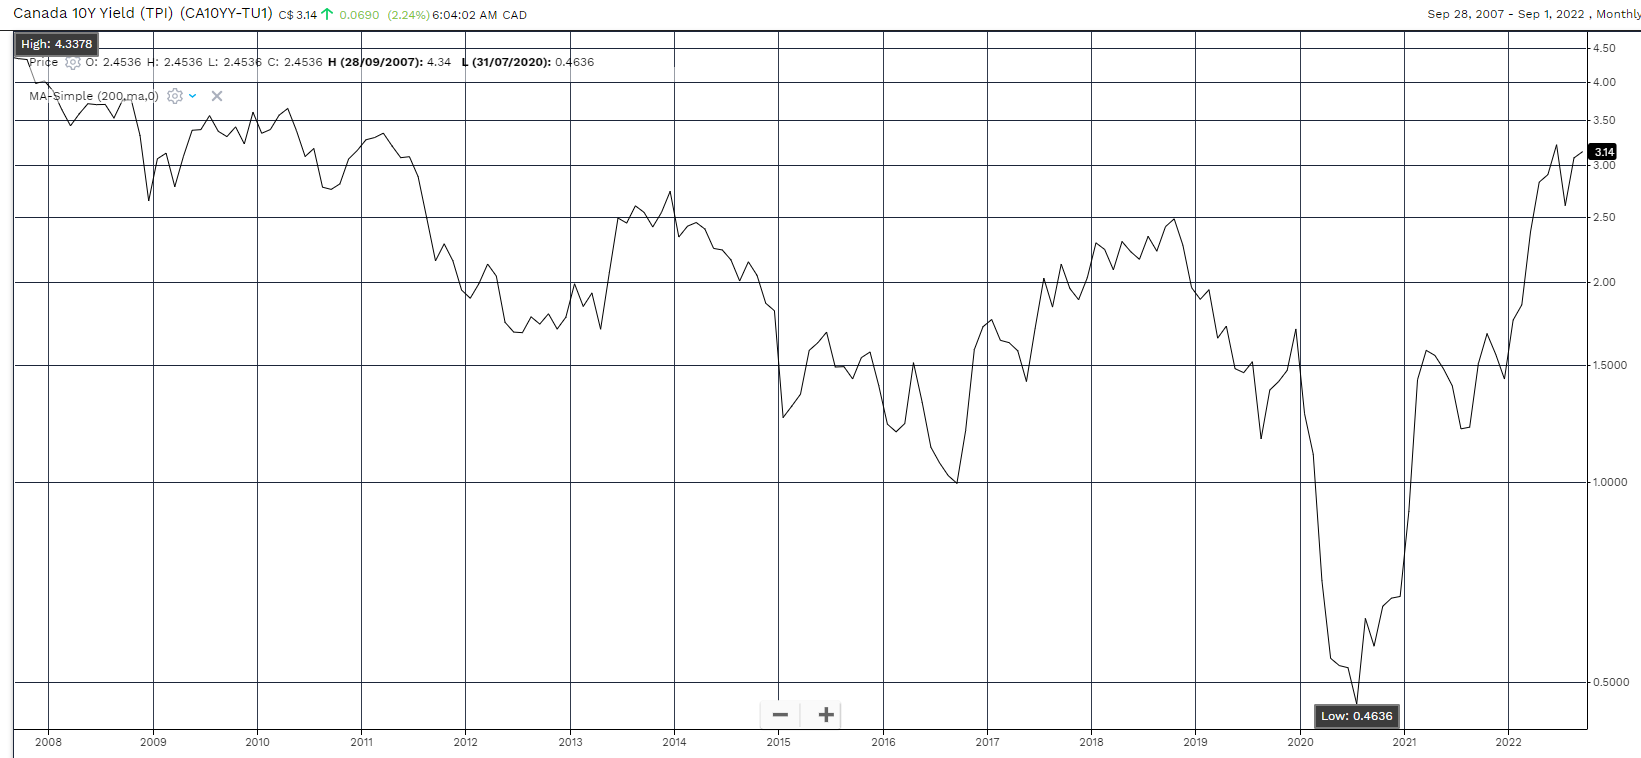
The chart above is the 15 year timeframe on the Canadian 10 year bond.
Not a new high, but a huge run up from the 2020 lows (0.46% up to the 3.14% level).
Now take the 3.78% yield on the 1 year bond. Subtract the 3.14% yield on the 10 year bond and you get 0.64%. This is the amount of yield curve inversion.
To keep it simple, yield curve inversion signals a high probability of recession in Canada.
Summary:
The BEAR market in stock prices has transitioned from a rise in interest rates BEAR market, to a drop in corporate earnings BEAR market.
As of the end of August, the expectation for S&P500 earnings were still up around the $240 level, only down from a peak of $255 in March 2022.
From the research I have done, it’s my opinion that the most realistic expectation is for S&P500 earnings to bottom around $185 by Q3-2023. At a 17 price over earnings multiple, that targets the S&P500 fair value at 3145. The index is now trading at about 4000.
The range of S&P500 earnings projections for 2023, was from $107 - $265, which leaves the $185 number used here around the “bearish” average.
Therefore, I am now going to SPECULATE on a base case scenario that might help us make better decisions about how to invest around the coming year.
What I am looking for is:
- The global central banks to stay more hawkish for longer than most investors expect. They completely understand how serious the inflation issue is and how it could completely derail both the economy and the Fed’s own relevance.
- By remaining hawkish I mean they will raise interest rates more than expected and be VERY slow to signal a reversal (pivot) in policy.
- Central banks continuing to raise interest rates in the face of slowing economic data MAY mean the stock and real estate markets overshoot on the downside in the SHORT term.
- That said, the pain of falling asset prices will prove too much for the central banks and they WILL GO BACK to their old bag of tricks. (Printing money and lowering interest rates again).
- At that time, asset prices will EXPLODE higher again.
- Inflation will become an even greater problem in the aftermath of these decisions but that is looking too far ahead. Our goal is to manage portfolios into the BEAR market bottom in 2023 and have the cash available to make purchases during the policy-pivot inspired rebound.
So investors need to make a decision.
Do you buy and hold through the decline in asset prices until the central banks decide to pivot back to their money printing ways?
Or do you sell more of your portfolio now and try to buy back at cheaper prices?
This is a conversation we should have very soon.
Now that you are back from summer vacation and ready to look at things again, the time to make this decision is ASAP.
Please email me to book an appointment to discuss your unique situation and concerns.
Sources for this editorial:
- Economic Cycles Research Institute, Lakshman Achuthan
- Hedgeye Research, Josh Steiner
- Credit Suisse, “War and Industrial Policy” – Zoltan Pozsar
- Jeremy Grantham – GMO LLC – Entering the Super Bubble Final Act
- @KittySuiddy Twitter space
- Bank of America: 60/40 portfolio
- Antifragile – Nassim Nicholas Taleb