
Are Interest Rates Going
To Continue to Rise?
Are interest rates going to continue to rise? This has been a popular question during my conversations the past few weeks.
Before we investigate it further I think it is important to understand that it is interesting to me that people are even asking the question.
Why?
Because a few months ago, few people believed interest rates would EVER go higher! The continuous refrain was “they” can’t do that. (They being the Fed and that being raise interest rates).
The fact that people are now asking the questions shows a shift in mindset in the human collective.
The chart below shows the Canadian 10 year bond yield in the past 3 years. It is easy to see the sharp move higher in yields as inflation rates shot up partially due to the supply chain issues and the Ukrainian War.

Back a few months ago we discussed the significance of the 1.94% yield on the 10 year bond and how the risk of a rapid increase in yield was high if that level was breached. That is pretty much what happened in real life…
So what about now? What does the same modeling tell us about 10 year interest rates going forward?
Actually, it forecasts a peak in the bond yield in and around the 3.25% - 3.50% range. Really Nick? Why?
This is where our discussion gets a little more interesting.
We touched on the statistic of 43% of Americans have less than $1000 in savings in the last report. (That is a Federal Reserve number. If you Google that statistic you will get statistics as high as 70%).
That segment of the population is much more exposed to inflation erosion in their budgets due to lack of savings and asset ownership.
Today we are going to apply the broader impact of inflation to what is known as the “misery index.” (If you don’t click the link to read the full definition it is a ratio using inflation and employment data).
It is interesting to see how, even though employment rates are healthy, the massive increase in inflation is enough to run the index up to 4 decade highs in the US.
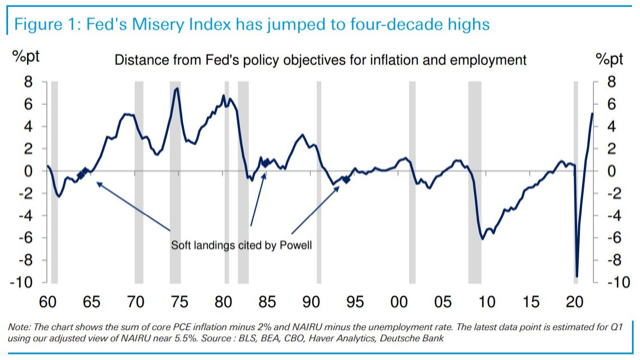
What the chart is telling us is that the central banks are likely going to overshoot on their interest rate increases to make sure they get a grip on inflation.
Higher interest rates are the only tool the central banks have in their tool box at this stage of the game.
In Canada, the only way the Bank of Canada will reign in inflation is to stop the rise in real estate. I don’t think I can be any blunter than that!
By stopping the rise in real estate, the central bank risks a decline in prices. Honestly, we just have to wait and see what that looks like in coming months.
Remember, this is not a Canada/US only phenomena we are talking about. These issues are global.
The latest update from Jeremy Grantham and the GMO team is included below. Even with the declines to date, the outlook has not improved much from earlier quarterly reports.

The chart above depicts the expected per year rate of return for the listed assets. Sobering expectations to say the least!
Hopefully your portfolio is at a stock market exposure level that you are very comfortable with. I have been trying to right-size client exposure for the past 90 days or so.
This down cycle in assets will end.
Good quality companies and assets should be held on too in the correct proportions to your personal risk tolerance.
My hope is that you feel your portfolio is in a good place at the present time. If you have any concerns please give me a call.
A Quick Technical Stock
Market Update
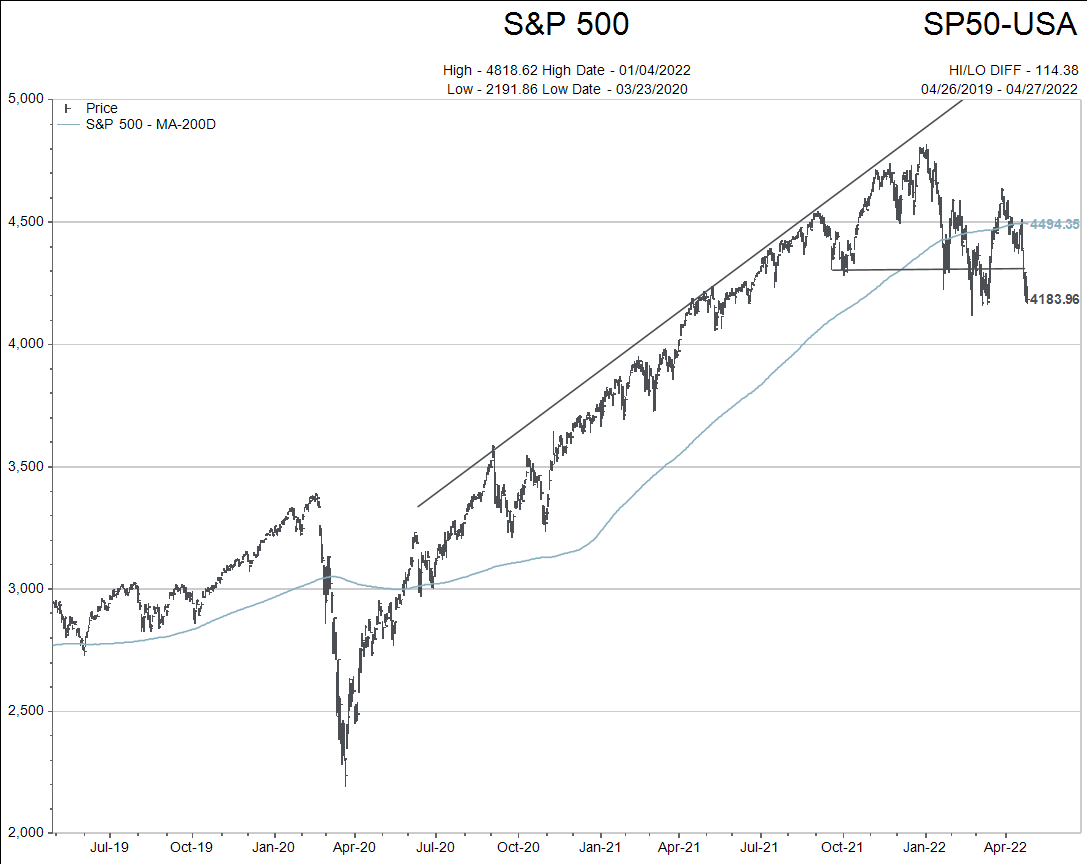
Stock markets are adjusting quickly to the changes in both inflation and future interest rate expectations. Below is a simple view of the US broad stock market and the Canadian stock market.
S&P 500 Index:
This chart has been a staple in my weekly comments for months now. The two lines drawn have not changed since the beginning of the year.
Note the index is now well below the steep upper BULL market top line and has now fallen below the horizontal “support line” too.
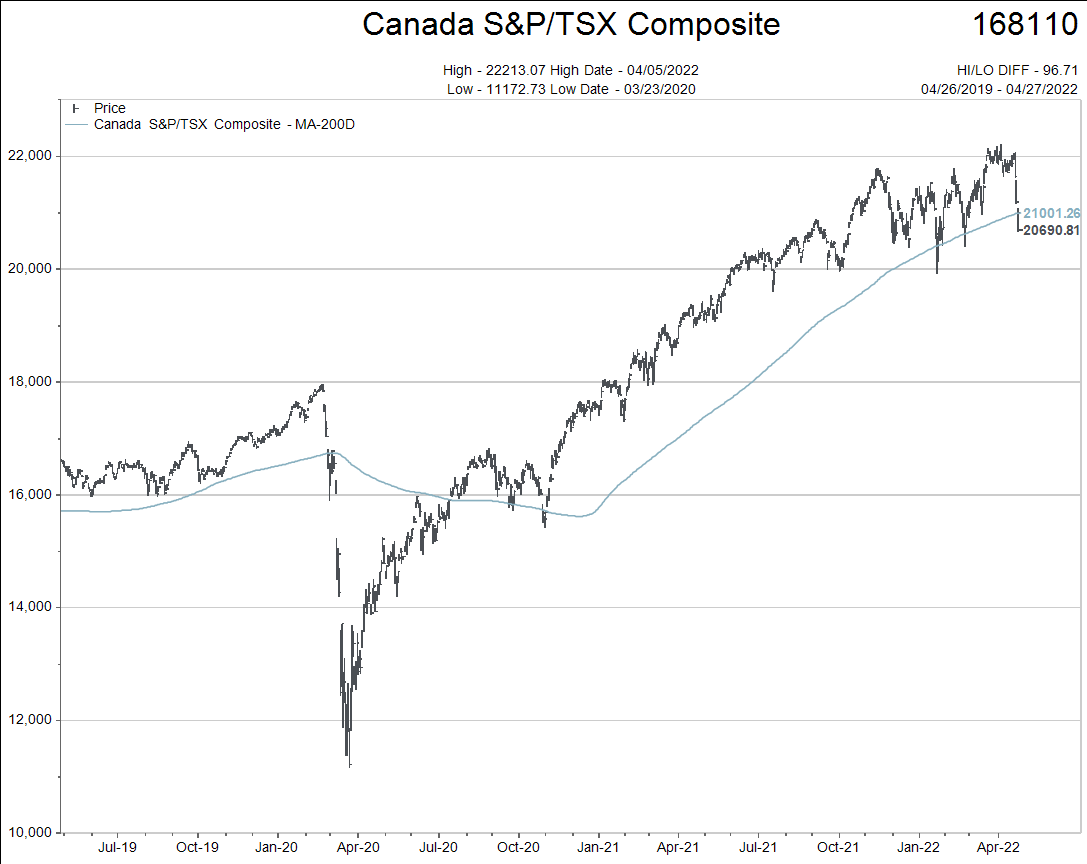
Canada’s TSX Comp Index:
The Canadian index is healthier looking but now trading below the 200 day moving average (blue) line. It has not traded below the 200 day moving average very much since April 2020. It is now…
Please call if you have any questions….