
Are You Worried about a Stock Market Correction?
The previous three comments focused on inflation data. Inflation is here and it is not going anywhere, anytime soon.
As pointed out in the last comment the narrative has shifted to try and tell you that “Inflation is good for you”:
Honestly, this is pure gaslighting…so sad.
The global central banks have not missed the reality of inflation and have curtailed their “sugar daddy” tendencies.
In the first quarter of 2021, 98 per cent of central banks were engaged in some level of quantitative easing. As of the third quarter, that number was 72 per cent, and will be even lower when the data is compiled again in early 2022.
Portfolio performance has not been exactly what the indexes have purported either.
Check out the graphic below courtesy of Liz Ann Sonders, Chief Investment Strategist at Charles Schwab.
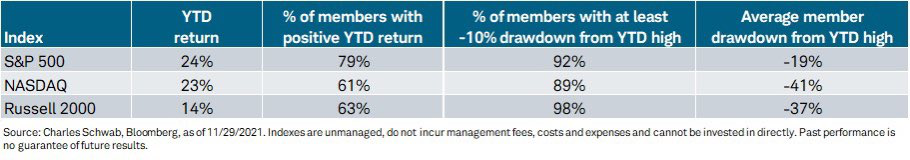
The chart above shows year-to-date (YTD) performance up until November 29th, of three US stock indices.
Those are pretty sweet numbers.
It then shows the performance on a “per company” basis.
Basically, the theme of the graphic is that the large cap companies are holding the performance of the indices together.
Another way to view the underlying weakness in the broad stock market is to see the number of 52 week lows as a percent of all stocks in the index.
Chris Carolan created the following graphic that helps us see what is going on with the new low acceleration. The big spike on the left hand side of the chart is March 2020.
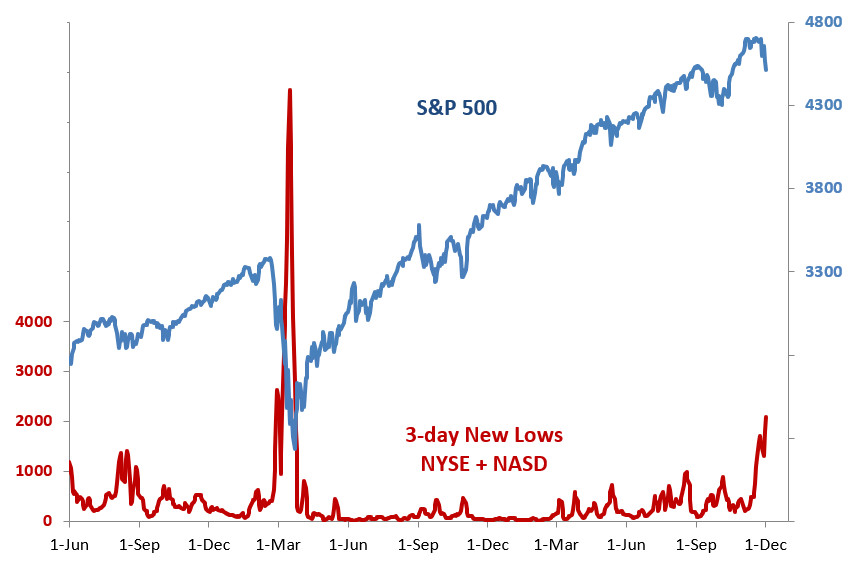
What we can conclude from these first two charts is that the stock market is feeling some indigestion. Nothing serious, but definitely a precursor that could lead to more serious market sickness.
So that’s what the charts say, but what do you think is driving the indigestion Nick?
My first thought is that I don’t believe the new virus variant, or anything to do with viruses, is moving the stock markets here.
The drivers seem more connected to interest rate expectations than to a slowing economy based on supply chain issues, which keep stoking inflation fears, or a significant decline in liquidity.
If one accepts the emboldened sentence above, then it makes sense to not panic about an immediate stock market correction, but to realize a lot of the ingredients that go into a correction are present.
The bottom line is we need more evidence that this is different than the other shallow dips we have seen since the summer of 2020.
Let me share two charts that make me cautious and treat the present stock market weakness with more care than most of the others in the past year and a half. Both charts are courtesy of John Hussman of the Hussman funds.
Chart 1 is simply showing the relative valuation of the stock market over a long period of history.
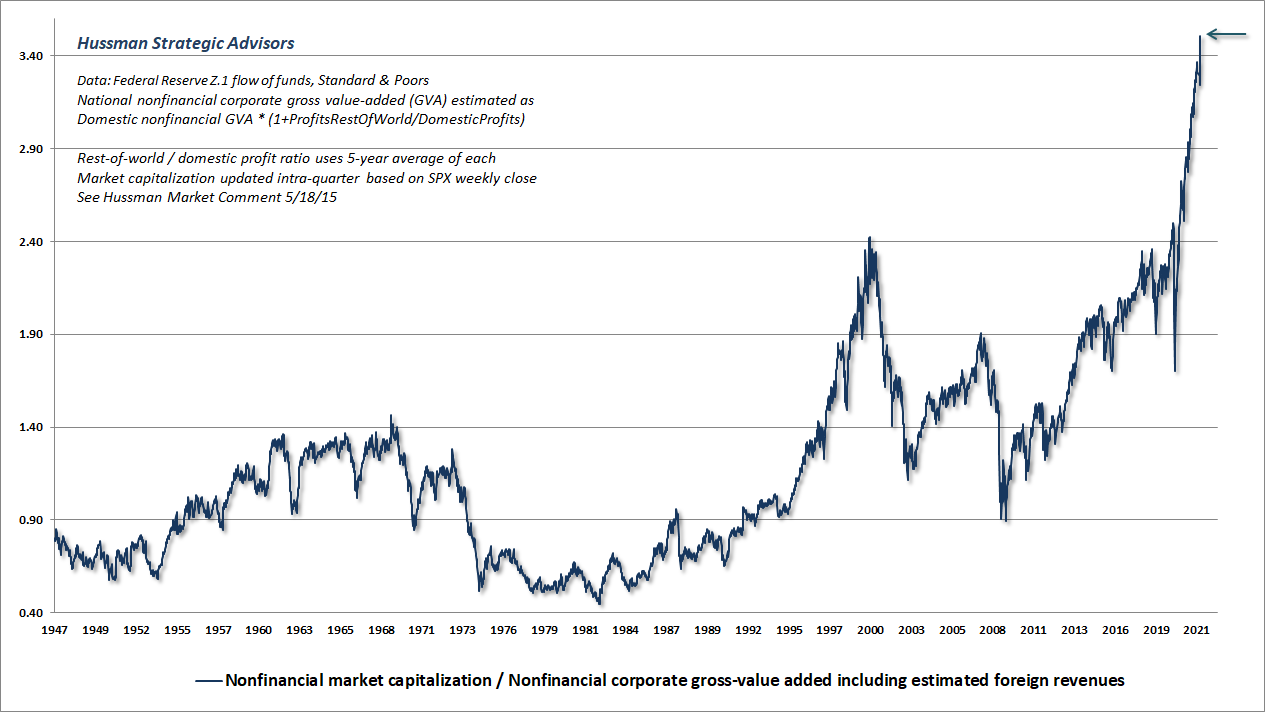
The second chart shows moments in time when high valuation and changing investor sentiment collide. The red dots mark moments where market liquidation was short term peaking, but mid-term just beginning.
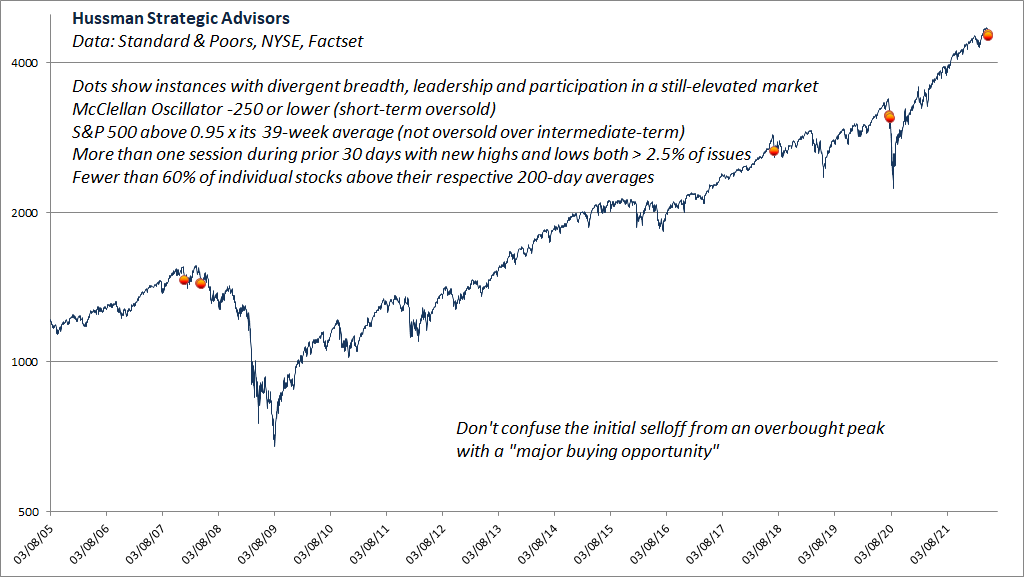
Note, this is the first “red dot” since before the March 2020 decline.
All this is saying to me is we as investors are wise to see what is happening to stock markets as a potentially directional change moment.
So the big question: What should you do?
The answer to that question depends upon how you plan to handle the full economic cycle for your investments.
Are you a “buy and hold” investor who harvests your dividends and doesn’t really care if your portfolio value goes down for some period of time?
Are you a person who hates to see declines in your portfolio and would rather take some money out of the stock markets to soften the potential impact of a possible decline?
One of the keys to answering these types of questions comes down to the timeframe you intend to hold your investments for and what other uses your money may have.
If you are likely going to continue saving for the next 10 years you can afford to be buy and hold. If you plan to buy a piece of real estate with your stock market investments if the prices of homes come down, you should be raising capital now based on the information above.
Houses and stocks often decline at the same time, especially if the reason that stocks might drop would be higher interest rates.
For those who care to try and time the stock market, below is an outline of “insurance strategy” you can employ on your portfolio.
Like any insurance policy, you are sacrificing a portion of your returns if the stock market continues to go higher in order to partially lock in some of your gains.
My proxy will be the broad US stock market as measured using the S&P500 index.
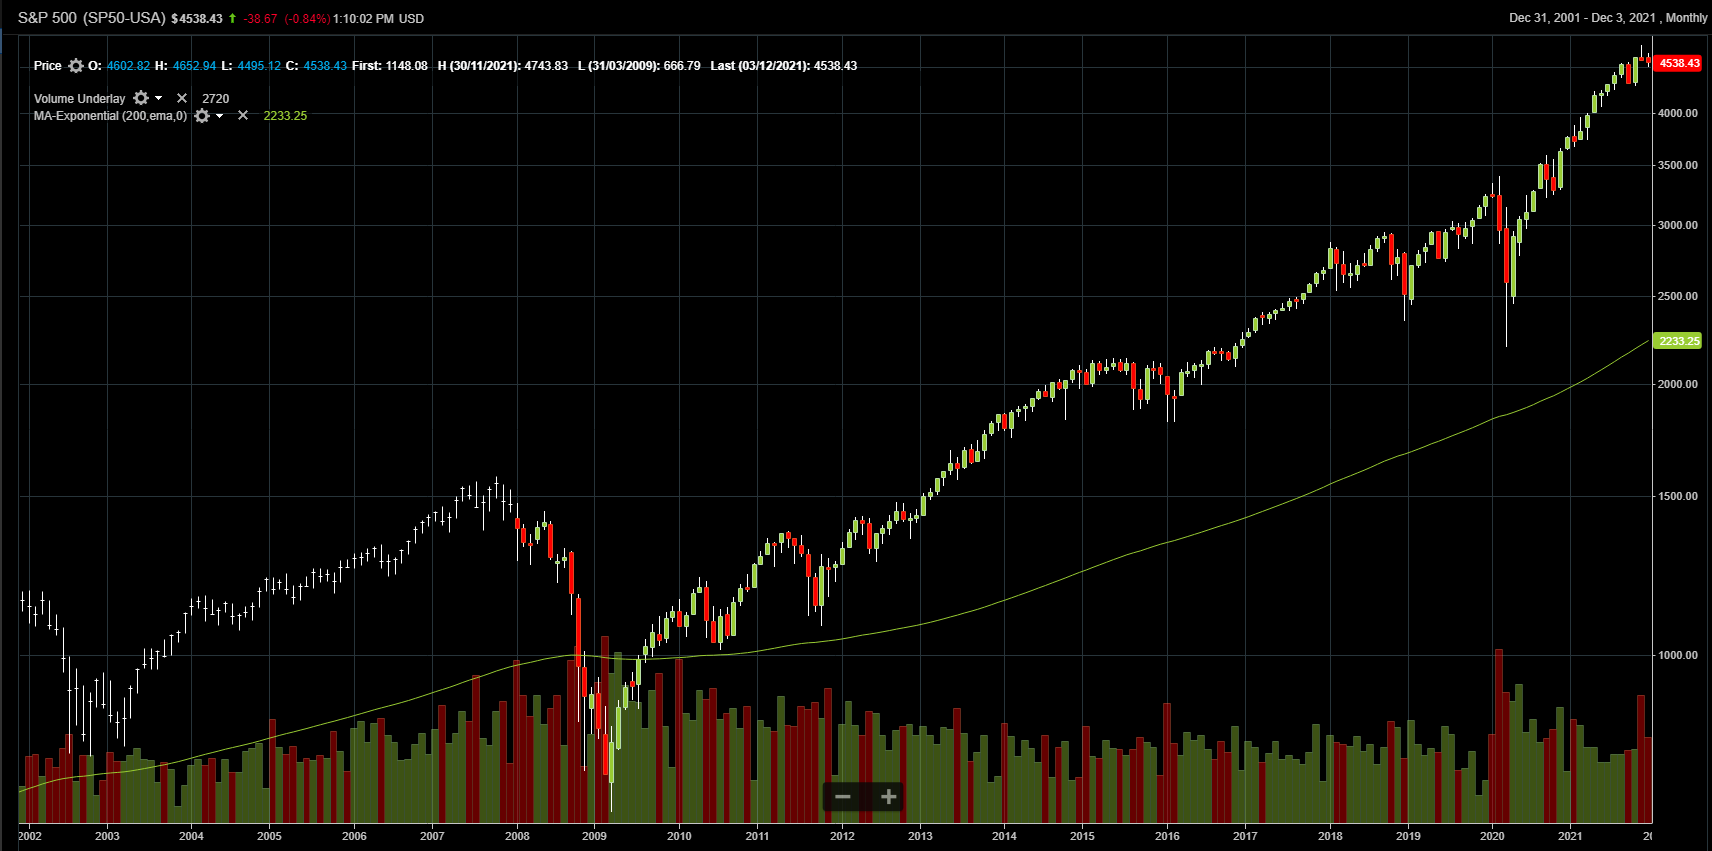
The log chart depicts the largest BULL market in history. There is also nothing technical showing it needs to end now either.
Incredibly, one can look at the February – June 2020 time period at which time pundits were begging to “close down stock markets until the virus is under control,” or worse, large investors like Bill Ackman telling us there is “hell to pay.”
All of that fear and fury doesn’t even look like a blip from the long term perspective, and this is exactly how long term, buy and hold, investors approach their portfolio valuations in the short term.
They know there will be periods of drawdown that will eventually bottom and re-establish into uptrends. The added advantage for this group of investors is they keep collecting their dividends even when stock prices are correcting!
Every investor should have a buy and hold component to their portfolio, which they call the CORE portion of their holdings. Traders do not need such a position.
From this point on I depart from most of my colleagues in investment philosophy.
I also believe EVERY investor should have a TACTICAL component to their portfolio. One that behaves in a manner aligned with trading, not buy and hold.
The following chart is directed to this part of a person’s portfolio (IF they choose to have a tactical component).
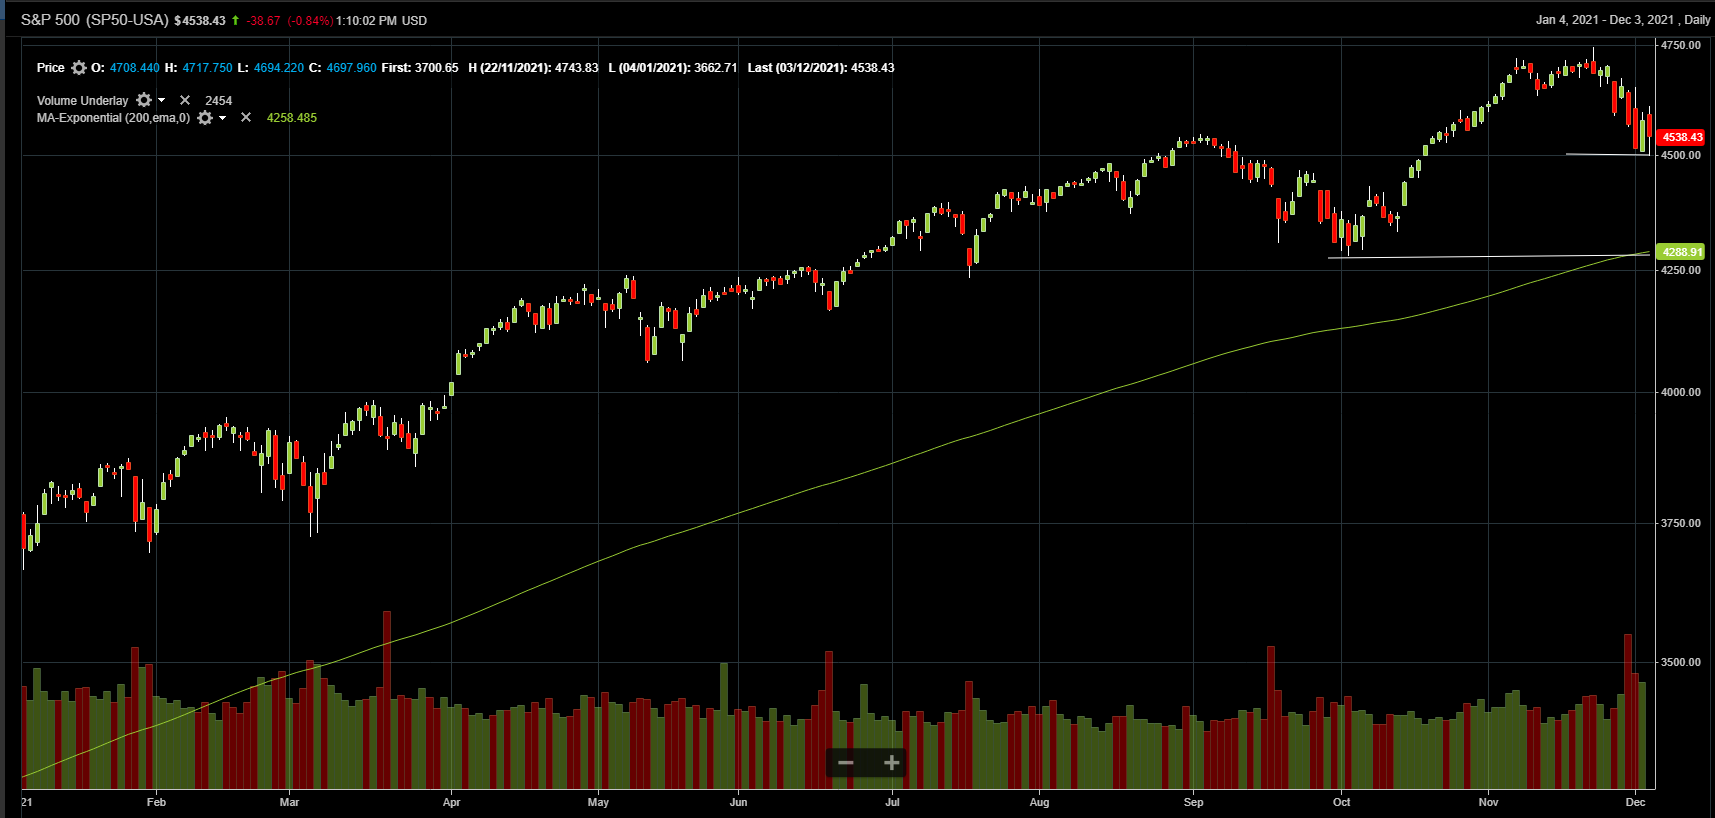
The chart above is YTD for the S&P500. I have drawn a short-term “cautionary” line at the 4500 level and a “tactical SELL signal” that is at the 4282 level. Note: the SELL signal conveniently coincides with the 4288 200-day moving average SELL signal that our tactical TEAM investments use.
Tactical investors would act to sell their tactical portion of their portfolio somewhere between the short term sell signal at 4500 and major sell signal at 4288. (I won’t speak to repurchase strategies here but a simple one is to use the 200 day moving average as a repurchase if the S&P500 recaptures this level after a failure).
Please remember, the CORE portfolio doesn’t change…only the TACTICAL.
The key is understanding which of your investments fit into which category!
That is likely enough for this special comment considering how to plan for a potential BEAR market.
As stated above, if you have questions please email back and I will call you. The past couple months have been busy with things picking up again last week.