
Triannual Report: 2021 #1
“Valuations, the Float, and Gamma Squeeze”
Executive Summary:
The first four months of 2021, were a continuation of the same themes that started the New Year in January.
Investor’s portfolios in higher quality shares continued along the path of solid growth. The banks, utilities and safer industrial names performed well, and Commodity related companies (forest companies, base metals and oil/gas) were on fire.
Technology names of higher quality had a good start to the year. The Facebook, Apple, Amazon, Netflix, Google and Microsoft (FAANG+M) were quite strong after teetering in late 2020.
On the downside, high risk names and Special Purpose Acquisition Companies (SPACs) were hit hard after insane runs to upside to end 2020, and bond positions have had one of the toughest starts to the year on record. An aggregate bond index lost 3.4% in the US and 3.8% in Canada.
How a portfolio performed had a lot to do with how much risk you were exposed to: The more high risk, the weaker your return to start the year.
The driving narrative for financial markets, so far in 2021, has been the ramp up of inflation being spurred on by the historic money printing campaigns of the central banks around the world.
As a result of these central bank efforts we find ourselves in a world where valuations are stretched in all asset classes.
Before we move on, a quick note on real estate valuations needs to be included here in the summary.
Real estate may be even more stretched than the stock market in valuation, and that takes some doing in today’s world!
The body of this note is going to support the idea that valuations are at extreme levels, but the factors that keep stretching valuations are showing no signs of slowing. Investors are faced with few easy choices when having to deploy fresh capital to the markets.
How We Got Here:
The following summary has been included in these triannual outlooks since 2016:
- “Great Mistake” – Central banks letting Quantitative Easing (QE) run for more than a year back in 2010.
- Ten Years Later – The slow pace of raising interest rates continued. Central banks never took back the “great mistake” for fear of stalling asset price increases, but in the final quarter of 2018 stocks declined anyway: real estate stalled too.
- The Panic of 2019 – No it wasn’t investors that panicked…it was the central banks. The Bank of Japan, European Central Bank, and the US Federal Reserve all pivoted from tightening monetary conditions back to loosening them.
- “Hotel California Economy” – The pathways to interest rate normalization are nowhere to be seen. In 2019, investors around the world scrambled to try and lock in yield on investments. As the old Eagles song hauntingly informed us…You can check out anytime you like, but you can never leave. The highly indebted, low interest rate world was baptized into permanence.
- Asset inflation without growth – Resistance is futile, looking into 2020, lower asset prices are not considered an acceptable outcome. Any and all means necessary to inflate asset prices will be employed. If that means printing hundreds of billions of dollars every month to create liquidity…so be it.
- “Bonfire of the Vanities” – the hundreds of billions of dollars printed in the pre-pandemic world became trillions after March 2020. No amount of monetary stimulus is viewed as too much. There are no goal posts measuring whether more is necessary in terms of amounts or results. “More stimulus is necessary” exists as its own reality now.
- But will interest rates co-operate and stay low? Will the inflation wave that is expanding its borders to more and more asset classes keep investors in the frame of mind to hold on to their bond positions? If not, who buys all the bonds and where does the money come from to make the purchases?
The first four months of 2021, offered a good start answering the question of will interest rates stay low and who will buy the bonds?
The answers are that interest rates will not stay low easily and the buyer of last resort has not changed…central banks will keep printing and buying bonds to soak up excess supply.
A new theme has emerged in the investment landscape in the first trimester of 2021: Higher taxes. Investors will need to watch how this one develops in coming years.
The Big Picture:
Valuation is the upside-down version of expected forward returns. Stated simply, the higher price paid for something, the lower the expected forward return relative to historical valuations.
Jeromy Grantham, at GMO Investing, has famously created the following chart reflecting valuations of a broad range of asset classes. He uses 7-year expected rates of return, instead of valuation to offer investors a different perspective of the future.
The March 31, 2021, edition of GMO’s rate of return matrix is sobering. Almost all asset classes have an expected negative rate of return going forward for the next seven years.
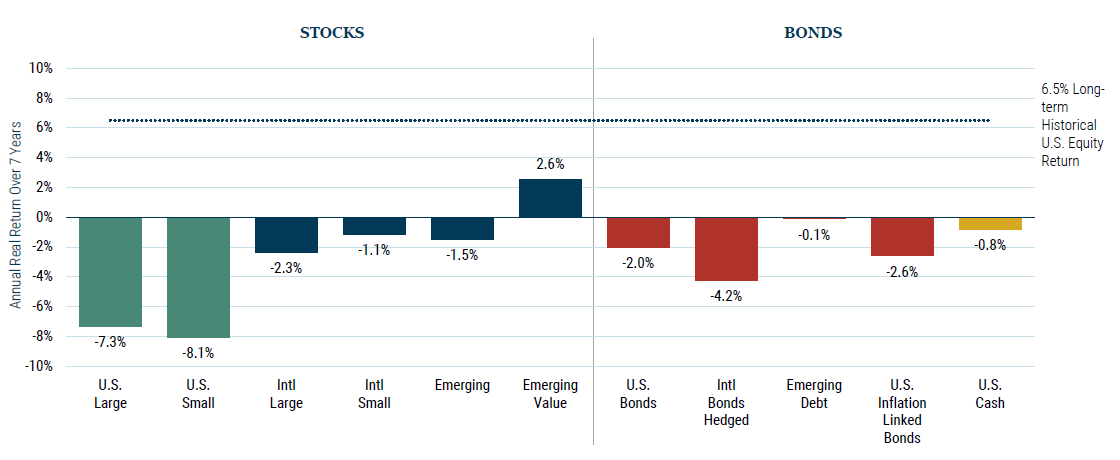
Missing from this matrix is real estate.
I’m afraid I don’t have access to anything that would be considered similar to real estate forward return expectations but I think most of us understand that real estate prices are pretty darn high at this point in time.
Please take another look at the GMO expectations.
Now, let me pose a question to you: If you were a fundamental investor from 1971, who was magically transported 50 years ahead in time to 2021, what do you think you would do seeing the above market return expectations?
My guess is that you would have a very busy day calling your brokers and real estate agents trying to sell as much of your net worth to cash as fast as possible, given the ability to realize a high present prices and seeing the poor future return prospects.
You would draw this conclusion because you would still be thinking about asset prices in terms of an era where normal buyers and sellers come together to establish market prices, but you would be missing the key ingredients to the present day valuations!
Normal buyers and sellers are not the primary determinants of price any longer.
The convoluted chain of circumstances required to arrive at the investment outcomes summarized in the GMO chart above begins with Central bank policies back-stopping the process. This has been the case for so long we almost forget there was a time when it was not true. [i]
Just as with the nature’s balance, if one manipulates a single variable at the bottom of the financial market’s fundamental food chain, then more and more distortions occur as one views further up the chain.
By distorting interest rates lower, and creating copious amounts of liquidity, the central banks have not only influenced asset prices but they have also indemnified investors from longer duration BEAR markets.
The moral hazard of a fearless investor class results in an overconfidence in passive investing.
Passive investing refers to buying a diversified portfolio of companies or index, and holding no matter what the world throws you way. Each time a financial crisis is averted by more central bank monetary stimulation investors learn that selling is a sucker’s game and that waiting to be bailed out by the central banks is the winning strategy.
Here are two links to articles on the distortions caused by present day passive investing. One from Forbes Magazine and one from the Federal Reserve themselves. If you want a better understanding of how disruptive passive investing is, and you have the time, please check out these two articles.
After nearly two decades of growth in passive investing, markets are now sorting out the third phase of the fallout from central bank financial food chain disruption. This is represented by the reduced float of available shares to be traded and the gamma squeeze.
Let’s break both of these down individually, and then pull all of these issues together in a summary.
The reduced availability of shares, or float, is a direct byproduct of passive investing. The more shares of a company owned by insiders, passive mutual funds or exchange traded funds (ETFs), the less availability of shares to be actively bought or sold on any given day.
Take Apple (AAPL) as our first example.
The float is commonly quoted at 99.9% of the company, but this figure is completely misleading.
To start with, the passive ownership of Apple by funds and ETFs is 59.5%. That doesn’t include all the shares that are simply held long term in non-reporting funds, trusts and average investor accounts. Realistically, about 88% of Apple shares are held in portfolios with little or zero turnover.
To put that into historical perspective, that percentage is about 25% higher than 20 years ago.
Honestly, this is not a big problem when we consider a company like Apple. A 12% float with virtually no short position held against it is not going to cause any great problems for the stock market.
So let’s take a smaller company example and do the same analysis to show where the trouble begins.
My example is a Russell 2000 based company called SunPower Corporation (SPWR).
*** PLEASE note that SPWR is being used here as an example for share float and investor dispersion only, and the following is not to be construed as a recommendation to buy ***
Institutional ownership is 48%, and insiders own 55% of SunPower Corporation.
Okay, see where this problem is starting to rear its head?
These two groups own 103% of the shares outstanding...so where is the float?
It gets even more messed up.
The short interest in SunPower is 22% of the float. This is another surge of buying that eventually will impact the share price.
Let’s be clear on how these variables come together in the case of SunPower shares.
Institutions, mutual funds, exchange traded funds and insiders own a total of 103% of the outstanding shares. All of these holders are considered long-term and not part of the float by 2021 definitions. On top of that, you have 22% of the shares held short, meaning they have to buy back the shares at some point in the future to close out their short position.
With the above conditions in place, now imagine a news announcement that SunPower has done something wonderful. This announcement creates a lopsided surge in buy orders relative to sell orders.
Do you think it would take much new buying demand to force the price of SunPower shares significantly higher? I think not.
At least 100 examples of companies displaying the very same dynamics at the present time come to mind; these are the same dynamics that created the whole GameStop fiasco.
The final piece of the broken market puzzle to be looked at in this publication is the gamma squeeze.
In simplest terms, the gamma squeeze is what happens when there is an over-abundance of call options outstanding verses put options, coupled with a rising stock price. As the price of the underlying shares rise, the option market-maker must delta hedge the risk of their outstanding options book relative to net exposure (Put/Call ratio). This is done by going out and buying stock in the open market, which further drives up the price of the shares, which creates an even worse gamma squeeze….hmmm, see where this is going?
Now add to the situation a pile of momentum based traders jumping on the SunPower bandwagon because they see the price of the shares rising. It is not difficult to see why traditional valuations mean nothing to stock prices at the present time and may not for the foreseeable future.
Summary of the Big Picture:
Traditional measures of value yield little insight to investment opportunities in 2021.
The GMO graphic makes that point clear: Nobody cares that expected rates of return are negative as long as asset prices keep rising.
The unfortunate reality for investors, is that the set of dynamics that leads to greater distortions in the price of everything is still in full force and show no signs of abating.
Therefore, the value-minded investor is relegated to holding their nose and buying assets at poorly valued levels in terms of long term return expectations.
One could not arrive at the Everything Bubble state of asset prices without (a) the continuation of central bank policies of supporting asset prices for a long period of time, (b) the confidence that the copious amounts of liquidity being poured into financial markets have no limits, and (c) that debt no longer matters and can grow to infinity if necessary.
If you remember back in the 1990s, when the amounts of debt did matter and governments talked about “balancing budgets again someday,” it was not possible to create the Everything Bubble conditions. It took time to change the narrative to debt doesn’t matter anymore.
It is also going to take time to change it again to something else.
History teaches us that the beginning of that change will likely begin with some kind of catalyst that is not present today. I doubt the catalyst will be implemented by central banks. As a matter of fact, it will likely look more like something takes the printing presses away from the central banks and doesn’t allow them to print more money.
For the purposes of this report, fear of the central banks losing their influence is not a worthy concern at the present time, but it is important for investors to understand the leveraged structure of the asset markets.
Stocks, bonds and real estate are all distorted in valuation by overly stimulated financial conditions.
I know, I know, everybody is going to be able to sell at the top and nobody will get hurt by all of this…right?
Wrong…
For every seller there must be a buyer. Every share, bond or home has to be held by somebody at any given moment. Therefore, it is impossible for “everybody” to get out. When the narrative changes someone has to be left holding the bag.
When will getting out matter? I have no idea.
Investors in the 2021 financial markets are not really thinking about that problem yet. The party still rages on and who wants to be first to leave when the fun is still going on?
Commodity Charts and a Few More
To close, here are a few interesting charts to check out.
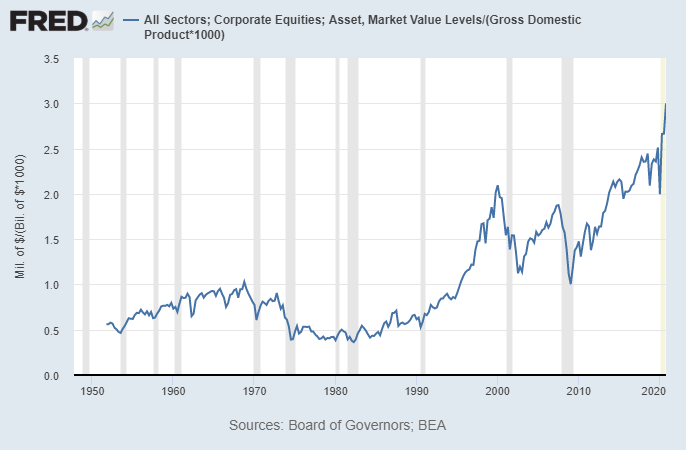
The first chart is a summary statement for the body of this Triannual Report. It looks at the value of assets over Gross Domestic Product (GDP) for the past 60 years. The aggregate value of all assets is now priced at 3x GDP.
The next series of charts are of commodity prices; the first three are the bedrock of industrial economy and the next charts are food related.
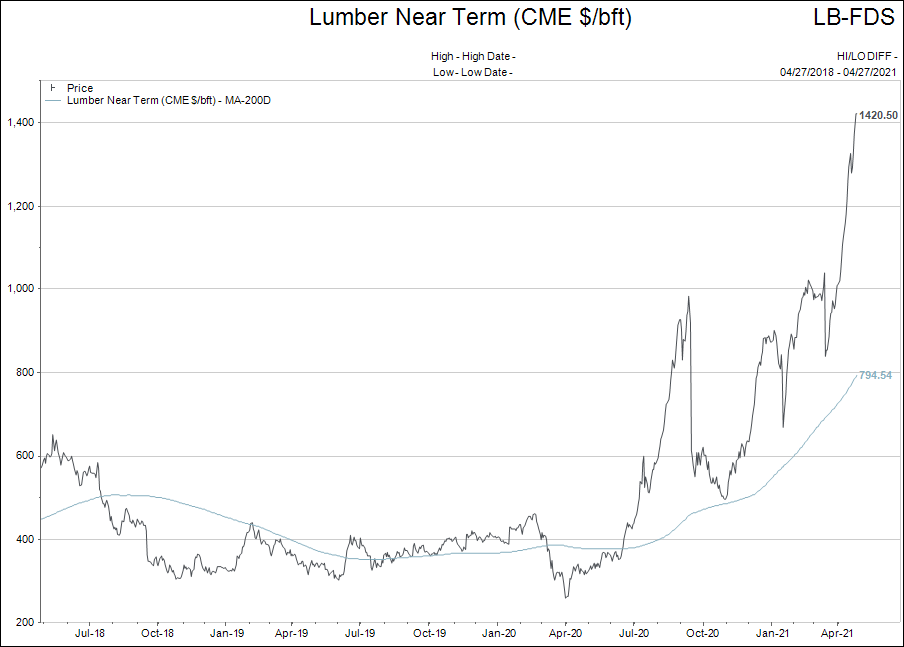
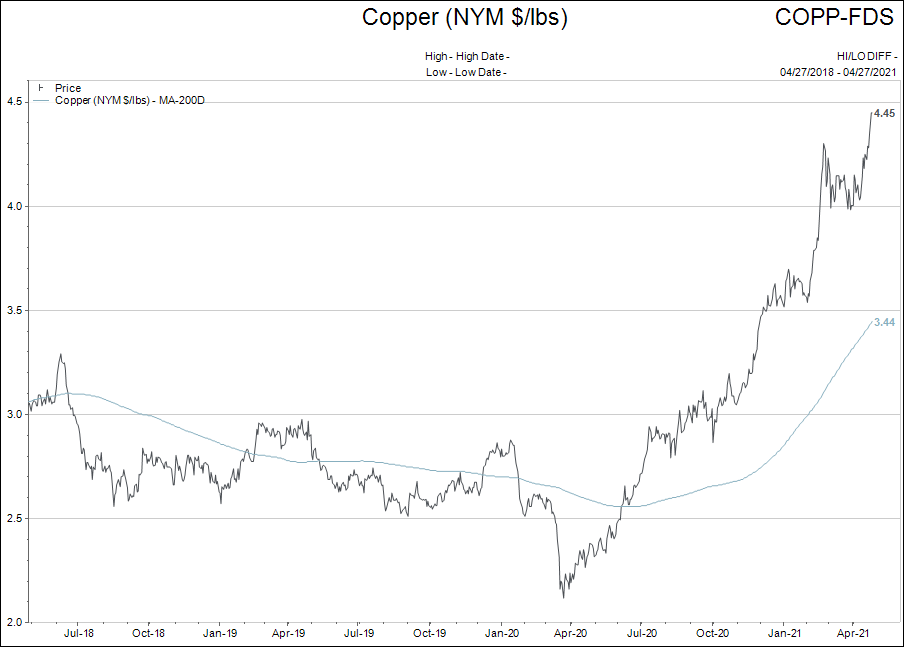
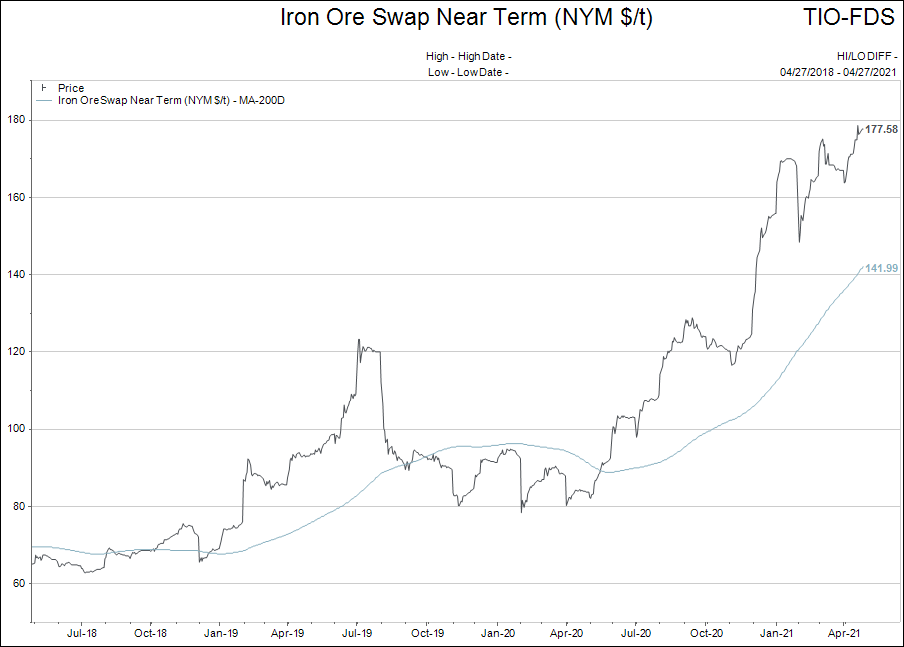
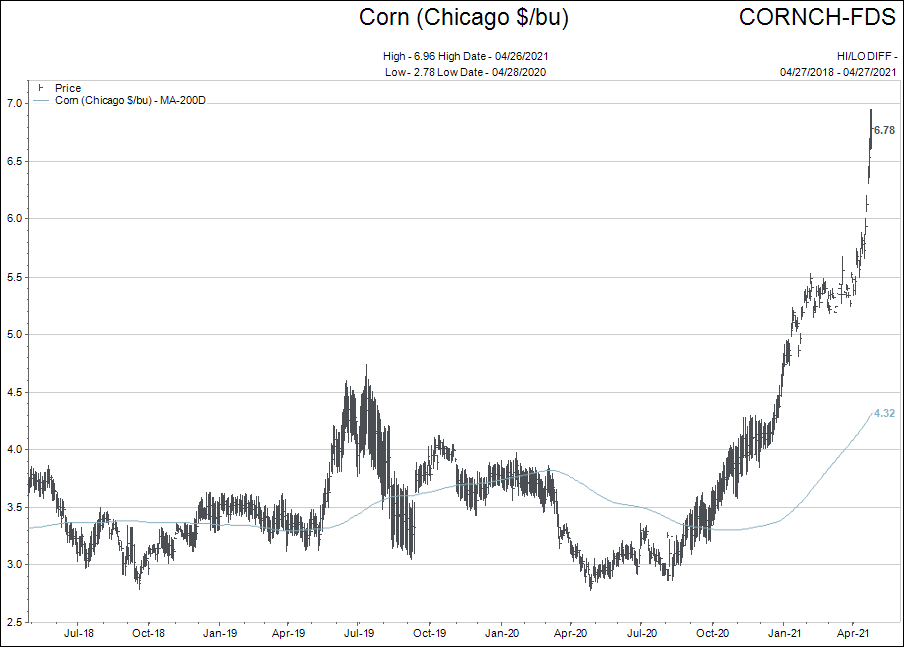
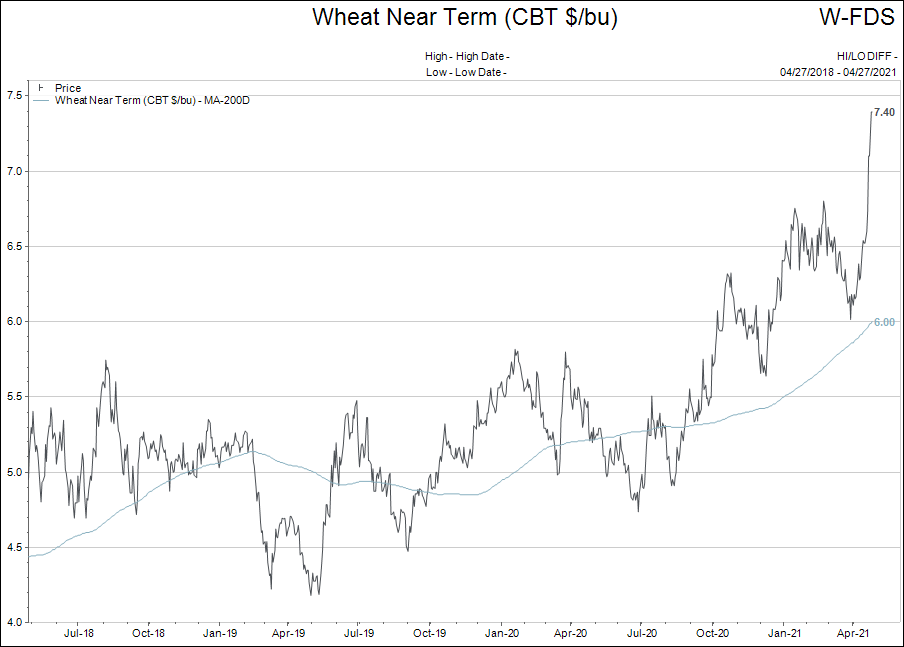
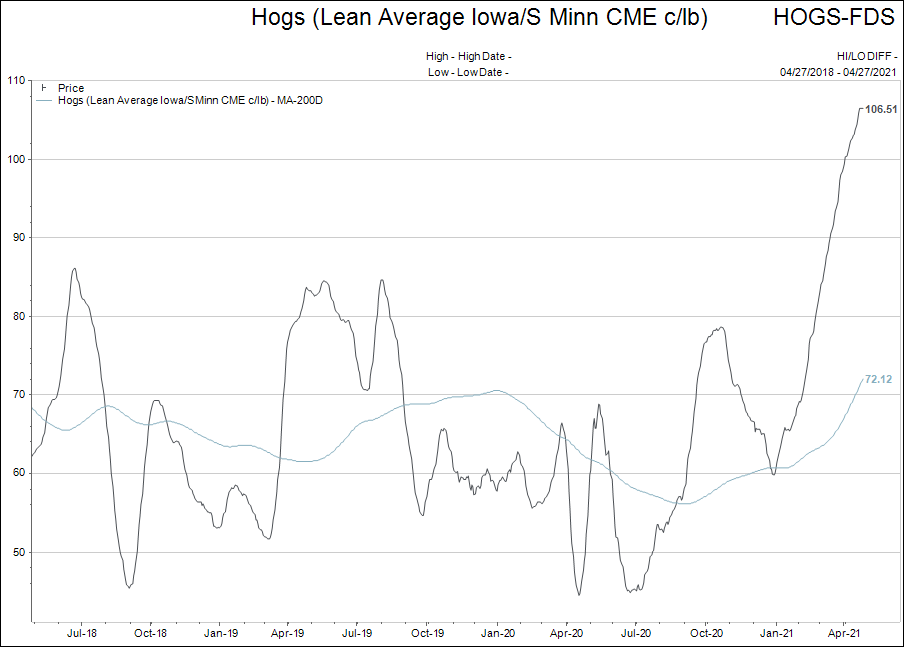
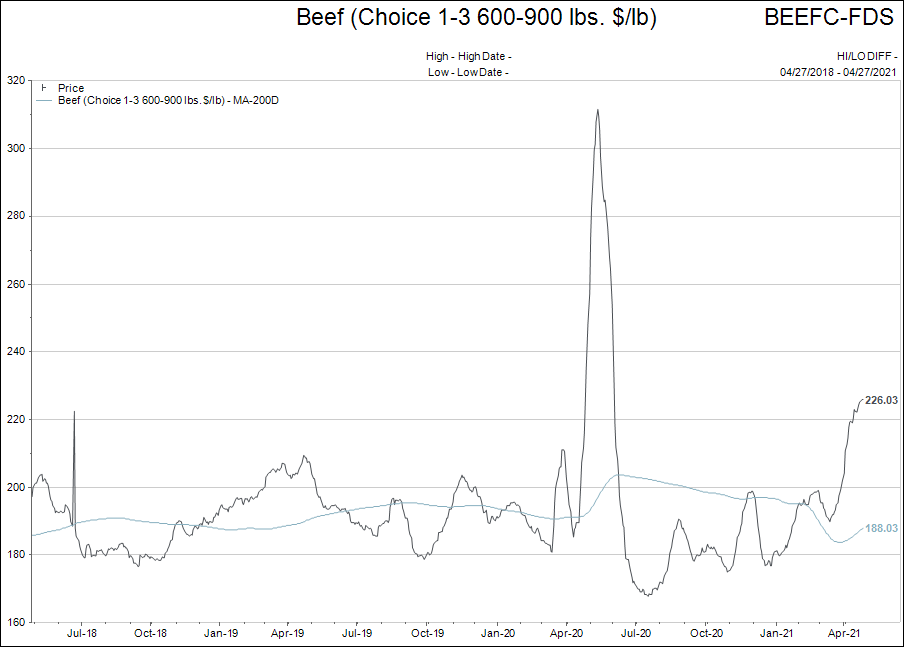
Again, I could include plenty more charts to make the same point: Inflation is gaining traction and wider impact in our lives whether our leaders wish to acknowledge it or not.
To finish the report, we come back to interest rates. Why? Because interest rates are the most important variable in the over-indebted world.
Interest rates are also the most manipulated variable in the over-indebted world.
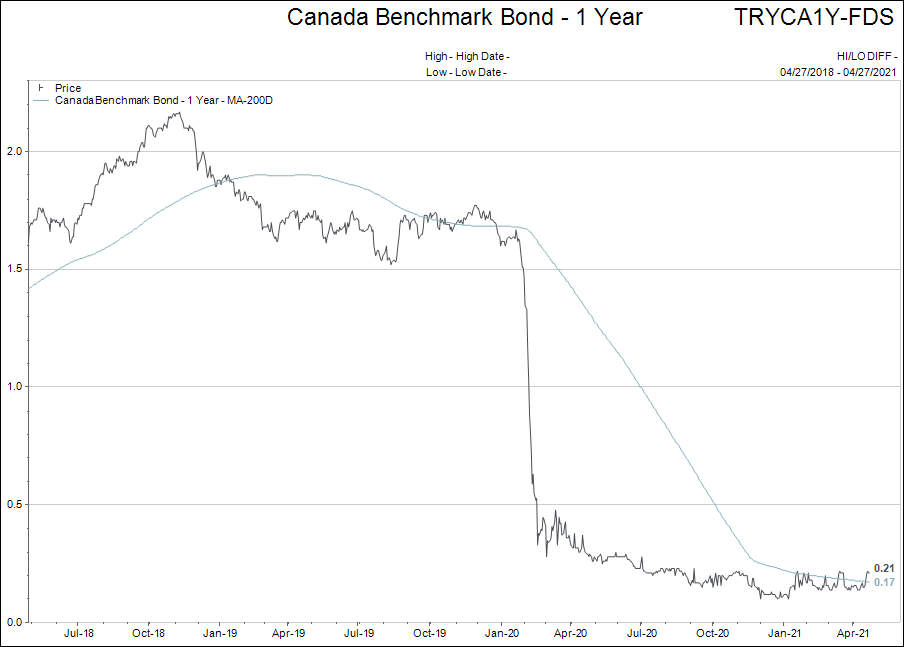

It just makes me smile when I look at the charts of interest rates. Stocks at all-time highs, real estate prices totally detached from average earner’s income, commodity prices smashing through multi-decade high price levels, but virtually no move in short term interest rates because “there is not enough inflation.”
Sorry, if it wasn’t so sad, it would be funny.
Feel free to email your questions and feedback to me.
[i] An excellent essay on the impact of central banks on asset prices is “The Three-body Problem” by Ben Hunt at Epsilon Theory. It was written in 2017 and is more valid today than it was when penned.