
Gold
Gold has been a mystery to many traders the past few years, and has been especially perplexing since the price peak in the summer of 2020.
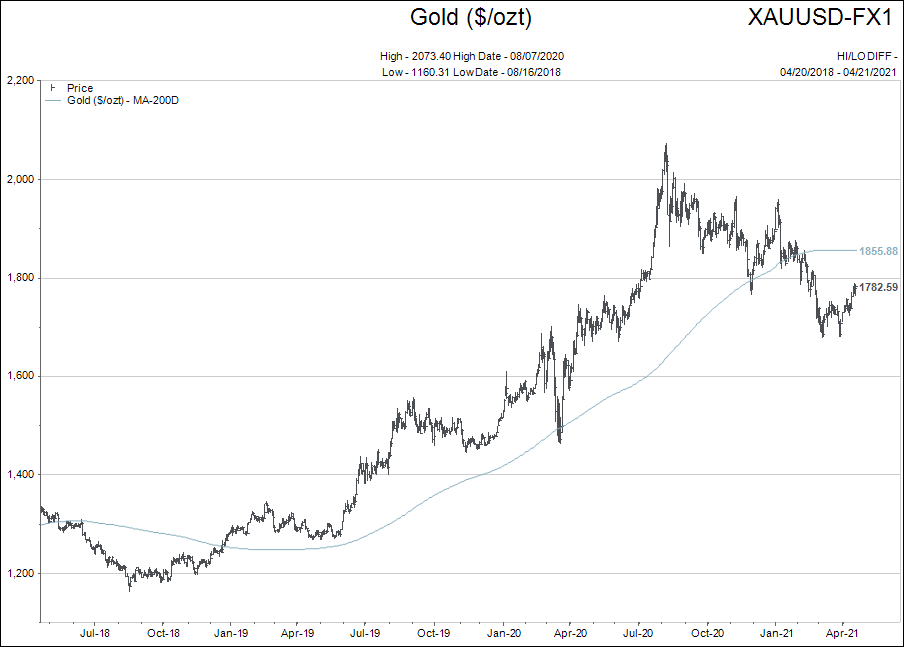
At the beginning of 2021, gold was threatening to break the $2,000 US level, but isn’t gold supposed to be a value hedge against outrageous money printing by the central banks? Had Bitcoin taken over the mantle of the asset class that would maintain purchasing power during inflationary times?
Gold turned into a spurned asset that investors relegated to the relic pile of financial assets.
The sentiment towards gold is the most negative in recent history.
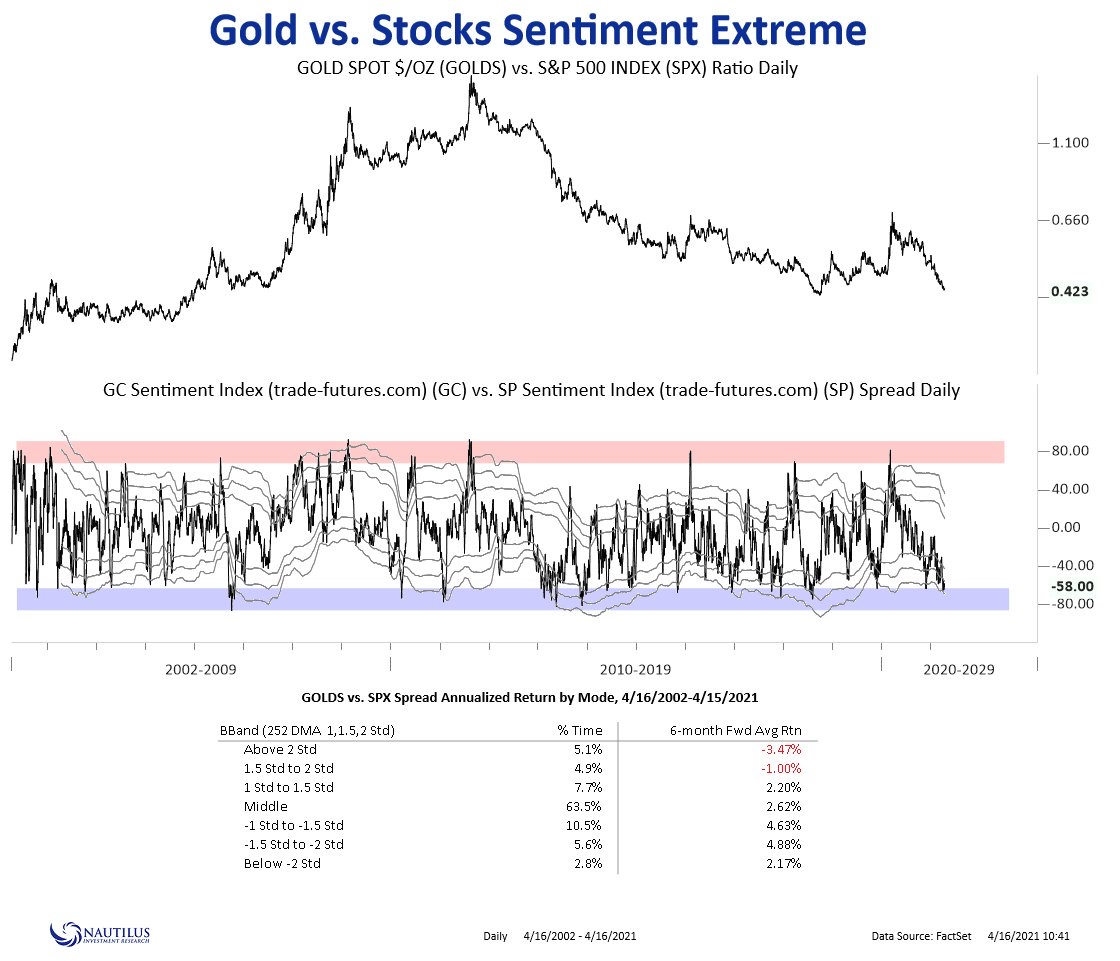
As the old expression goes price has an odd way of impacting sentiment in the financial markets.
So is there light at the end of the tunnel for the yellow metal of kings? It is early to say.
This link is to a story that I also think will play into coming months and years when one considers holding gold related investments. It refers to the opening up of Chinese citizen’s ability to purchase gold.
The chart of gold looks more constructive than it has for a couple of months. Feel free to call and chat about anything gold related if you have interest.
Passive Investing
Buy and hold or passive investing has always been a thing.
Portfolios were often measure in terms of turnover as a way of seeing how passive the investment style of the manager was.
Index exchange traded funds (ETFs) changed the way passive investments were held by:
- Constructing portfolios with zero turnover other than changes in the underlying index.
- Creating an extremely low cost, broad exposure to an underlying index minimizing company specific risk in the portfolio.
The popularity of passive investing has been further deified by the long running BULL market, and the short duration of sharp corrections via monetary policy.
What got me re-evaluating the passive structure of the stock market was the composition of the crypto currency market. Let me explain…
Below is a chart of the ownership structure of Bitcoin. It is from 2017, but it validates the point about passively held Bitcoins. You can see how 4% of the addresses own 96% of the Bitcoin.

Remember, Bitcoins have a total market capitalization (value) of over $2 trillion now.
The takeaway to grasp here is that over 90% of the Bitcoins never change hands, meaning that less than 10% of the Bitcoins being bought and sold, are dictating the market value for the entire asset class.
Why does this matter?
Think of it this way. As long as the belief is that Bitcoin is the future of money and a long term store of value, there will remain more demand than supply for Bitcoins.
Not only will the 10% of Bitcoins being traded gain in value, but also the 90% of passive Bitcoins gain too.
Really see what that is saying. A $2 trillion valuation is being pushed around by the demand for about $150,000,000 worth of Bitcoins.
If for some reason that belief changed, and Bitcoin’s long term viability was questioned, the desire to sell would likely impact not only the 10% being actively traded, but also the 90% passive holders.
The huge Bitcoin supply increase would devastate the weak demand for Bitcoins given the narrative shift questioning the long term viability of the crypto currency. This is not a prediction. Only an illustration of an extremely skewed ownership model in an asset class explaining what COULD happen.
Now we can apply the same principle to stock markets.
As passive stock holdings have grown exponentially in ETF and managed portfolios, a larger and larger composition of the total shares outstanding have gone “non-trading.”
For example, the largest ETF representing the S&P500 is the SPY ticker symbol. It is nearly $400 billion in market capitalization and is a completely passive investment.
There are hundreds of ETFs tracking the S&P500 around the world. The total value of passive shares held in the S&P500 has grown dramatically as a percentage of total S&P500 market capitalization.
As with our crypto example, as long the passive investment segment of the stocks in the S&P500 continues to grow in total dollars invested, the relatively small percentage of the shares traded in the float, will continue to have significantly skewed demand over supply.
At the same time, what if the narrative changes and passive assets holders become net sellers of the S&P500 stocks?
This is exactly what happened in March 2020. The decline was swift and relentless.
In summary, my analysis is drawn more and more to the STRUCTURE of the financial markets, rather than the NARRATIVE. I have had conversations with so many of you that follow along the line that markets don’t make sense anymore or how can this be happening? Those are all narrative conversations.
The plumbing of the financial markets is what really captures my attention and there is a much more interesting story being told there too.
Let me be clear, the financial markets are and have been broken for some time now. That brokenness has led to large upside moves in asset prices.
But the same principles that drive stocks higher can work in reverse if the narrative changes. Broken doesn’t mean BULLISH or BEARISH…it means broken. Our job is to invest as wisely as possible given the conditions.
Bank of Canada Decision
There are still some things that make me laugh and smile in this job. I love when central banks begin to tell us they are planning to begin tightening financial conditions.
This week Tiff Macklem, of the Bank of Canada, stepped up to the plate and delivered one of these humorous statements about slowing the rate of Bank of Canada bond purchases.
Good intentions…but I’m afraid that ship has sailed many years ago.
So let me interpret the reality of what the Bank of Canada is saying: We will begin to tighten financial conditions until (1) asset prices start to decline or (2) interest rates start to go up, at which time we will begin to print more money to buy whatever it takes to stop (1) or (2).
Doesn’t that seem more true to form?
Charts of Interest
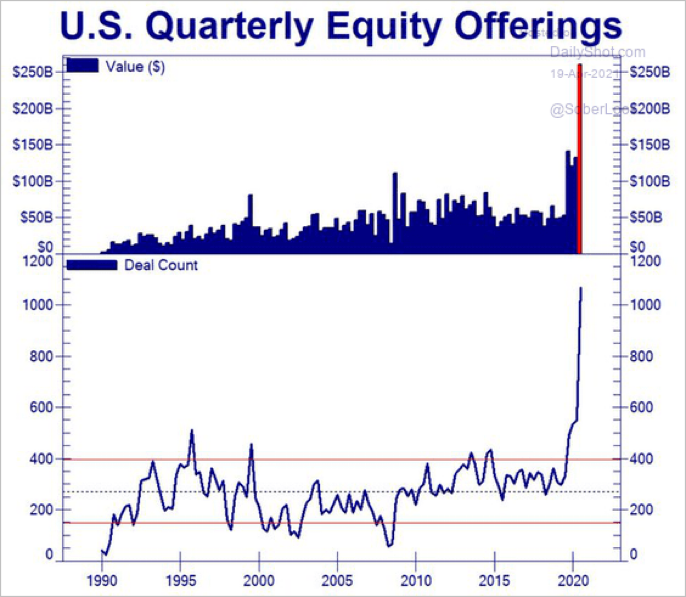
Another old expression is strike while the iron is hot, and the new issue market for stocks has been smoking. How far with this trend keep rising in its present parabolic state?
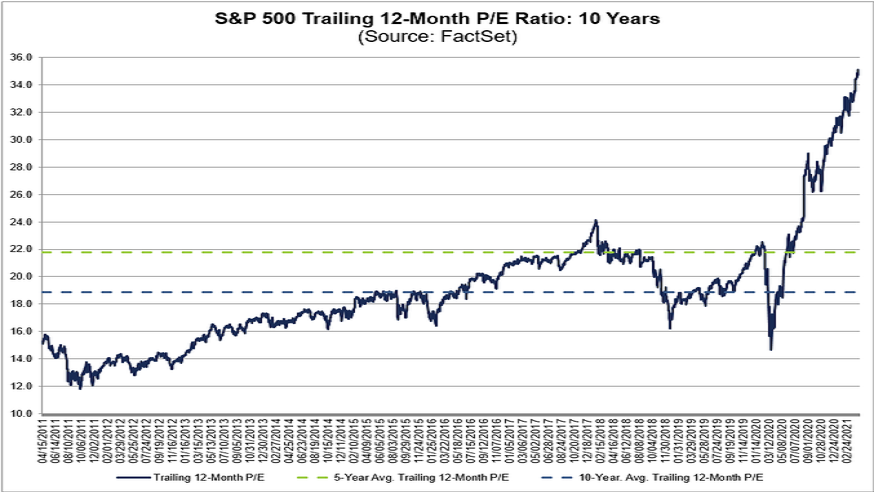
The next chart is not quite parabolic, but close enough. It is the P/E ratio on the S&P 500. I wish it went back to 2000, because that is the last time this chart was that steep.
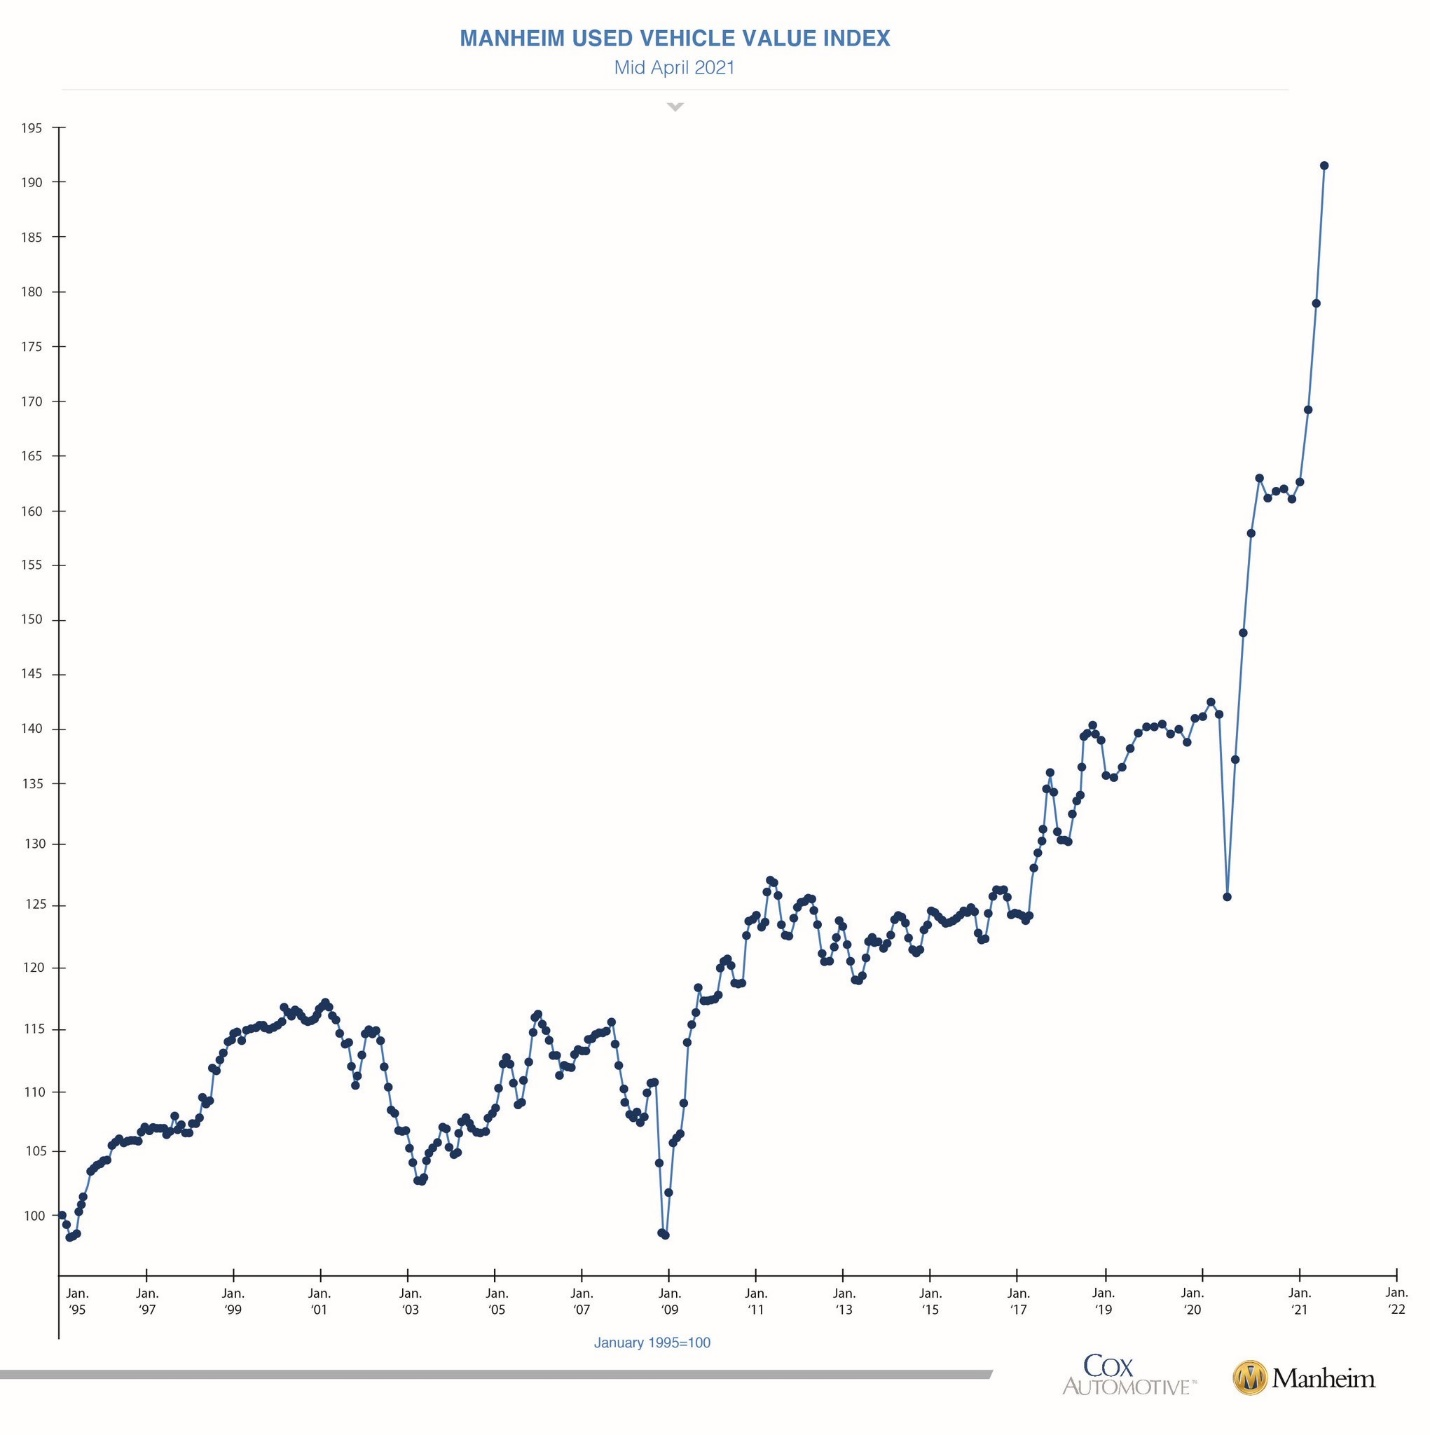
Below is a chart you don’t see every day: Used car prices in the US.
The reason for the increase is the lack of new car inventory due to component bottlenecks.
As always, please feel free to reach out to me to discuss any investment ideas or concerns you may have about your portfolio. Hope you have a nice spring weekend.