
What a Fool Believes
The 1978 Doobie Brothers hit song “What a Fool Believes” was actually written by Michael McDonald and Kenny Loggins. The song reached number one on April 14th, 1979, for one week. The chorus goes:
But what a fool believes, he sees
No wise man has the power to reason away
What seems to be
Is always better than nothing
Than nothing at all
Ironically, I remember sitting on the dock at our family cottage in 2002, on a warm summer evening, thinking about how those lyrics applied to what had just happened to investors during the aftermath of the 2000 technology stock bubble.
For those of you old enough to remember, this will stir some memories. For those of you who were not investors during “the tech bubble,” this will offer some frame of reference.
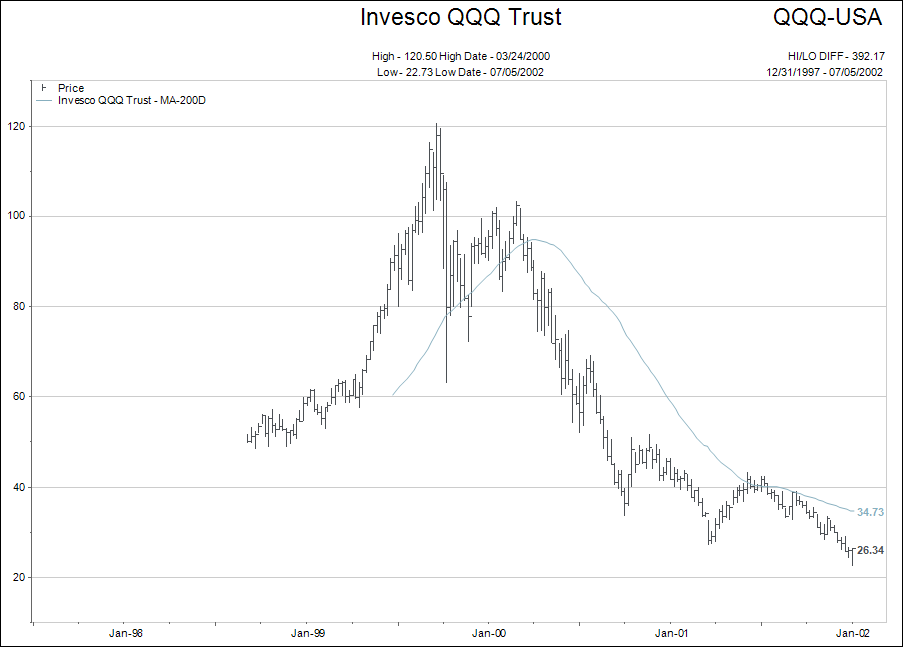
The chart above shows the NASDAQ 100 exchange traded fund (QQQ) from the middle of 1998, until the end of 2001.
Please look carefully at the sudden change in trajectory of the chart starting around April 1999. The QQQ share was trading around $60 and proceeded to double to $120 in by October that same year.
It was a relentless move higher that brought down some of the most famous hedge fund managers at the time who were betting that it “had to end” before the end actually came.
The Doobie Brothers song reference is a reflection upon how the 1997 - 1999 BULLS and BEARS would argue with each other. Remember, with no Twitter, Facebook, and whatever else people use today to publicize their stock opinions, the battleground of 1999 was CNBC.
The BULLS would tell the BEARS as the stock market went relentlessly higher that all of their ways of measuring value were outdated. Technology was still cheap because of the number of eyeballs on a screen, hits on a website, or something else that could be measured, but never monetized.
What I remember as being the most amazing part of this time period was that I no longer knew what to believe.
I had more than 10 years of financial market experience at the time and knew what I had been taught, but I started to believe that maybe everything had changed? If the stock market kept going higher SOMETHING must have changed.
“But what a fool believes, he sees, no wise man has the power to reason away.”
Of course, nothing had changed.
The bubble was seen to be a bubble and the NASDAQ lost 82% of its value over the next couple years. I remember thinking to myself sitting on the dock that evening, how truly confused I had felt for a while.
Let’s jump forward to the present.
The following chart shows the same NASDAQ tracking fund (QQQ) that I used in the first section of the editorial. This time it shows 15 years of time frame.
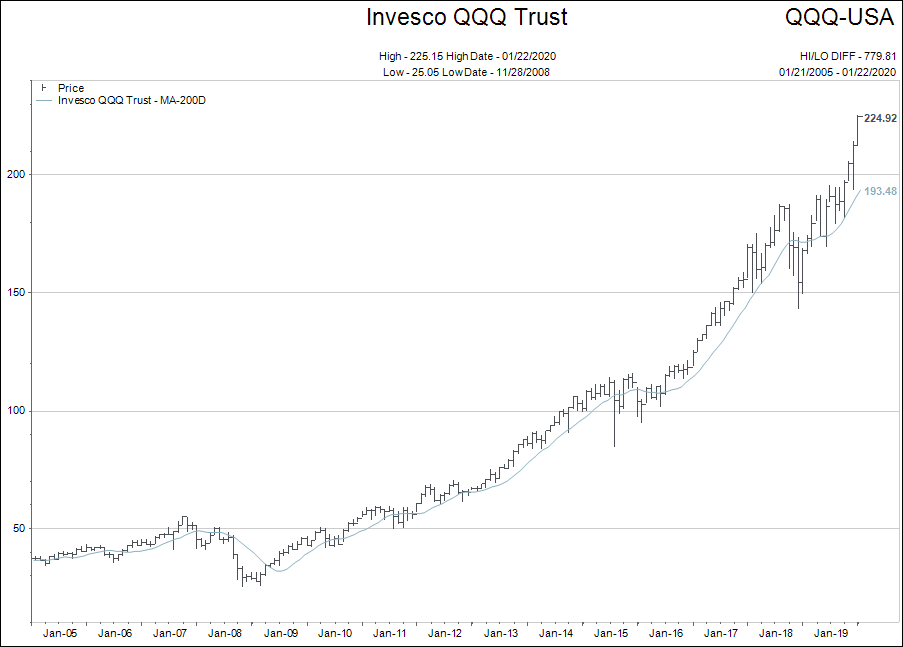
Just look at how steep the rise has been during the past four months.
It certainly is starting to remind me of a time 20 years ago when the BULLS would tell us about “eyeballs on a screen” or “hits on a website.”
What are some of the up to date expressions?
- Debt doesn’t matter anymore.
- Buybacks don’t influence the stock market.
- Low interest rates justify high stock valuations.
- The central banks have got our backs and will never let the market fall.
- Companies don’t ever need to make a profit as long as they gain market share.
There are many more, but you get the picture.
You are being nudged to believe that 2 + 2 = 5.
If you don’t believe it yet, you will, because everything you see and feel will tell you it’s true.
Last week, I wrote about investing in the final leg of a bubble. If you did not read that editorial, you can see it here.
You can invest during a bubble and make money, but you have to have an exit strategy and the ability to take a loss. Nobody knows when the music stops and everybody has to find themselves a chair.
If you can’t afford to take a loss, you need to take some time to go over your investments and make sure we are on the same page as to actions to take if and when the next correction takes place.
A Few Charts
Just a couple of charts that caught my eye this week:
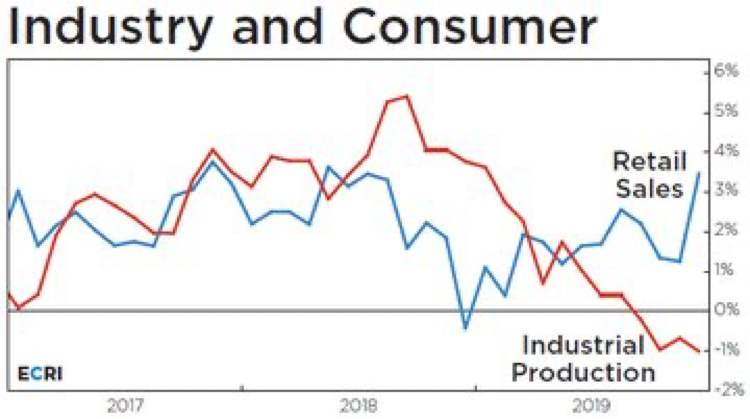 Usually, lower industrial production will flow over into the jobs numbers and finally on to retail sales; we will see how this progresses.
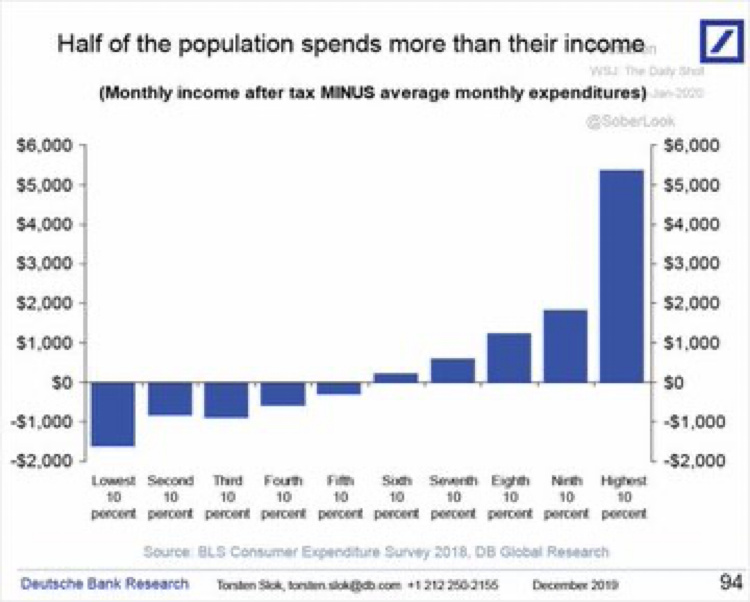
The next chart shows that 50% of the American population now spend more money each month than they earn.
There is not a lot of historical data to say what these levels were like 10- or 20-years-ago. It is safe to say that low interest rates and easy credit exacerbate this situation.
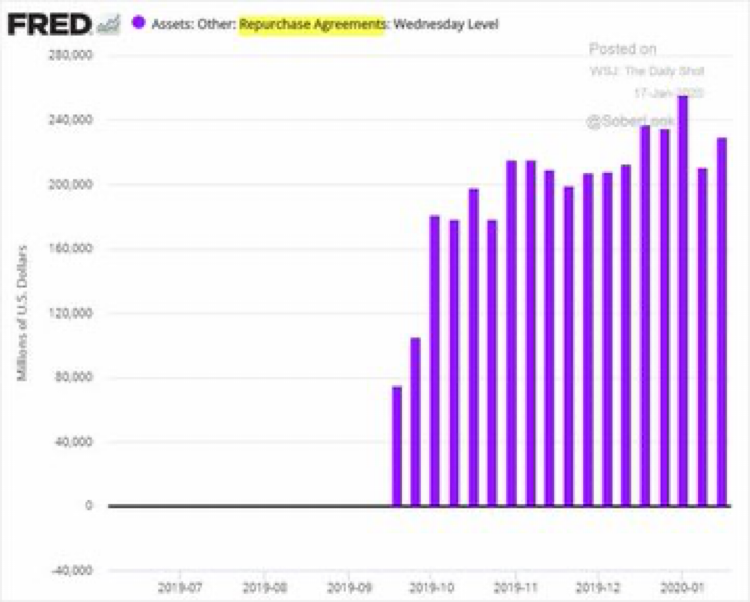
This next chart shows the constant flow of Federal Reserve money into Repurchase Agreements. I guess the overnight repos were not “temporary” like we were told in September 2019?
Next, we look at a graphic that shows “the percentage of sectors within the S&P500 that are at record high levels.”
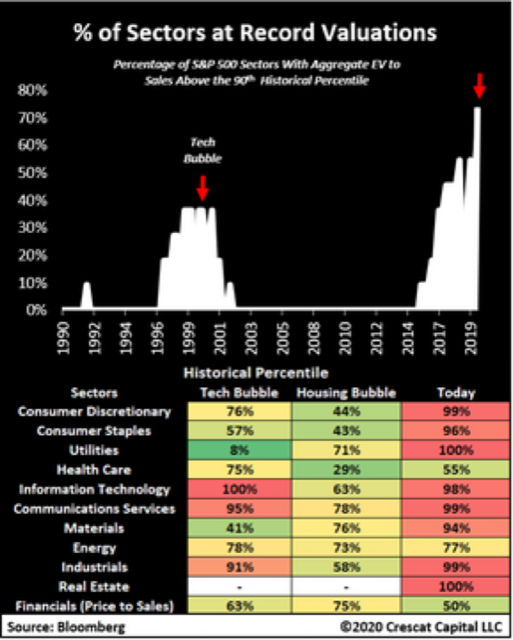
Two things to notice here:
- The present 80% of S&P500 sectors at record highs is an all-time record.
- Only financial bubbles create cross all sector highs in stocks. Notice how the “real estate bubble” of 2008 did not even register on the graphic.
Not only are stock and bond markets expensive, they are expensive in a unified manner. I know, like we said in the first section of the editorial “nothing matters in a bubble” but I’m just sayin’…
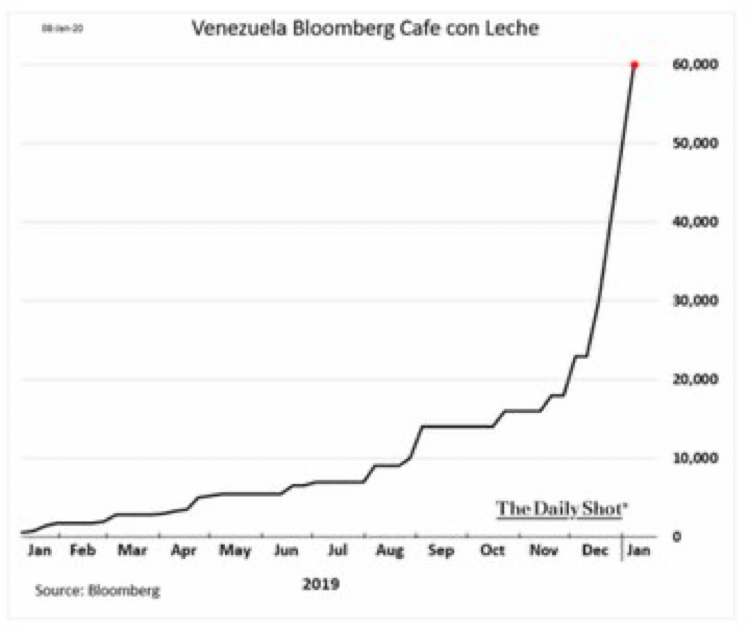
Finally, for fun, I thought I’d show you what it is like to buy a cup of coffee if you are a citizen of a county in hyperinflation.
Until next time.