What might French pension reforms be foreshadowing for the future?
The following section was written by the RBC fixed income department and is used with their permission in the weekly comment.
French pension reforms are worth watching. As the low interest rate vortex has gripped financial markets this year, we have penned a number of pieces that flag the strain this places on public pensions. Today that angst has spilled into the streets as the French government is making some changes to the French pension system. Below is a summary of some of the highlights. (Emphasis by Nick).
- One public pension system instead of 42 currently
- Benefits indexed to wages, not inflation
- New regime applies to everyone born from the start of 1975
- Those who are born from 2004 will only contribute to the new system
- Legal retirement age unchanged at 62, full benefits not available until age 64
- Retirement age rises to 64 from 2027
- Minimum pension of 1,000 euros a month from 2022 for those who worked a full career
- Minimum pension pegged at, at least 85% of the minimum wage
- Workers earning more than 120,000 euros a year will pay extra
- Those who started work before 18 and those with “hardship” jobs, including night workers and nurses, will still be able to retire with full pension at 62
- Prison guards, police officers and firefighters will keep their special regimes
French minimum wage is €18,255 per year, which equates to just under $27,000 per year in CAD terms. Considering the minimum pension is equivalent to 85% of this amount – the figures below highlight the sheer amount of money that would need to be saved to achieve this level of income at retirement, using today’s investing environment (in Ontario).
It also gives an idea of the relatively generous present value of the new system being implemented in France, particularly in the context of French sovereign bonds that pay no (or negative) interest.
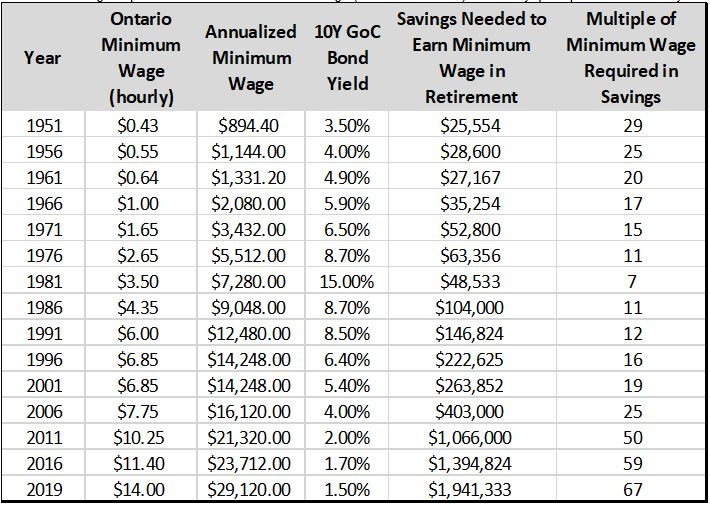
The chart below shows the same data except in bar-chart format.
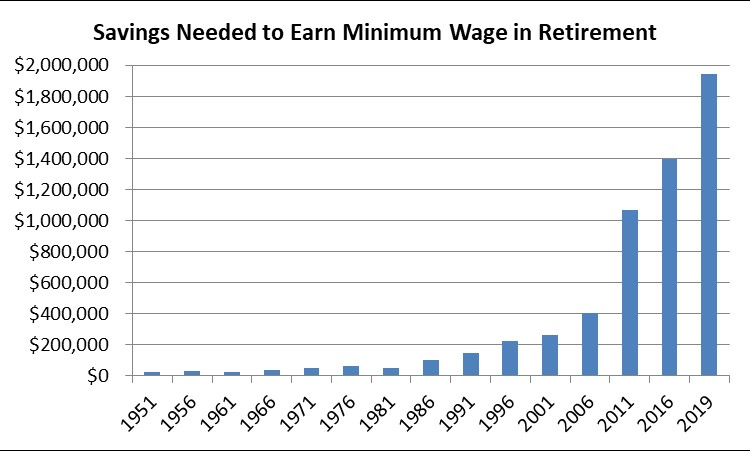
Nick’s comment: There is not much I can add to the work the RBC fixed income desk did to create this report.
I believe the chart above represents the best graphic illustration of the destruction of savers purchasing power that I have ever seen.
Feel free to write any feedback you might have about what this short report makes you think about. I’d be very interested to hear your thoughts.
A Few Charts…
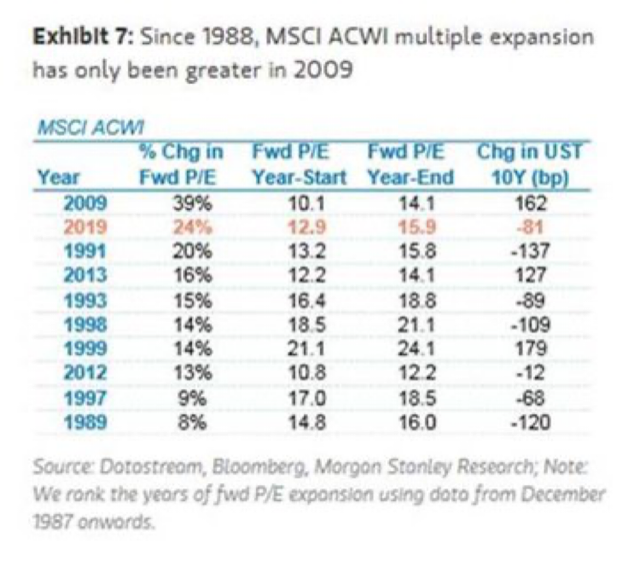
The chart below ranks the largest P/E multiple expansions since 1988. What that means is that the prices of stocks go higher, but earnings do not go higher.
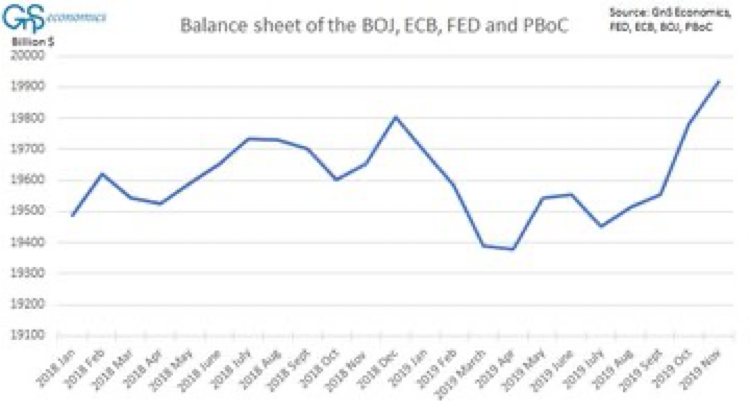
The next chart shows combined central bank monetary printing in terms of their balance sheets. New record of total money printing in December while stock markets are at all-time highs.
Closely connected to the money printing chart above, the following chart shows the market-weighted percentage that the largest five companies make up in the S&P 500.

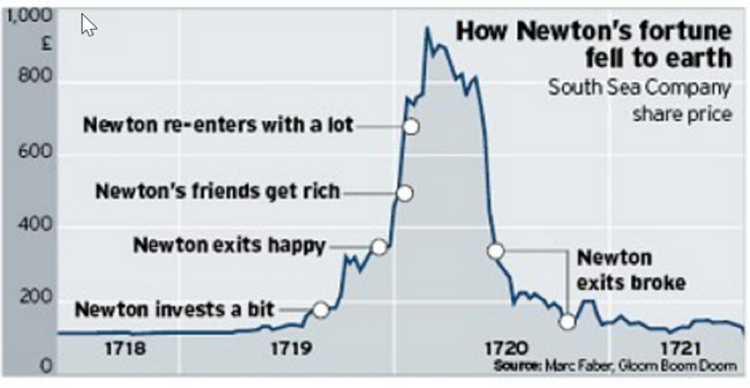
Finally, for a little fun, below is a chart of Isaac Newton’s investing history during the South Sea Bubble of the 1600s. Smart guy when it came to falling apples…investments he was pretty much like the rest of us.
With the holidays just around the corner, please keep in mind that our office hours will be as followed:
Dec 24th 8 a.m. - 2:30 p.m.
Dec 25th & 26th CLOSED
Dec 27th 8 a.m. - 2:30 p.m.
Dec 31st 8 a.m. - 2:30 p.m.
Jan 1st CLOSED
Wishing you all a joy filled holiday season and we’re looking forward to a happy, healthy and prosperous 2020!
Have a great weekend!
