
Global Money Printing Making a Comeback?
A starting thought:
“In the modern system, there are more tickets sold than seats in the house (more money/debt printed than products and services, at current prices.) The elites are good at playing for time, but eventually ticket holders will want to go in.
So you’re down to a choice among: denying entry to some tickets (default/deflation,) putting 4 people in every 3 seats (inflation/devaluation,) announcing everyone must wait indefinitely (financial repression,) and building more seats (economic growth.) If you’re the global empire, you can also make the neighboring theater honor some of your tickets, or make war to make that happen. There are no other ways out, and even if miracles come out of the labs, people may not spend money on them, so growth is really outside Team Elite’s control.
Historically, the Western elites have been pretty good at effecting a combination of the scenarios, to spread around the stress and keep their system alive.”
- Nick Comment: From a reader’s letter sent to Epsilon Theory, this note is concise and broadly correct.
Sticking to my goal of keeping these communications shorter and simpler, I am going to write two segments. The first looking at global money printing vs. global Gross Domestic Product (GDP) and the second updating where I hope to re-enter the tactical trading models for US and Canadian markets.
Please look at the chart below.

The chart shows the index level of global stock markets in the gold coloured line and the combined balance sheet size of the US Federal Reserve, Bank of Japan, and European Central Bank in white.
Notice how the white line has started to turn up again (red circle).
If the white line is rising it means more central banks are “easing” monetary conditions than “tightening.” Easy money has been the driver of markets for the past 10 years. We must keep a close eye on this development.
Why in the world the central banks would start easing again after spending two years trying to convince the world they were going to stop printing money?
Because financial assets will not stay at the same prices they are right now if the central banks do not support them.
One final chart for this section.
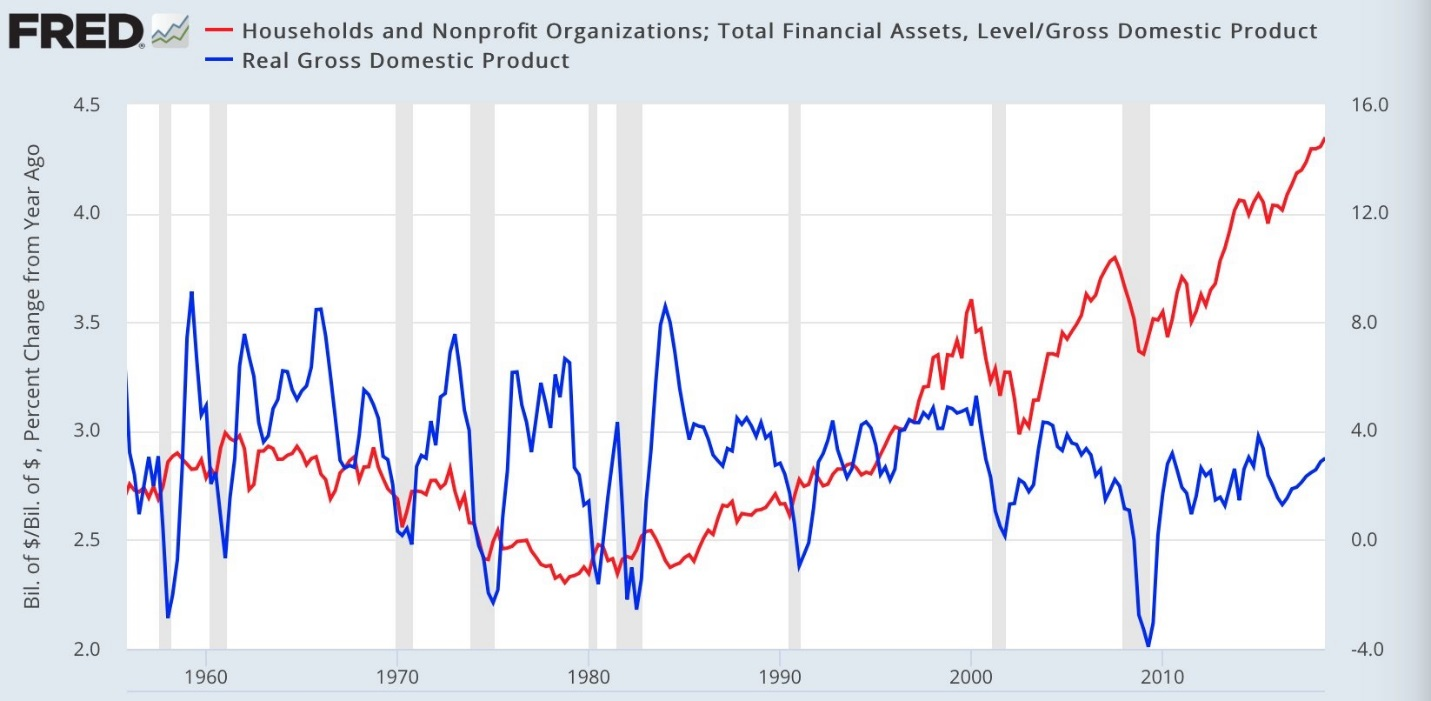
The data above is US only data but could be extrapolated around the world to developed nations
The blue line is American GDP growth and the red line is the percent of financial assets (stocks, bonds, and bank accounts) held by households and non-profits divided by GDP.
The chart makes the point the US households have never been more exposed to financial assets than they are at present.
Usually, it takes rising GDP growth to stimulate a higher exposure to financial assets, but that has not been the case for the past 10 years.
Therefore, central banks know that the economy is going to be impacted more significantly by any fall in financial asset valuations.
We will keep an eye on the trend of growing or shrinking central bank balance sheets.
If you believe--as I believe--that the majority of the “growth” the world has experienced in the last 10 years has been facilitated by central bank money printing, then it remains a key indicator to follow.
Part 2:
The ripping uptrend of the last 18 trading days finally saw some resistance last week.
I want to cut out the excess verbiage and just cut to the chase of what I am looking for in coming weeks.
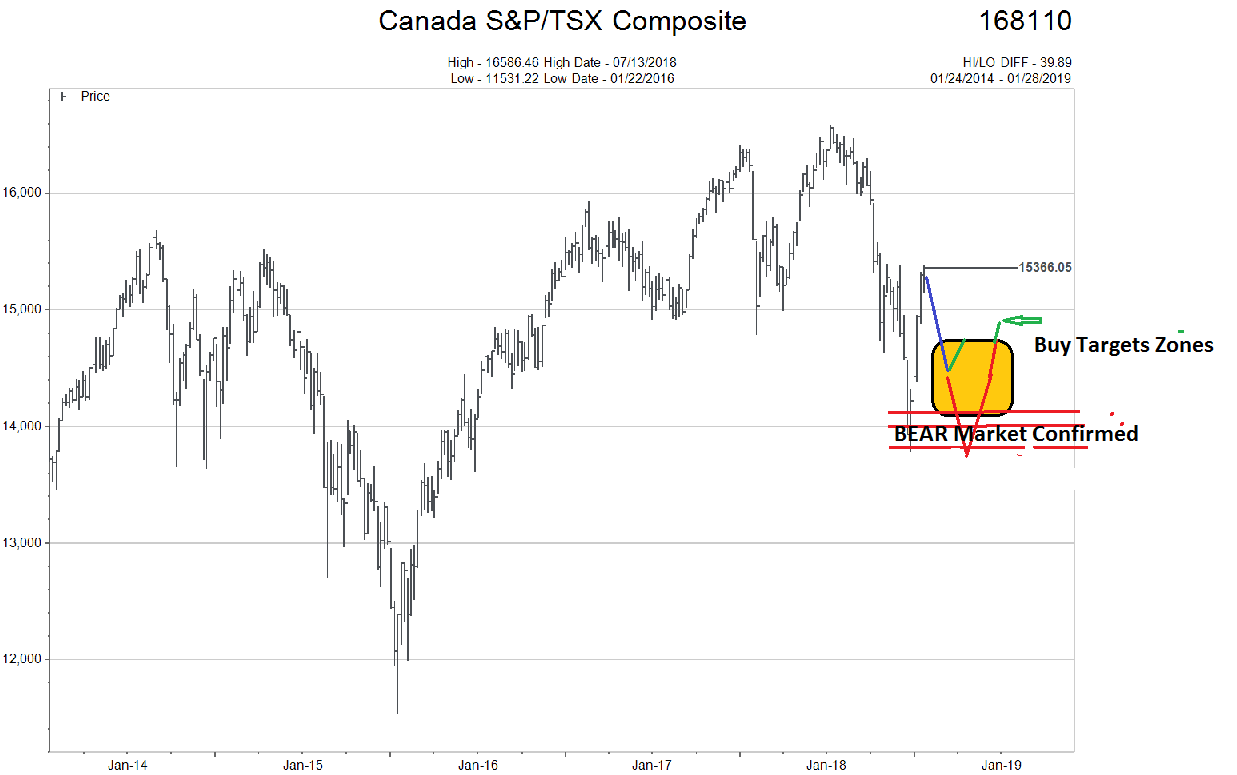
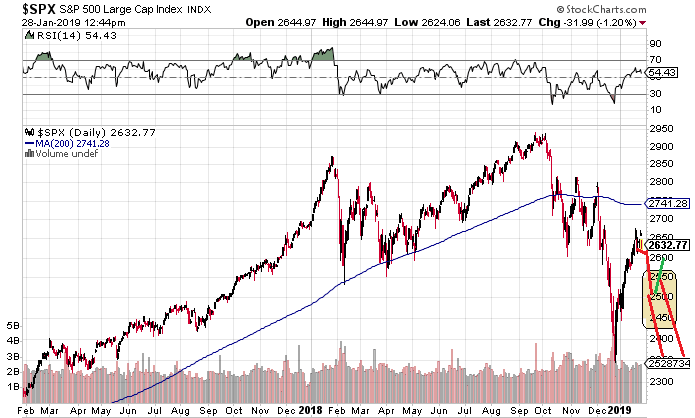
How these two charts resolve themselves will be an excellent clue as to whether we have entered a BEAR market or a normal correction.
Remember what we viewed in the first section of this editorial. The central banks REALLY don’t want a BEAR market in financial assets to accompany an economic slowdown.
There is a strong bias to continue to support asset prices here.