
The Really Big Picture
If I asked ten people what they would need to do to buy a new car I would get ten different answers.
These answers would consist of a handful of activities that are common to facilitate a car purchase such as:
- Choose a vehicle.
- Arrange to get the money or the financing.
- Compare different models.
- Take it for a test drive.
- Insure the vehicle.
You could add a few items to this list…and you may not need to do all of them either.
If I asked ten people what they are going to do with the rest of their lives I would again get ten, definitely different answers, and the variance in those answers would be impossible to list because of the nature of the question.
In reality, it would be likely that half the people could not honestly answer the question.
Why do I bring this up?
Wealth and personal savings follow a similar profile.
If I ask ten people what they are going to do with their next paycheck, I will get a relatively limited set of specific activities that will allow their financial lives to keep moving forward.
If I ask ten people what they are going to do with $100,000 in savings or inheritance, the list of answers may span a much longer period of time and touch on limitless possible activities.
With this in mind I want to ask you two questions:
- What does your personal pool of savings need to do for you over the next 20 years?
Think about this question for a minute and even jot down a few notes.
- What percentage of the pool of your personal savings is required for you to live the life you outlined on your list?
Next, try to figure out what percentage of your savings accomplishes this goal.
Could you do everything you want with 50% of your savings? Does it require 85% of your savings? Maybe it takes 0% of your savings because your pension income covers your month-to-month income needs?
The answer to the second question defines an important discussion point I aim to have with each and every client this year.
Let me show you why on the following graphic showing the US stock market for the past 90 years (hat tip to Jesse Felder).
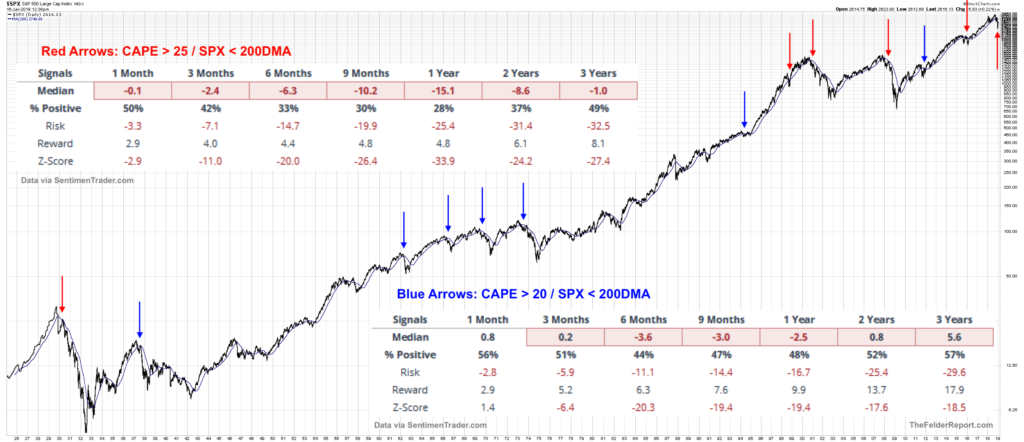
Don’t let the crowded size of the graphic throw you off here. I am going to blow up sections of it below so you can see the details.
What I want you to see here is:
- The “really big picture” of the US stock market. (Black line)
- The rarely occurring red and blue arrows on the chart.
The red arrows are where (a) CAPE* > 25 and (b) S&P 500 is BELOW the 200 day moving average.
The blue arrows are where (a) CAPE* < 25 and (b) S&P 500 is BELOW 200 day moving average.
*CAPE – “cyclically adjusted price to earnings ratio” – higher number = more expensive
What I want you want to notice is that the probability of larger declines INCREASES at the red arrow points rather than blue arrow points.
Ok, next let’s look at the two data boxes showing the historical rates of return from both the red arrows point in time and the blue arrows point in time.
The red arrows return matrix is blown up below:
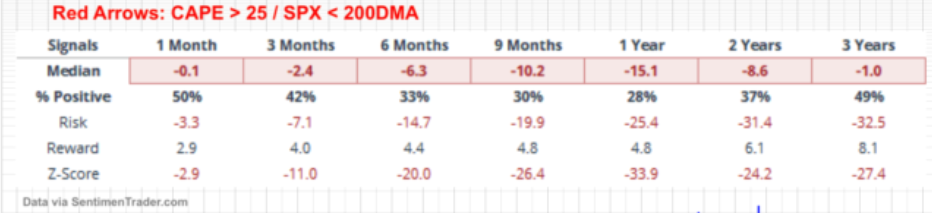
Check out the “Median” rates of return out as far as three years (shaded red) from each of the historical red arrow graph plots. All of the largest declines in history have started from a red arrow. The 1998 and 2016 downturns turned out to be mild, but 1930, 2001, and 2008…those were doozies.
The blue arrows return matrix is also worth a quick look, even though we are living in a red arrow market right now.
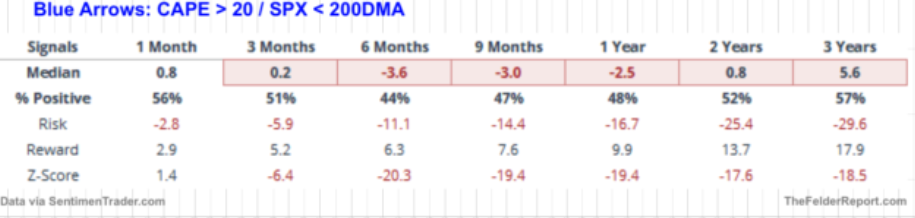
Even under the blue arrow conditions we see fairly weak three year median rates of return.
Bottom line: Be careful.
Don’t get caught up in the day to day rhetoric in the financial media.
Food For Thought
It has struck me a number of times over the years how performance of financial markets has little to do with the general state of the world as perceived by the average person.
Financial markets peak when the world is seemingly in a wonder position. Financial markets bottom when the world is in the middle of recession.
The reason this happens is because financial markets are “forward looking.” In other words, financial markets anticipate what is coming six months to a year out.
There is a certain amount of intuitive acceptance of this reality.
But there is another issue that I want to bring to your attention that plays out in the same way in financial markets.
Financial markets do not care about the human life condition.
The state of humanity can be devolving quickly and, as long as “business” is perceived to be able to prosper, financial markets will respond positively.
Let me use a brutal example. Below is a chart of the S&P500 from January 1939 to February 1950. I doubt I have to chronicle what was going on in the world during that timeframe in this note.
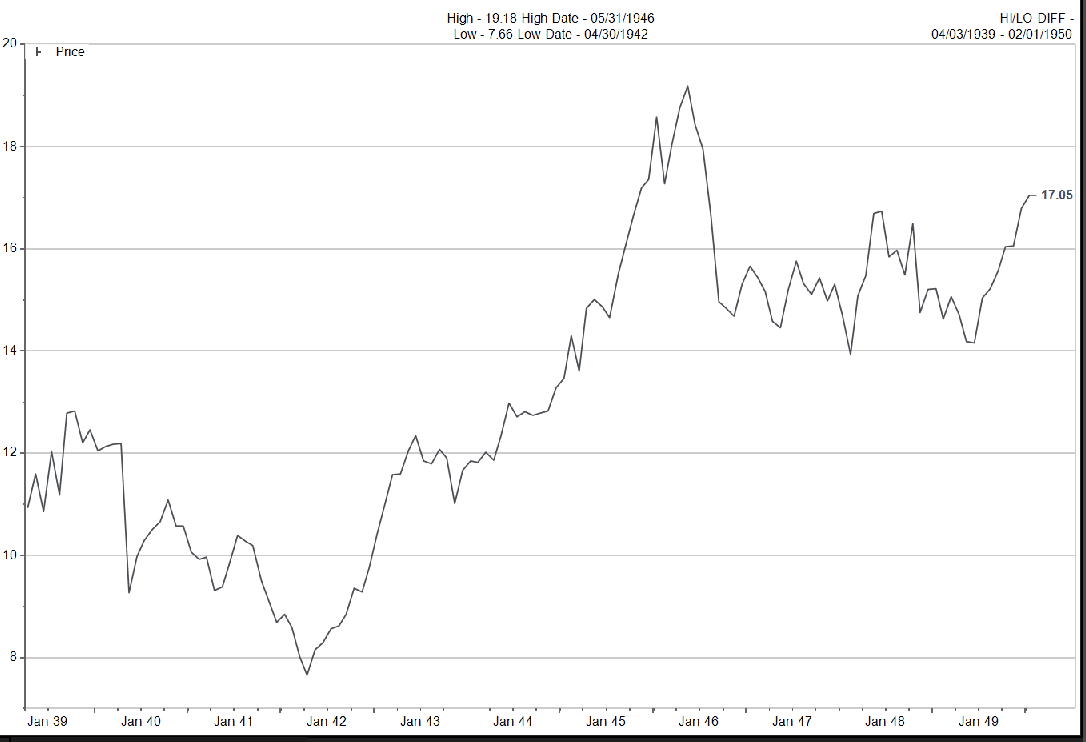
Notice that the S&P500 went up by 130% in three years from 1942 to 1945. Those were not really great years to be a citizen of the world…
Yes, this is an extreme example, but it is a good one.
There are times when the world is in sync. Lives of people improve, jobs and opportunities grow, and financial markets do well. Those are the best of times.
The past ten years have been an example where things have not been quite so simple.
This is an important idea to keep in mind when looking at market behavior.
Now, please think back to the question I posed earlier, “what percentage of the pool of your personal savings is required for you to live the life you outlined on your list?” for the final question of this weekly comment.
How much risk do you need to take given the size of your savings pool AND the long term stock market conditions outlined above?
You don’t have to figure that out all by yourself.
It is my job to help you with this question, BUT I hope this gives you a good set of background data to use as a guideline to making these asset allocations decisions.
As always, feel free to touch base with me or set up an appointment to discuss.