Update: A Lot has Happened Since Last Week
My goal is to outline some of the reasons why there is a good chance stock markets will hold the low levels made Tuesday, October 28th, for the next 30 days.
Let’s start with a big picture view of the Canadian stock market.
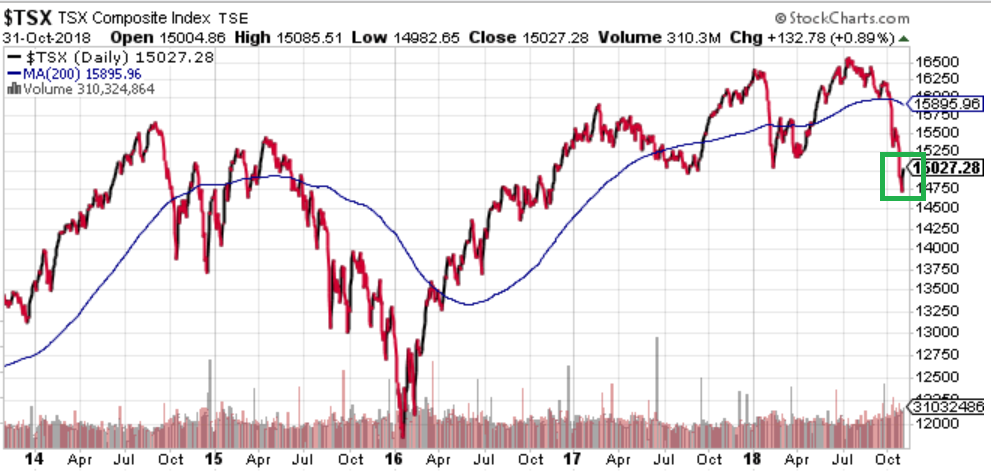
The five year chart above shows the meandering trend of the Canadian stock market. The green box on the right hand side of the chart, shows the “October 2018 bottom,” that the Fast TEAM model is hoping will hold and allow stocks to bounce back into the range of 15,650 – 16,000.
Here is the same TSX index viewed in a two year time frame.
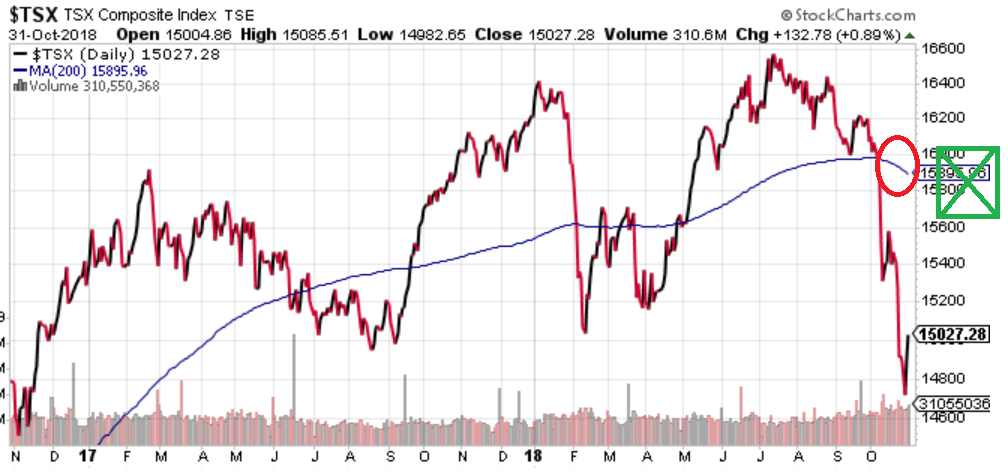
November marks the end of the seasonally more BEARISH part of the year, and the green box with an X in it, marks my bullish target for the TSX before Christmas. We will see if the markets co-operate with offering a bit of Christmas cheer.
There were a lot of technical signs telling me that the bottom made on Tuesday last week was a good one. That does not mean the stock market recovers in a straight line…it just means there was enough “investor fear” to clear some of the BULLISH over-optimism from the summer rally.
A few of the technical signs:
- US bank, retail, small cap stocks had started to outperform the major indexes on Friday the week before, but the continued drops in large technology companies was hiding the strength of the broader market.
- Oversold readings were getting “really oversold.”
- Investor sentiment was finally getting less BULLISH. People started thinking something could possibly go wrong in the stock market again.
Two things that keeps me nervous about this bottom are the lack of decline in interest rates and the US midterm elections this week.
Below is the chart of the yield on the US 10 year Treasury bond, which remains stubbornly high. Note: move the decimal point one place to the left to get the actual interest rate on the chart.
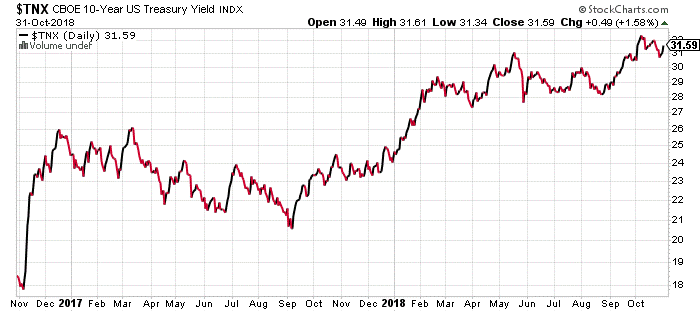
Much of the stock market troubles we saw in October started with higher interest rates. My hope is that the 10 year interest rate does not make a new high yield before Christmas.
So let’s peer into the crystal ball for a few moments and try to figure out what possibilities might exist for the Canadian stock market.
The chart below is a two year chart of the TSX again.
First, you will notice there are two red lines at the bottom of the chart. Those represent my “stop loss” where I simply admit the October decline has not finished yet.
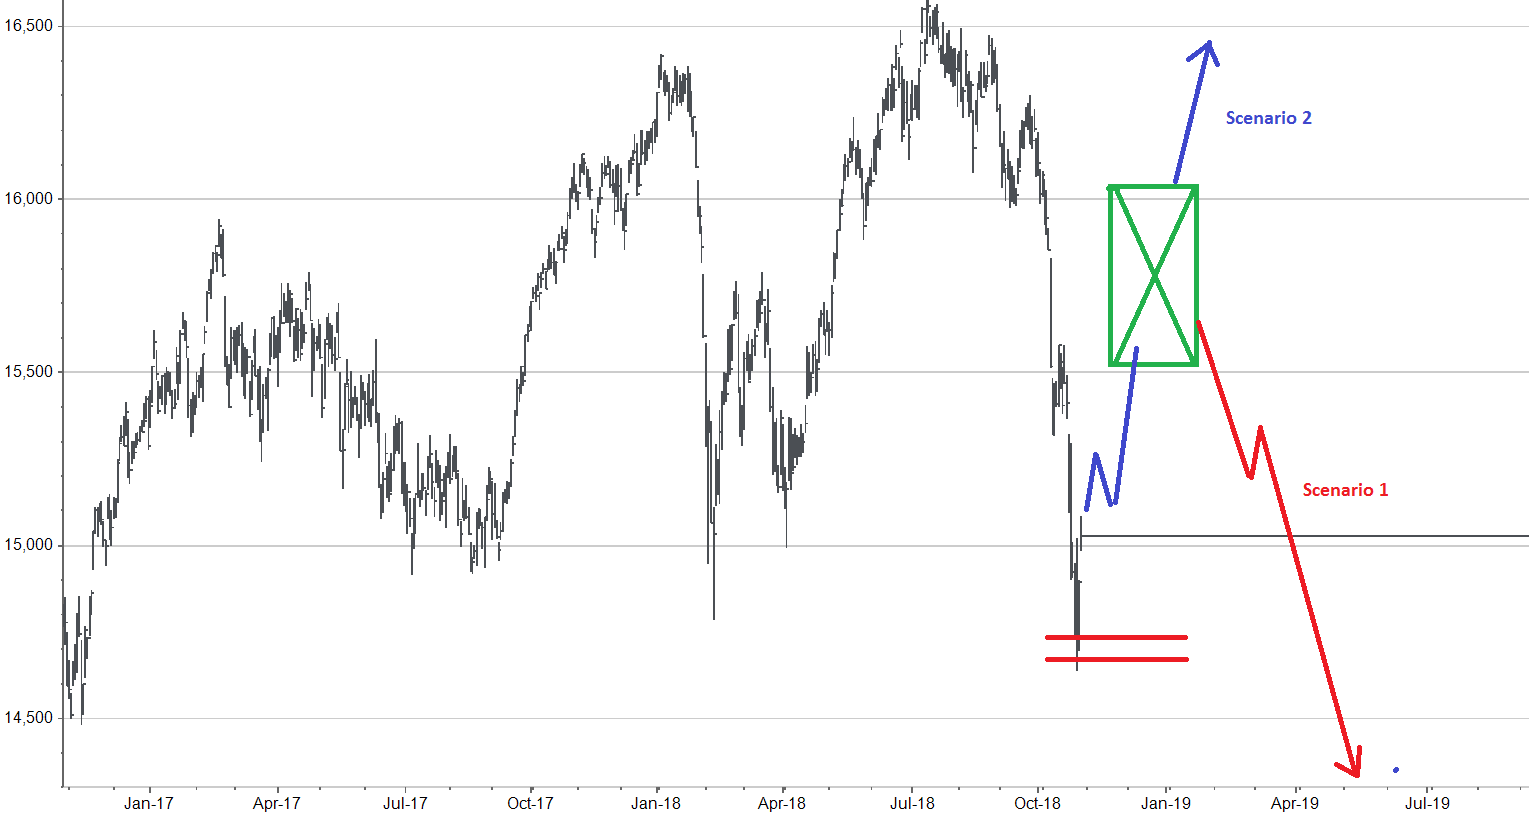
The second thing I have done is add the same green box we viewed above for our short term (by Christmas) target recovery level. The bounce into the green box is the absolute minimum expectation and is a must to be achieved to officially say the downtrend of October 2018 is complete.
Assuming the TSX recovers to the green box, the next part of the puzzle is where the investment picture gets interesting.
Let’s take a quick detour and talk about some common problems facing companies when it comes to making money that did not exist a year ago.
- Higher Interest Costs – virtually every company earnings report so far this quarter has cited higher interest rates costs as a barrier to profit margins.
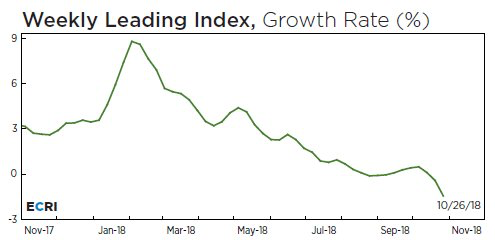
- Lower Leading Growth Rate – the rate of growth has gone negative in the US and is now flat in Canada.
- Higher Transportation Costs – The cost of moving raw materials to factories and then moving finished products to market has skyrocketed. These fixed costs are non-discretionary and can eat up a significant portion of profits when they rise quickly.
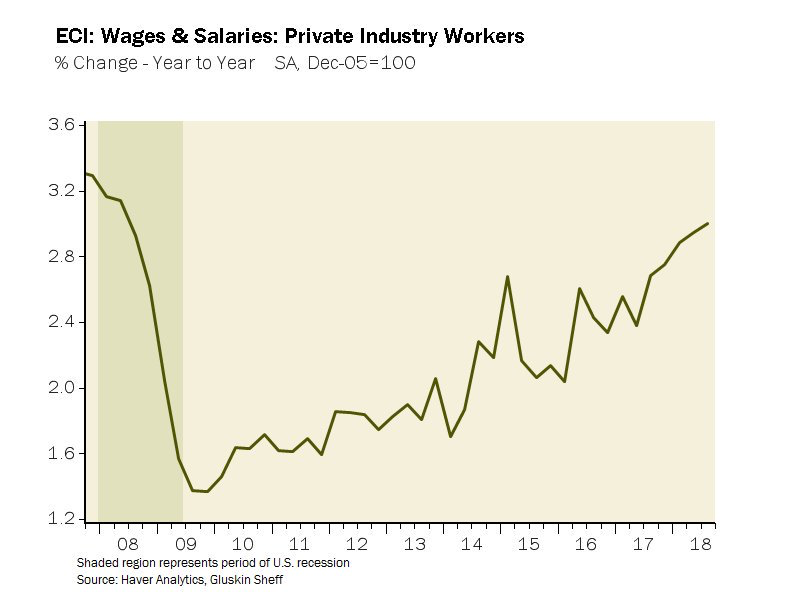
- Wage Increases – Wages are a late-cycle indicator that took “forever” to recover this cycle. The chart below shows US wage inflation before the 2009 downturn and the slow recovery. It is now accelerating to greater rates of wage growth.
Back to the “green box” and the medium term stock market trend.
It would not surprise me if the TSX got back to the green box and proceeded to trade “sideways” in a 1,000 point range for most of 2019. I would be happy to hold on to the high dividend paying ETFs and collect 5.5% while the markets remain range-bound.
I believe that a churning market will see both the US Federal Reserve and the Bank of Canada continue to lift interest rates. This is the key sentence in this outlook.
Why this is important is because how the central banks respond to the next round of economic and stock market weakness dictates whether we follow the “red scenario 1” or the “blue scenario 2” pathway.
For now, the green box recovery is my focus. Let’s see if the TSX can make the “minimum recovery” required before a break below the October lows takes place.
