
Potential Mid-Term Bottom for Stock Markets and a Boost for Gold
It has been a very busy week; volatility has returned to the financial markets.
I really do enjoy my job when it gets like this again.
A quick review of what happened in markets and how these moves impacted our investment models.
Below is a one month chart of the TSX in Canada.
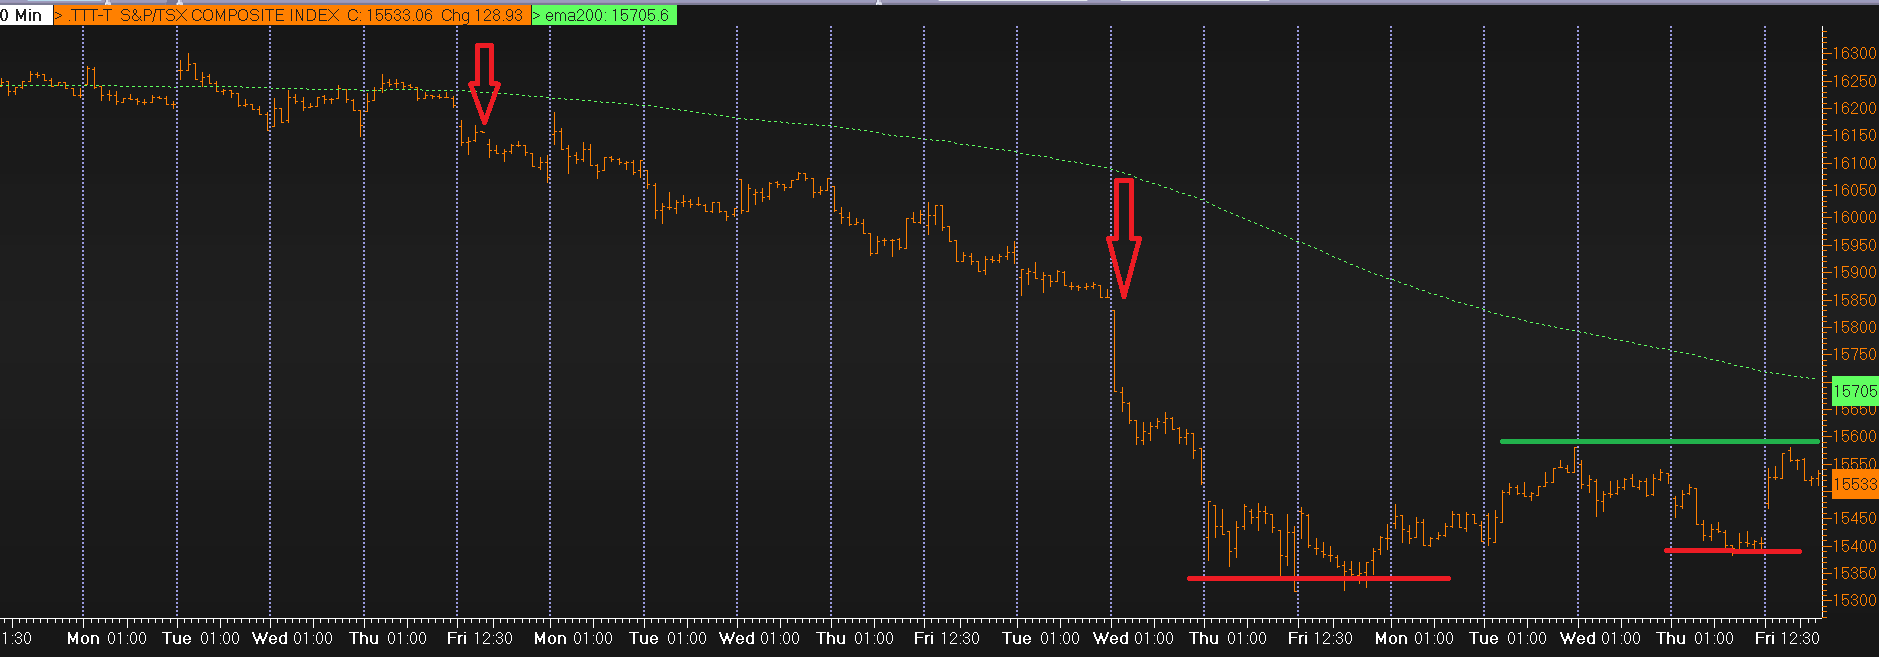
As you can see, the Canadian large company stock index began to decline three weeks ago and took a couple of serious tumbles two weeks ago (red arrows).
The decline stopped on Friday, October 5th, and since then the 15,300 level has acted as a “short-term low” for this correction in price.
Last week saw the TSX attempt a rally that lost momentum on Thursday and worked to recover on Friday.
The “fast TEAM model” traded out of the TSX at 15,880 and went to cash. Based upon the possible mid-term bottom for the TSX, the fast TEAM model has bought back in at the 15,450 TSX level with a stop loss at the 15,000 level.
The fast TEAM is trying to capitalize on the potential for a “double bottom” and recovery in the TSX. Note, it does not give a lot of room for the TSX to fall below the two red lines in the chart above. Closing below the two red lines would invalidate the “double bottom” technical pattern that is possibly forming at present.
The regular TEAM model owned in the bond format has stayed 50% invested in the stock market and 50% in cash throughout this entire period. I will clarify the differences between the “fast TEAM” and regular TEAM in the next weekly comment.
Sometimes people ask me: Why do you bother with managing risk to the downside if you believe that the central banks will come in and rescue the stock markets if things start to suddenly fall?
The quick answer is “what if they don’t come in and rescue the stock markets like I expect?”
Clearly, then I would be glad that I took precautions against a potential stock market decline.
The longer answer includes a marriage of looking at the charts and following the fundamental news.
The charts have been looking “vulnerable to a downturn” since the middle of September. At the same time the central banks have been threatening to “get tough” and raise interest rates.
Even though the economy is still reading strong, these threats were telling us that investors should use caution.
Then, two things happened:
- The stock markets finally started to go lower.
- Investors shifted from the all BULLISH theme to a mixed narrative of “possible downside.”
Ok…what changed last week to make you take a shot at buying a potential mid-term bottom in the TSX and S&P500?
Two things again:
- The charts stopped going lower.
- China blinked after watching its stock market fall over 24% from its peak and eased banking reserve ratios and offered stimulus as required to the financial system.
It doesn’t absolutely mean it will be a bottom, but those two changes make it worth being invested again, controlling the amount of downside that is acceptable, and hoping that the TSX Comp holds above the Friday, October 12th lows.
Bottom line: Adding positions here can net a 5.2% dividend yield paid monthly. If the stock market does bottom, we would hold those positions indefinitely. The model is risking approximately 2% of capital that this bottom holds.
Gold
The above rationale is a perfect segue into my growing BULLISH thesis towards gold and precious metals.
Let’s start with a few facts:
- Gold is absolutely hated by investors and is completely out of favour as an investment sector.
- The rising US dollar has been very hard on many commodities, but extremely painful for gold investors.
- The technical picture (chart formation) for gold is improving, but not yet BULLISH.
The fundamental view of gold will improve dramatically as soon as the central banks signal they are backing away from interest rate increases.
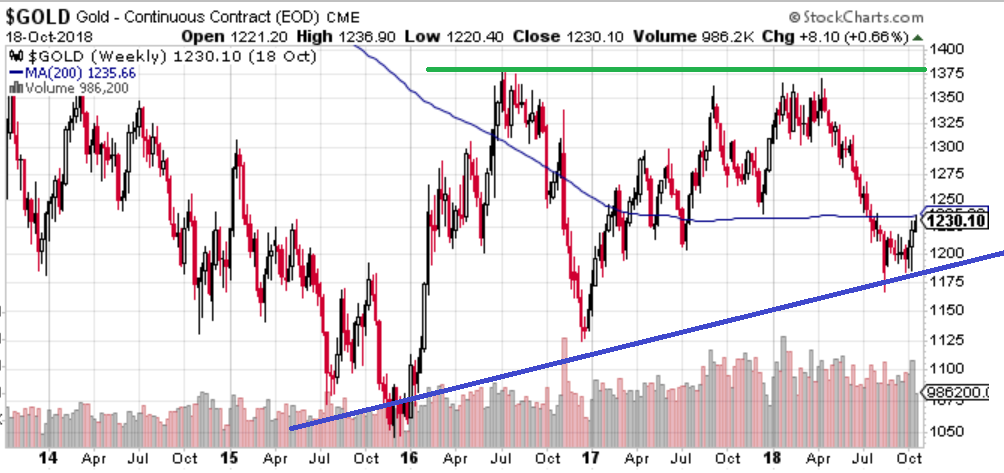
Above is a 5 year, weekly price chart of gold bullion in US dollars. I believe it is important to use US dollars because of the recent strength in the greenback. If gold is really going to enter a BULL market it must appreciate in the strongest fiat currency. By increasing in US dollars, gold will be increasing in all other currencies too.
Let’s keep this simple.
The green line at the top of the chart represents the gold price “breakout” needed to garner real attention from investors, and the blue line at the bottom of the chart is support, which needs to hold to even contemplate a BULLISH scenario for gold.
It has been my position that “when” central banks panic and stop raising interest rates, gold will begin a new BULL market.
I doubt gold will just shoot up in one moment based upon this change.