Stock Buybacks
The parade of stock market BULLS that states the broad prices for company shares cannot fall in the era of stock buybacks is pretty darn long.
While saying shares can’t fall might be a little aggressive, the sheer magnitude of buybacks is staggering.
First, some history about stock buybacks.
Through most of the 20th century, stock buybacks were illegal as they were considered a form of stock market manipulation. In 1982 however, the Securities and Exchange Commission (SEC) passed rule 10b-18 which created a legal process for companies to do stock buybacks.
It is important to consider the timing of this change.
The change in legislation was encouraging companies to do a smart thing with their cash reserves…buy their own cheap shares on the market. Interest rates were nearing their all-time peak at nearly 20% and stocks were severely depressed relative to other asset classes. In other words, this was a generational opportunity to buy quality stocks at dirt-cheap prices. Interestingly enough, the timing also marked the beginning of the greatest BULL market in American stocks EVER.
Once the buyback genie was unleashed, she was never to be put back in the bottle. And as usual with all things financial, what started as a responsible idea has been perverted to the point in the present day that stock buybacks are now regularly used to “influence” the shares of the underlying company.
There is a whole lot more to this story that does not fit into the scope of what I am writing today. Let me add a couple of bullets below for the
Goldman Sachs estimates S&P500 companies will return $1.2 trillion to shareholders via buybacks and dividends in 2018
Buybacks will make up at least $800 billion of this number, up from $530 billion in 2017.
The Trump tax changes magnify the intensity of share buybacks by allowing money from overseas to be repatriated into the US in a tax-friendly manner.
As opposed to the 1982 buybacks, the 2018 stock buybacks are occurring at the second most expensive valuation of US stocks in history.
Nick, this is not a new story…why are you bringing it up today?
Well, thanks for asking.
Please take a look at the following excerpt taken from a “Pensions&Investments Online” article I came across this week:
A group of Democratic senators called Thursday (June 28th) for the Securities and Exchange Commission to hear from the public about reviewing rules covering stock buybacks.
Led by Senate Minority Leader Chuck Schumer of New York and Sens. Chris Van Hollen of Maryland and Tammy Baldwin of Wisconsin, 18 other senators joined in writing to SEC Chairman Jay Clayton, noting that rules have not been updated since 2003.
"Since that time, there have been significant changes in executive compensation practices, shareholder activism and investing technology," they said.
Before the rule was adopted in 1982, New York Stock Exchange-listed companies spent 2% of profits on buybacks; from 2004 to 2014, the largest U.S. companies have spent 51% of profits on buybacks, according to a Brookings Institution study cited in the letter.
"While we are troubled by the magnitude of stock buybacks and the consequences for employees and communities, we are even more disturbed by the dramatic increase in stock sales by corporate insiders following the announcement of a buyback. This ... means it is imperative that the SEC revisit the evolution of Rule 10b-18 to ensure that corporate executives are not using the rule inappropriately to enable advantageous sales of their own stock while ignoring the needs of their companies' workers."
"We shouldn't be surprised that a record wave of buybacks followed the Trump tax bill. And I am deeply concerned that executives are spending more time on short-term stock trading than long-term value creation. That's why I think it's high time the SEC re-examine its outdated buybacks rules, starting with an open comment period."
Let’s see where this story goes in coming weeks and months.
This development would be significant if the changes considered had any legs to run further. If I see anything I will report back in these writings.
A Few Charts
After last week’s editorial and your feedback I had to include the opening “funny” before I start with the charts for the week. “Thanks Doc…I needed that!”
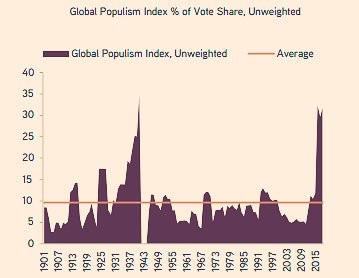
The following chart is “noisy” but I do feel it is interesting given the fact that it peaks right around the optimism of the Trump tax cuts approval.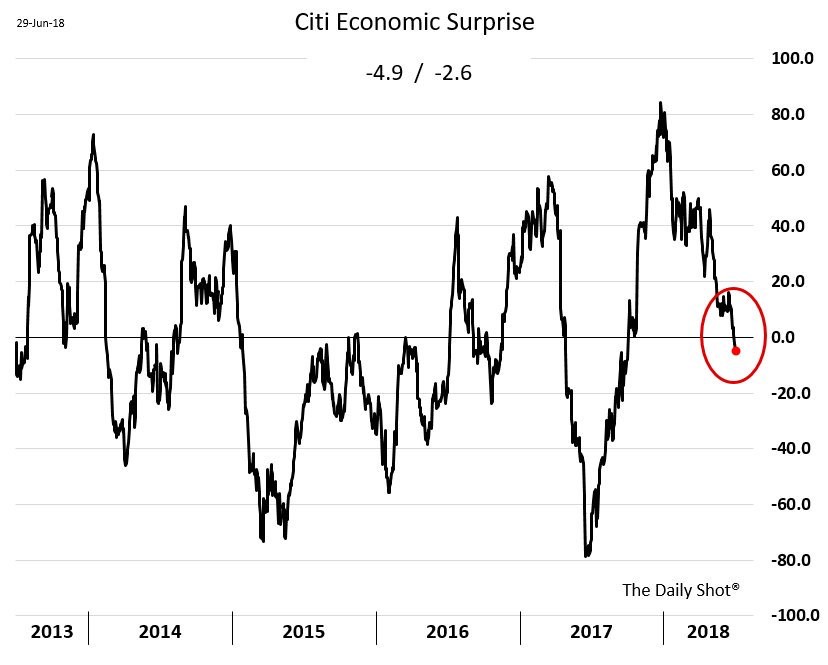
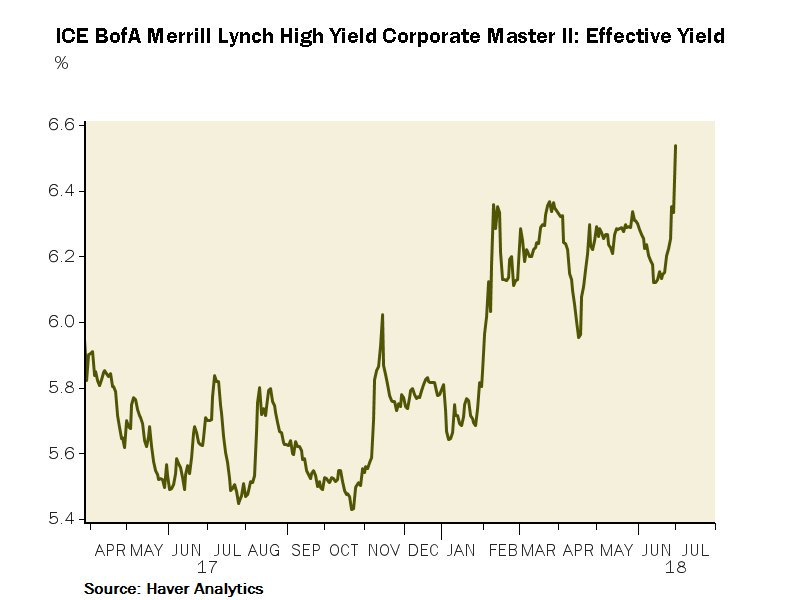
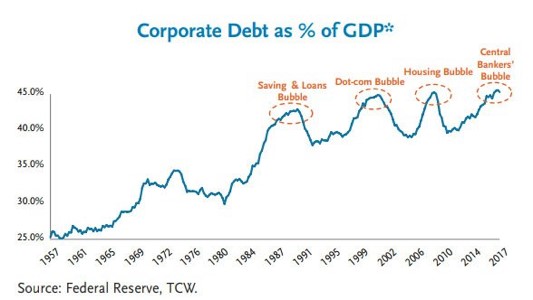
The next two chart show (1) how High Yield (Junk) bonds are falling in price again and (2) how corporate indebtedness is back at all-time highs relative to GDP.
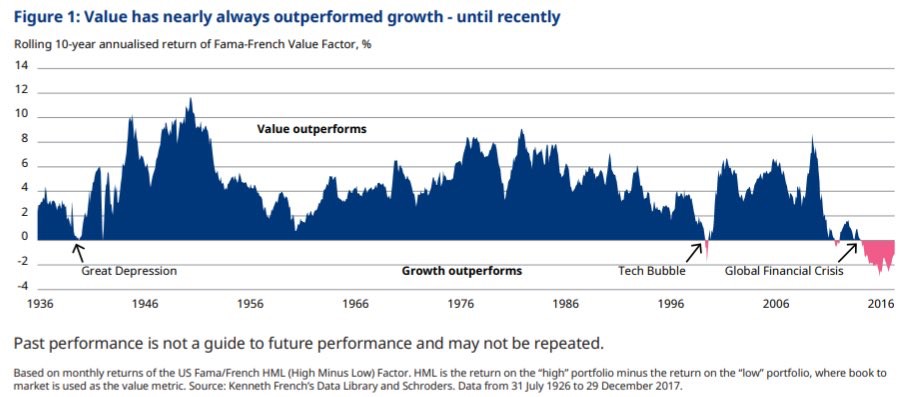
I thought the next long term view at how “value” stocks have performed relative to “growth” stocks was kind of interesting. I wish it had the 1920s included because I believe that was the last time that “growth outperformed value” on a multi-year basis.
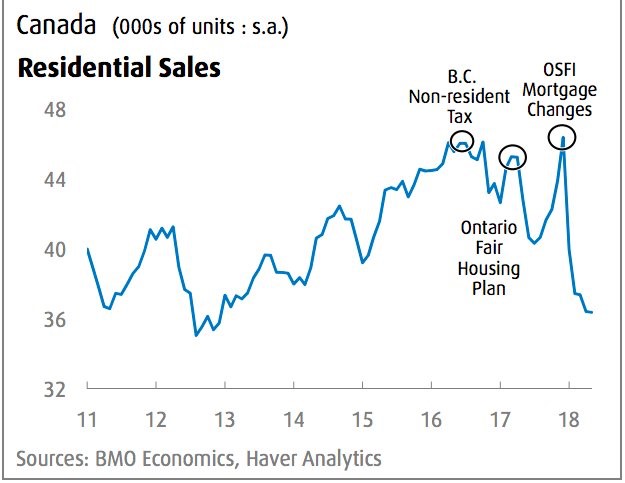
The next two charts have to do with Canadian real estate prices. The data was weak in June on a national basis and for BC but, the good news was, the Toronto market has stabilized and actually started to recover.
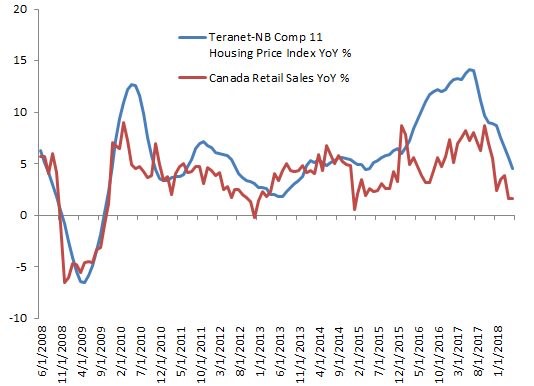
There are a lot of thoughts that come to mind when I look at the next chart. I will let you draw your own conclusions.
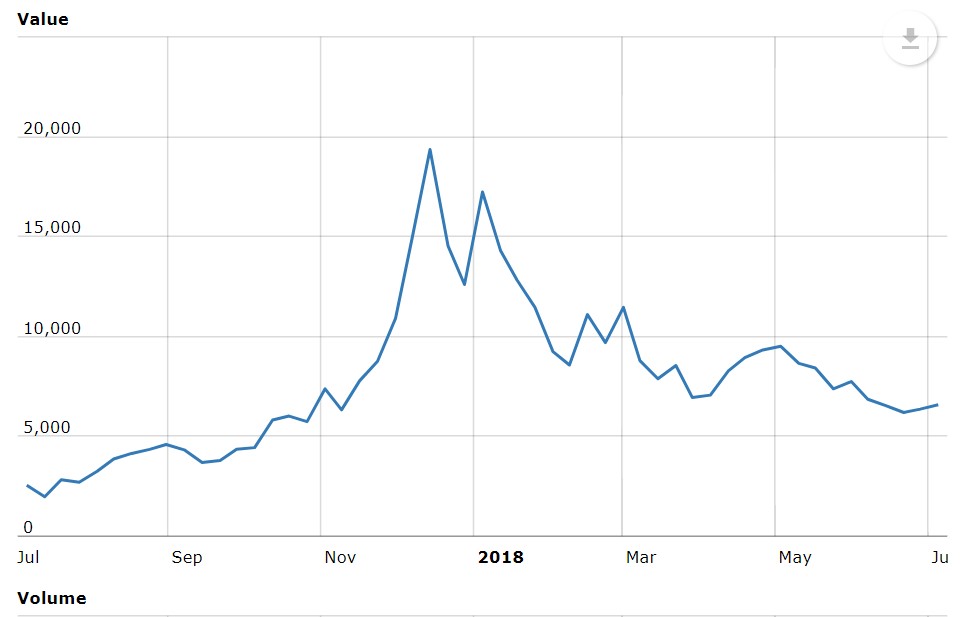
It has been a while since we have looked at a chart of Bitcoin. Honestly, it looks like every other financial bubble I have ever seen in history.
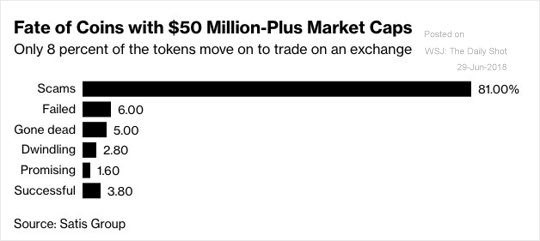
The second chart is a little scary. It shows the fate of the hundreds of “coins” that have a market valuation of less than $50,000,000.00. Seriously, that is a lot of money to just see get annihilated hundreds of times over…wow!
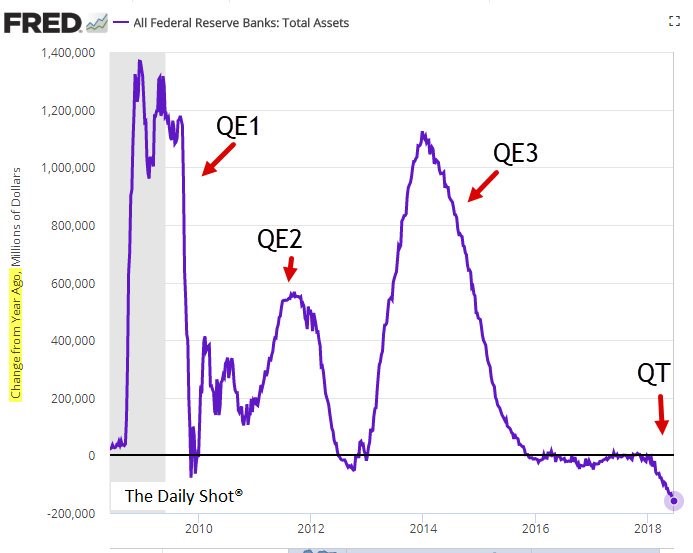
Finally, a picture of how Quantitative Tightening (QT) is now a real thing. This chart only uses the US Fed, but it does make a statement of how things have changed.