
Confirmation Bias
Last week a client sent me the following question and comment:
Hi Nick,
Do you think you have confirmation bias? i.e., finding data that support your beliefs? What about spending a week seeking out contrary tables?
My reply:
- Yes, I have confirmation bias.
- I love the idea of spending a week on BULLISH tables and charts. They are certainly easier to find.
The closing section of this comment will take the BULLISH argument forward with charts.
My confirmation bias is intentional...let me explain fully what I mean.
The basic premise I have believed since the beginning of Quantitative Easing (QE) in 2009, is that central bank money and artificially lowered interest rates were the only reason asset prices around the world were inflating.
Therefore, I believed that once QE was removed, that asset prices would reset to normal economic and monetary conditions.
What I never believed was that the global central banks would continue to artificially stimulate for 10 years!
This basic premise has left focusing on two objectives to manage money:
- Divide portfolios into three distinct categories instead of the traditional two categories. Fixed Income, buy and hold equity and also “tactical equity.”
- Looking for clues that the global financial experiment of QE was either failing, or running its course and coming to a close.
In hindsight, trying to manage money with a view to an end to QE has been an incredibly frustrating process.
There have been so many verbal attempts by the central bankers to sound like they are ready to quit QE, only to see them panic at the first sign of asset price weakness and ramp up the manipulation to every more insane levels.
Looking forward, I see that QE on a global basis is finally net shrinking. The red line on the chart below shows that QE peaked in April 2018 at nearly $21 trillion and has declined to just under $20 trillion. (A hat tip to Chris Carolan – spiralcalendar.com)

The chart above superimposes the image of the S&P 500 as well and it is clear that stocks have struggled in the US since QE has peaked.
But this is not the end of the story…not by a long shot.
My expectation is for the continued unwinding of QE to create more struggles for stocks over the next three to six months.
At some point during these struggles, however, the global central banks will pull out the only playbook they know and announce another round of global QE.
My expectation is for stocks to rally violently on the news. My goal is to add to “tactical equity” exposure at this time.
Once exposed to this rally, my thought would be to ride it higher until it rises no further.
That’s as simple as I can lay out what I am thinking.
Remember, if the US Fed can stay on the same trajectory of paying down their $4 trillion balance sheet, the rate of Quantitative Tightening (QT) is going to accelerate each quarter.
We need to stay vigilant and push complacency aside. I will do my best to keep you up to speed in these notes.
BULLISH
**The following segment is my summation of the base BULL case for higher stock prices**
The US profit model has changed for years to come based upon Donald Trump’s tax cuts and the ability for US corporations to earn significantly larger profits on slowing rising revenues.
With US unemployment at generational lows, the concept that “everybody who wants a job has a job” can logically be inferred.
The first paragraph from our RBC Global Asset Markets committee summer 2018 publication reads as follows:
“Solid Economic Growth in Sight: The global economy is being buoyed by a variety of tailwinds. The most prominent is fiscal stimulus which, while mostly a US story, could extend to other developed regions such as the UK, Japan, and Germany over the next few years. Supporting our above consensus view on developed-market optimism among business and consumers, the diminishing drag of the financial crisis and a boost from many years of ultra-low interest rates. In emerging markets we expect growth to be a bit below consensus but double that of the developed world. Our forecast is for the global economy to expand by 4% in both 2018 and 2019, which would be the fastest since 2010."
Where we are in the business cycle gives us confidence that there is still time for solid returns from stock markets.
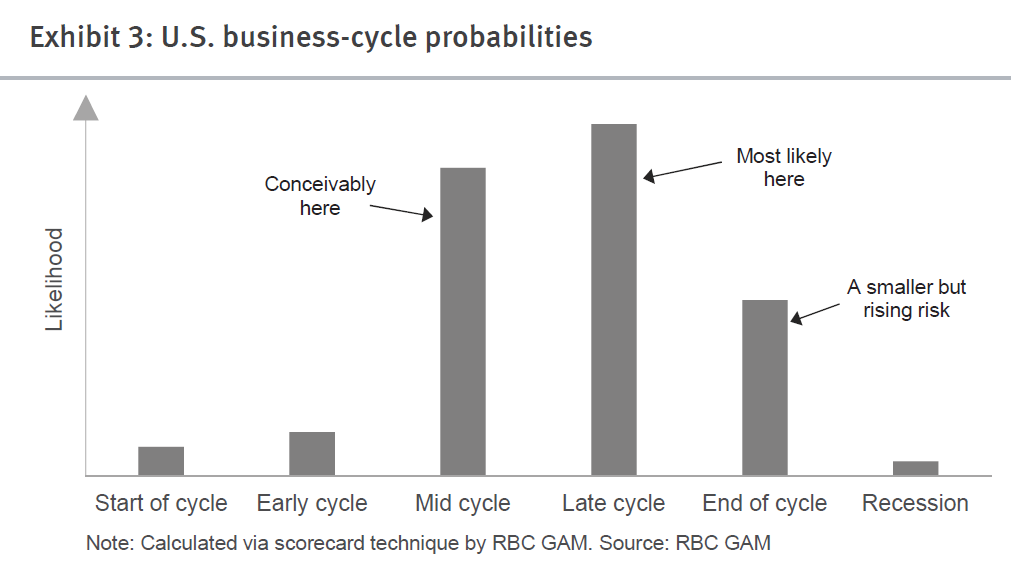
Again RBC GAM estimates we are most likely “late cycle” in the chart above.
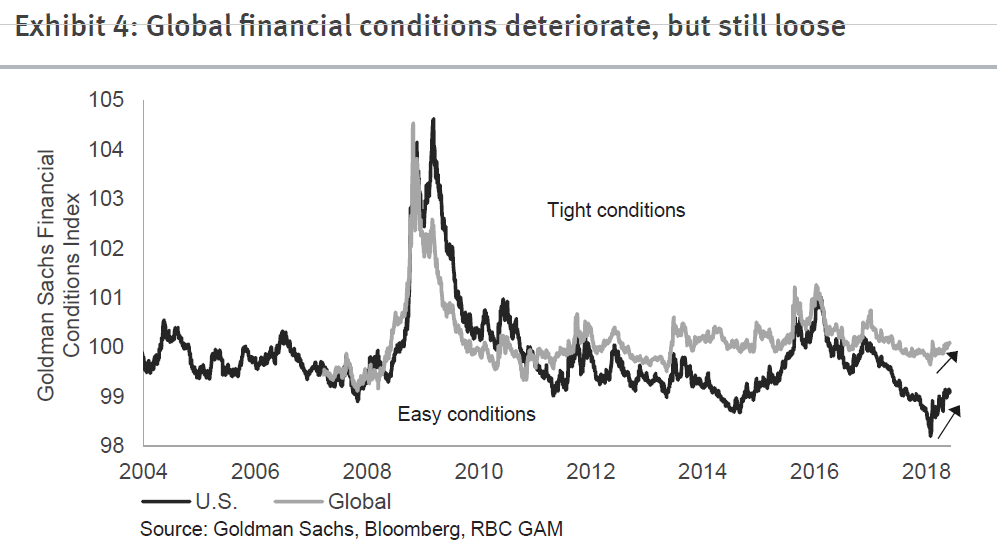
The following chart makes the same case by showing that financial conditions, even though they are “tightening” some, are still very conducive to further gains in stock prices.
The main reason the BULLISH case remains intact is based upon the Trump tax cuts. The chart below outlines how the tax cuts are forecast to impact American GDP growth of the next 5 years.
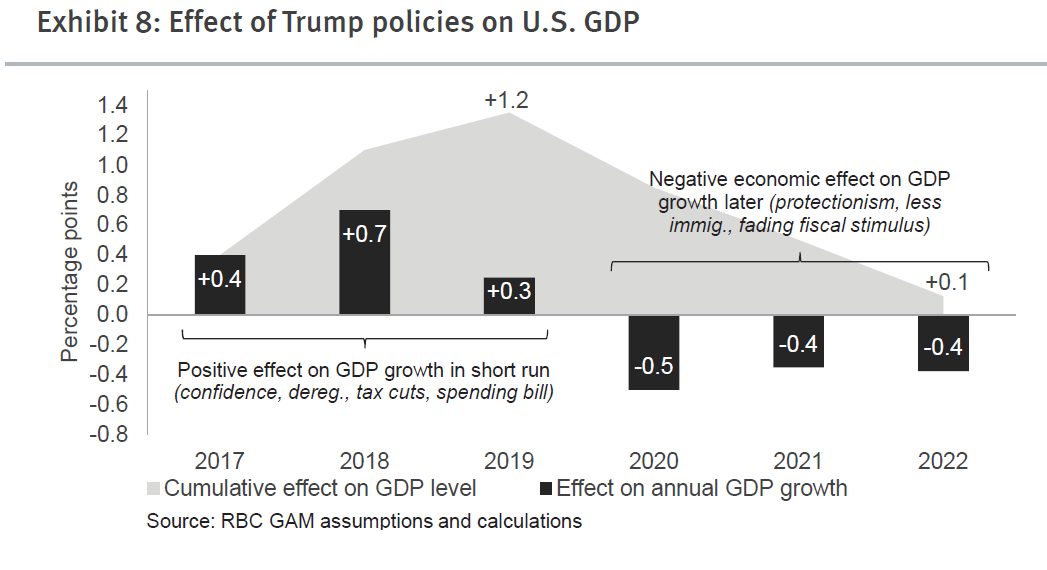
So putting this together, the BULLISH case appears to be solid out past 2019.
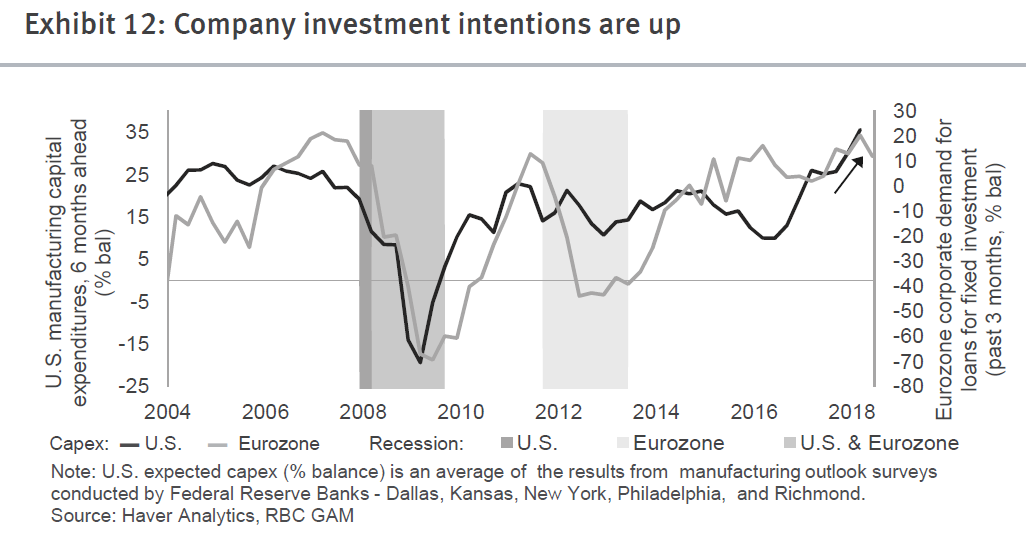
Both consumers and corporations are confident about the future and are still willing to spend money.
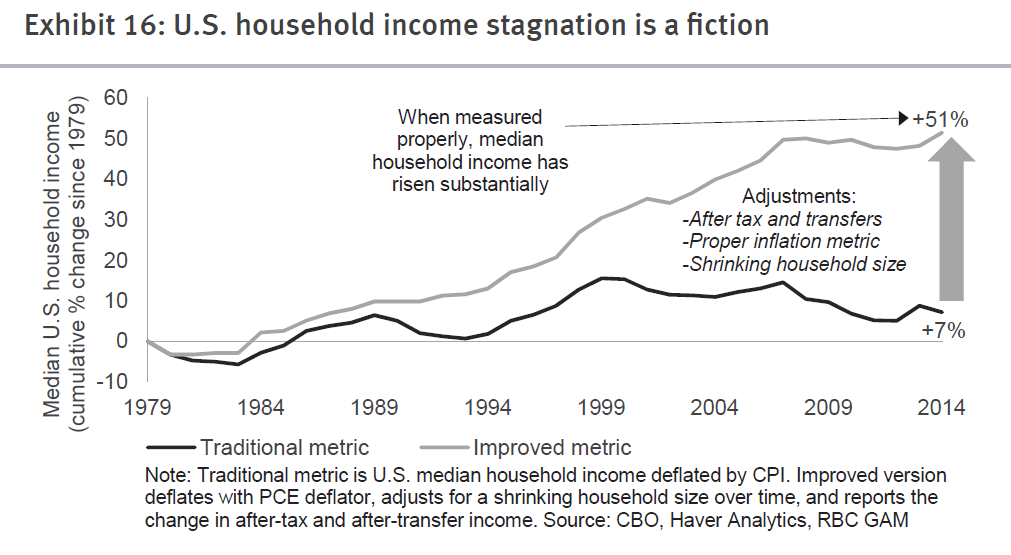
Also, the BEARS have it wrong when it comes to measuring incomes in the US; the old methods of measuring income are outdated.
If adjusted for new technologies and productivity enhancements consumer incomes look like this:
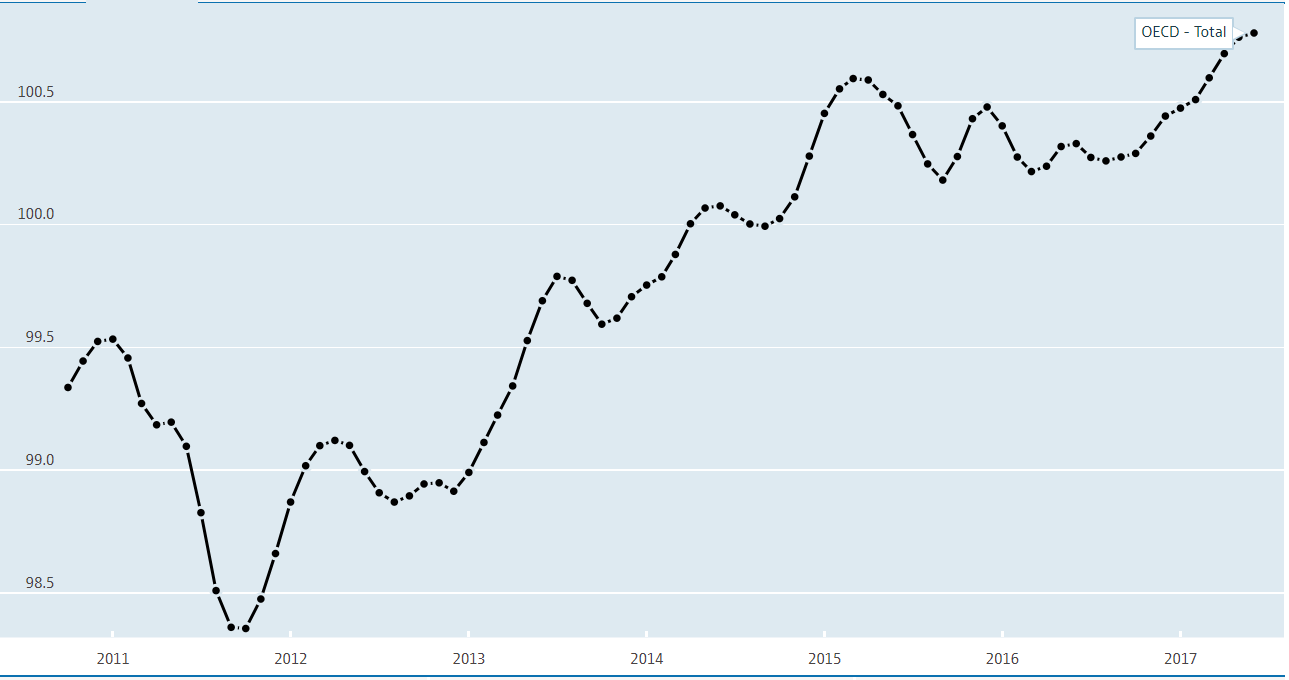
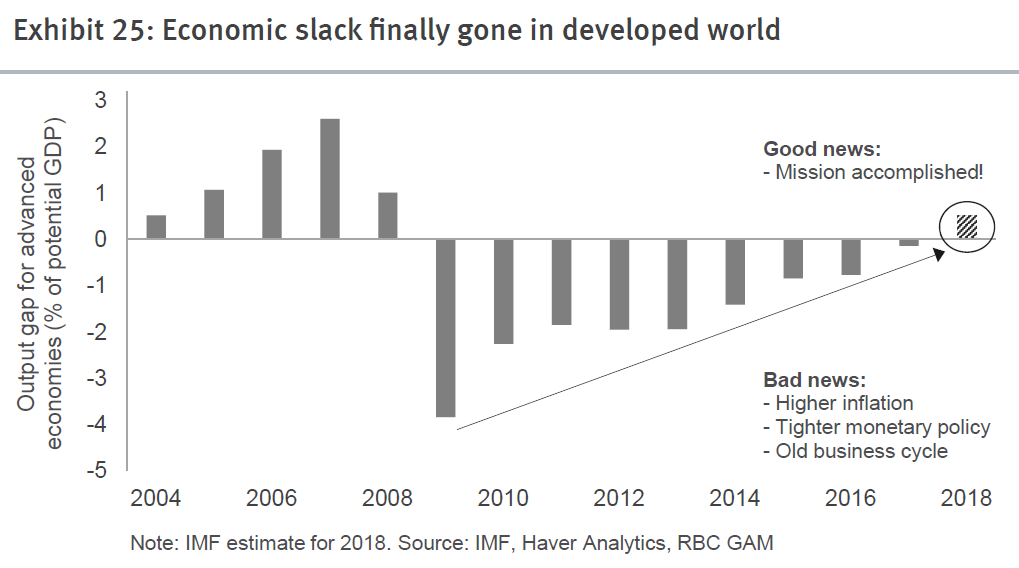
No wonder why there is no economic slack left in the developed world. Strong income makes for strong consumers.
In summary, the reasons to stay BULLISH even though the economic cycle is getting long in the tooth are presented above.
My BULLISH case summarization for the entire global macro is fairly represented in the following graphic:

Even though there are a number of risks that “could” shorten our late cycle forecast to end of cycle, we believe investors should stay BULLISH on stocks for the present time.
Tying the Two Views Together
Hopefully, you don’t think I have developed an acute case of Multiple Personalities Disorder after reading the two editorial sections above. In my mind, the two positions co-exist quite nicely.
Think of it this way.
I completely believe the economic cycle point is “late cycle” as stated in the BULLISH section of the weekly. But I believe the tightening monetary conditions and the higher interest rates could hasten the end of the cycle faster than the predictions in the BULLISH section wishes to admit.
Hence, my focus on looking for turning points in the data.
As for all of the BEARISH data that I usually present on a weekly basis, you probably notice I have to go out and hunt many different sources to acquire it. To gather the BULLISH case, all I need to do is open the last report issued by RBC GAM.
In other words, the BULL case is consensus and easy to gather. The seeds of change must be carefully watched for and hunted down.
If you spend any time keeping up with financial markets you are very familiar with the BULL case to staying invested in stocks and real estate. It is presented ad nauseam each day.
My goal is to present the other side of the argument to you so you stay vigilant and don’t grow complacent.
Your comments are welcome.