
A slice off Apple (AAPL-US)
I love Apple iPhones, Apple is still a good company, and the changes Apple brought to our world are incredible.
But…Apple is not the innovator it once was.
Android products have eclipsed Apple in terms of innovation and Apple is often the “copycat” now. This is because Android is open source and everybody improves the product with innovation and then the next issue Android incorporates all the sources of innovation since the last issue.
That said, I still love my Apple products because I am so familiar with them.
Now to the point of this rant: The quarterly earnings report for Apple last week was offensive to me.
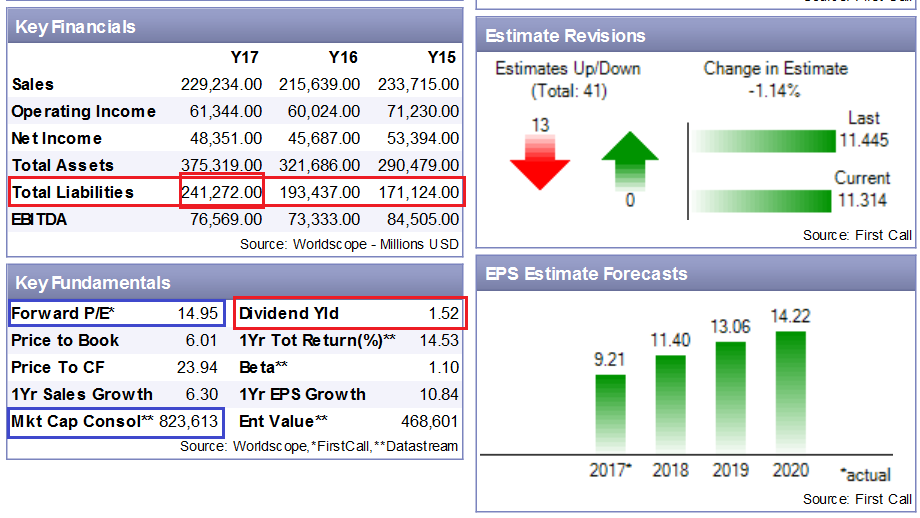
Apple announced a 16% dividend increase and $100 billion in stock buybacks for the next year, adding to the $21.2 billion buyback in the first quarter of 2018. To put this $100 billion stock buyback into perspective, that equals 1/3 the value of Johnson and Johnson, or nearly the entire value of the Royal Bank of Canada.
There has been a narrative attached to the Apple buybacks in the past that made some sense. When Apple could borrow money for less than 1% and buy back stock that paid a 2.5% dividend there was a sensible advantage to doing the buybacks.
Now Apple borrows at nearly 3% to buy back stock that pays 1.55% — not really a smart move for the long term.
If you look at the Apple Key Financials in the graphic below you can see a $241 billion Total Liabilities line outlined in red. As that debt rolls over it is going to be reset at significantly higher interest rates. Why wouldn’t Apple pay down its debt instead of doing share buybacks?
I think you can guess the reason…to push the stock price higher in the short term.
Memo to Apple: I love your company. I have loved your products, but you have fallen behind in terms of innovation and you are financially engineering your company against the long term benefit of shareholders. Smarten up!!!
David Rosenberg on US Monetary Policy
When Jerome Powell took over from Janet Yellen as US Federal Reserve Chairperson it was not totally clear if he was going to be different from his predecessors.
Alan Greenspan, Ben Bernanke and Janet Yellen were different embodiments of exactly the same persona. Those three names controlled the reigns of US monetary policy from 1987 to January of 2018. In a nutshell, those three central bankers always took the easy money path to cut interest rates and print money as the solution to every financial hiccup faced.
That is more than 30 years of easy money policy. During the same time period, Japan has lived on an easy money policy and since the “great recession” in 2009, Europe has taken the easy money policy to a whole new level of insanity. That is a lot of easy money.
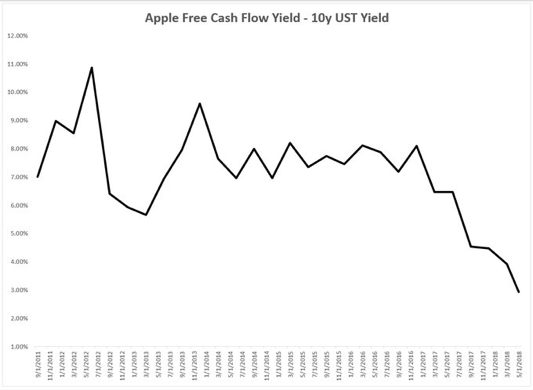
My first impression of Jerome Powell was he was going to be the same type of central banker, but now I am not so sure. Check out the chart below to see how the Powell Fed has stopped printing money and is now actually draining the $4 trillion QE swamp of money.

Hey, it is not much but it shows the Fed Chair Powell is serious about what he is doing!
Let’s look at what else Jerome Powell has said and DONE during his first few months as Fed Chair.
- Continued to raise interest rates
- Raised the Fed’s inflation expectation (now 2%)
- Raised US Growth forecast (now 4%)
- Raised the perceived neutral rate of interest from 2.5% to 3%
All of these changes tell me Jerome Powell is not cut from the same cloth as his three predecessors. He may be forced to go back to the same playbook, but it will likely take more pain in markets to force his hand than it did Greenspan, et al.
So now the key is what is actually going on with the global economy? Is Jerome Powell going to end up “tightening monetary policy” into a weakening global outlook?
The next section of the comment looks at “structural weakness” in the global economy. What that means is the massive pools of debt have now created a lower optimized growth rate in the world.
If this is true we may find “stagflation” becomes a difficult condition to remedy in coming years.
G7 Growth Continues to Cool (Excerpt from ECRI talk in April 2018)
Growth…
Every investor searches for it. Economies require it to survive. Governments depend upon it to keep tax rates in check. Growth is the holy grail of capitalism.
But is there always going to be growth somewhere in the world? Is growth really something that has to exist at all times?
Lately, I have been pondering these questions.
As necessary as growth is to the functioning of capital markets and economies I don’t believe it has to exist at all times. There can be times of global stagnation. I also believe it is easier to have a time of global stagnation now that the world is so much more interdependent than it was 100 years ago.
With those thoughts in mind, consider the chart below. It shows the long term trajectory for “productivity and labour force growth” in the G7 nations.
The starting point for each nation is the average for the 1957 to 2007 time frame. The second dot or end point is the productivity and labour force growth for the previous six years.
Notice how all the rates of growth are converging around the 1% level.
A key aspect of the chart has to do with the slanting brown lines. The horizontal and vertical coordinates add up to 1% for every point on the slanting 1% line -- similarly for the 0% line, and so on. The black arrows are slicing through the brown lines at near right angles which shows the slowing pace is brisk.
Every G7 country is heading in the wrong direction, with potential GDP growth converging toward the 0% - 1.0% range.
Finally, the red “X” shows Japan's lost decades from 1992, when its bubble burst and recession began to the eve of the financial crisis.
These are long term trends. None of what you are looking at is going to have a meaningful impact on your investment portfolio in the next year, but it does beg the question: Where does the growth come from? Asia? India? Somewhere else?
Let’s add one more variable into the equation. DEBT.
Debt is a constant whether we are talking about the G7, China, India, or personal finances. Debt suppresses growth.
Debt levels continue to escalate out of control. Debt is now a structural part of global finance and there is no credible plan to reduce in any meaningful manner.
Summary:
Governments, companies and individuals can be a lot more creative with their finances when interest rates are low. The past 10 years have seen the lowest interest rates in the history of our planet; it has truly been a unique period of time to be an investor.
Debt has been treated as a harmless tool to be used to fulfill all your lifelong dreams at any moment one chooses. This is not how debt has been viewed throughout the great majority of history.
The past 10 years have been characterized by low interest rates, low inflation, and high asset prices. It seems we are transitioning into a higher interest rate, higher inflation, and moderating asset price world.
And now we have a Fed that appears to be serious about rebalancing the financial world regardless of what markets do…
What really stood out to me this weekend is how long this period of financial insanity has felt from my career perspective but how short it has actually been in terms of human history.
I have been working in the financial industry for more than 30 years and that entire period has been manipulated by central bankers via lower interest rates and printed liquidity. But 30 years is nothing in terms of financial history!
Transitional moments don’t happen overnight but they are relatively sudden on a long term chart, are we at one of those points in time?
Maybe?