
Another Important Week Coming For Global Stock Prices
Since the market bottom almost exactly 9 years ago stock investors have faced many “burst-type” corrections. In the early years of the rally they had specific causes. The largest scare was the European crisis that threatened the default on the sovereign debt of what was coined at the time the PIIGS nations (Portugal, Italy, Ireland, Greece and Spain).
This crisis unleashed global Quantitative Easing (QE) and Negative Interest Rate Policy (NIRP). In countries where these policies were implemented asset markets around the world never really looked in the rearview mirror and powered forward.
In Canada, our real estate markets took the hint, but our stock market was significantly more sluggish than other global markets.
As 2018 began, the end of QE and NIRP was clearly in sight. The new genie in the bottle to keep asset markets marching higher was US tax reform. January 2018 was a record month for stocks prices around the world.
And then February came and a lot of things started to look different.
Inflation fears, a US trade war with the world, a US military war with North Korea, political scandals and questions about how social media is destroying our lifestyles..that at least gets the list started.
Here is what I want to clearly say about the above narrative: None of what has been notice in the past eight weeks is new information; each problem has been in place for at least a couple of years. The change is that investors are starting to notice these problems and act accordingly.
A few weeks ago I cited the Maynard Keynes psychology experiment of selecting the expected winner of a beauty contest from a series of 20 photographs. The winning strategy would be not to select who you believe to be the potential winner but who you believe everybody else looking at the photographs believe will be to ultimate winner.
Often, there is a huge difference between the two. Which brings me to the beginning of this weekly comment.
The past seven days were tough for stock markets.
After a good start to the week on Monday, stock prices quickly fell to important tactical levels for our TEAM models.
The comment this week will focus on the Canadian stock market. I will add a single S&P500 chart at the end to show the US market is in an equally interesting position.
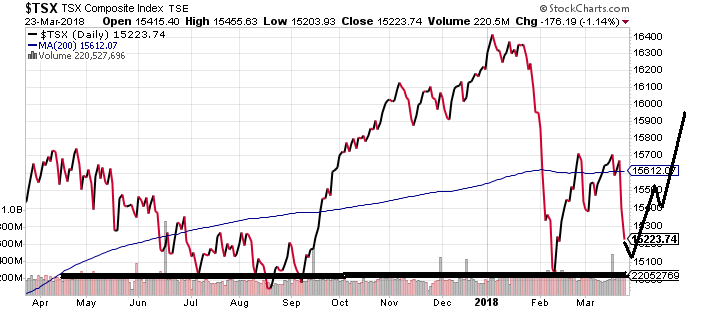
Below is the chart of the TSX Comp Index in Canada.

The chart shows a significant correction in stock prices that occurred in February and then a recovery that is potentially still intact.
From a tactical perspective it is important for the TSX to hold around the level it closed at on Friday March 21st, without giving up the 15,000 level.
The diagram below shows a simplified version of the chart above. In a nutshell, it pays to be very careful if the trend line breaks down below the solid black line because it opens up new downside targets for trading models.
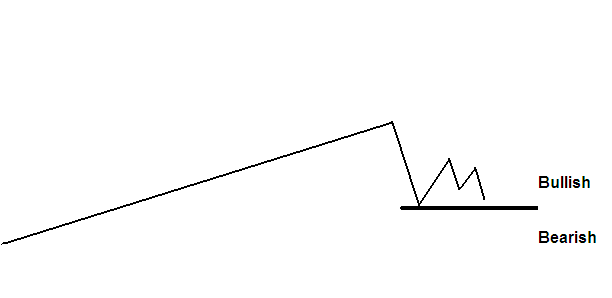
There is an expression used in the “computer age” of stock market investing: Buyers live higher and sellers live lower.
What this is telling us is that computer trading models that use “momentum” strategies are programed to buy increasing prices patterns and to sell falling price patterns. A break down to new, multi-month lows would be a signal to these programs to keep selling.
Now let’s look at one more Canadian chart to see a longer term view of the TSX Comp.
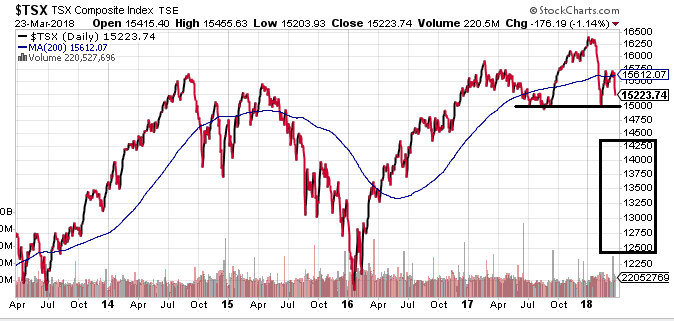
Simply stated, a move below 15,000 opens up pricing for the TSX Comp down in the 14,250 range and maybe as low as 12,500.
Canadian Market Summary:
The most hopeful and likely pattern for the TSX Comp is a “retest of the 15,000 level or slightly below, and then a move back into the 15,500 to 16,500 range.
Our Dividend TEAM model will trade this pattern defensively which means it will sell into a move that breaks the black trend line drawn on the chart above. If the TSX climbs back above the 15,200 level it will repurchase those positions.
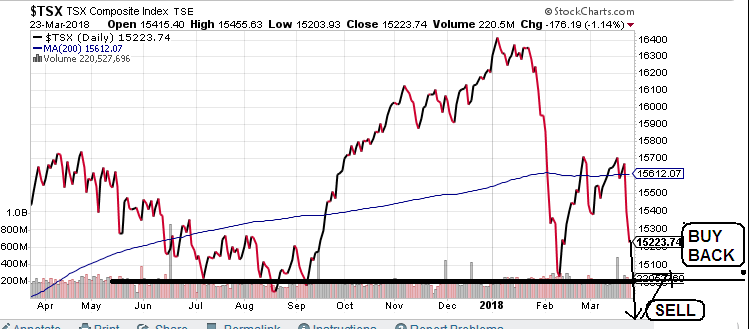
If the retest is not successful, then the exchange traded fund portion of the Dividend TEAM model will remain in cash.
Again, I “believe” this correction is only a retest of the February lows and not the start of a BEAR market.
When I wrote this section I was reminded of the story that was meant to define the difference between “believe” and “trust”.
There was a tightrope walker that used a wheelbarrow to balance himself crossing Niagara Falls. People were standing on both sides of the river watching the spectacle as the tightrope walker completed his dangerous walk across the gorge.
Arriving on the other side, the man said to the crowd, “Do you “believe” I can do it again”?
The crowd cheered and encouraged him to go back across to the other side.
The tightrope walker looked at a young man in the front row that was cheering vigorously and said, “OK, jump in the wheelbarrow and come with me”.
When I look at the TSX Comp I “believe” it will bounce as it has for the past 9 years each time it has gotten into a difficult technical position. But I am not willing to jump in the wheelbarrow based upon that belief.
The S&P 500 Market
Just one graph to show the US S&P 500 is under technical attack at the present time as well.
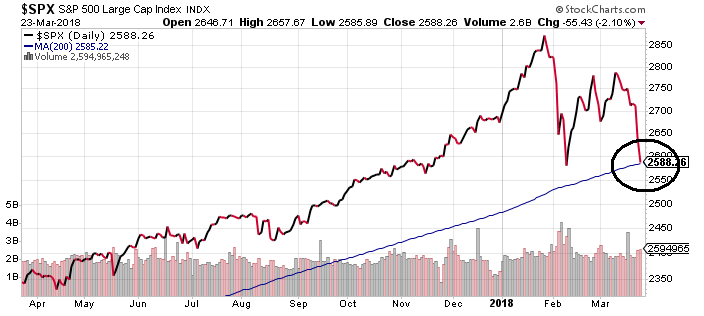
The US market is right on its 200 day moving average. It has not been there all year. Again, this chart has bounced from this area EVERY time it has been here for the past 5 years.
We will watch carefully with the tightrope walker in mind…