
More about Lower Interest Rates
Thanks for the feedback last week on the section about interest rates around the world.
The comments came in two general areas:
- How can there even be a negative interest rate?
- What can I do now to shield my income portfolio against the possibility of a zero percent interest rate in Canada?
First, a graphic showing all the countries around the world that have negative interest rates and how far the negative interest rates out on the yield curve extend.
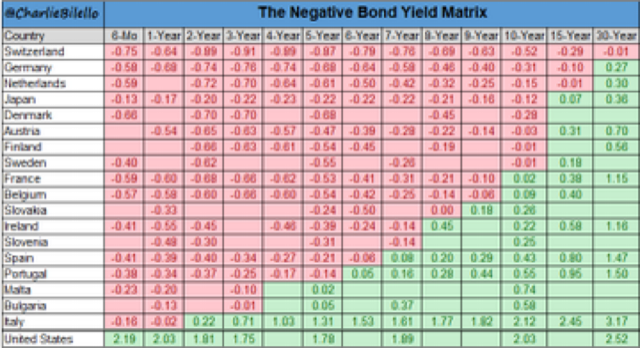
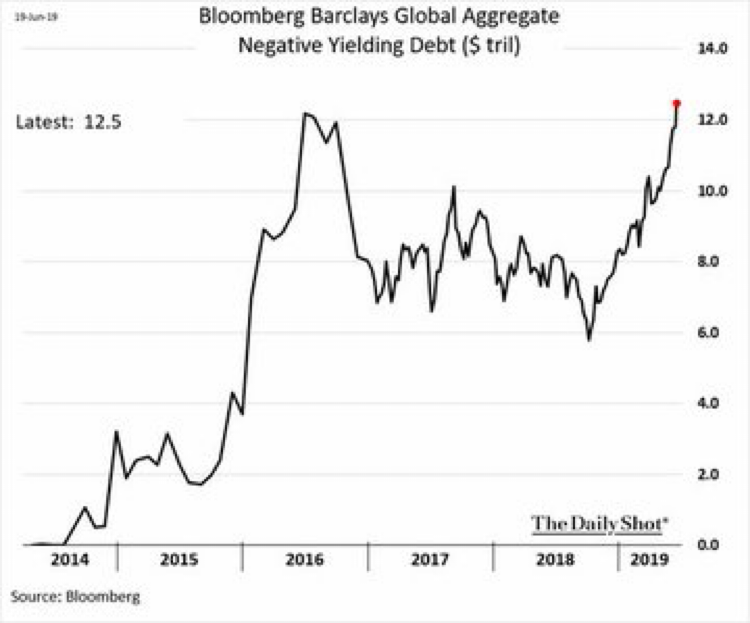
The second graphic shows the “new high” total value of negatively yielding bonds represented in the graphic above as of June 19th.
So back to question 1. How do bonds even get a negative interest rate?
Simply, it is impossible to have a negative interest rate without central bank intervention.
Here is why?
What self-interested buyer would choose to lend money to someone and pay them to hold the money?
Nobody.
Only a buyer with the secondary motives of nudging investors toward asset price inflation and trying to stimulate economic activity would choose to buy an investment that is guaranteed to lose money if held to maturity.
And now, ten years after the start of Quantitative Easing (QE), the world understands that asset prices were definitely inflated, but the global economy never really got the same memo and economic growth was average at best.
The second question, what you can do to prepare for the possibility of extremely low or negative interest rates in Canada, is the more interesting avenue to explore.
Before we start examining this idea, let me lay out a possible future investment set of conditions:
Present Day Possible Future Day
Canada 90 day T-bill 1.6% 0.05%
Canada 5 year bond 1.32% 0.30%
Canada 10 year bond 1.42% 0.55%
1 year GIC 2.15% 0.40%
5 year GIC 2.40$ 0.65%
Average Nanaimo Home $580,000 $625,000
TSX stock index 16,500 18,000
Minimum Wage $13.85 $15.00
Liter of Gas $1.44 $2.05
Basket of basic grocery $37.35 $44.50
Here is a question for you to consider given the “possible future day” scenario above:
Would you roll over a GIC or bond if the best interest rate you could get was 0.40% for 1 year and 0.65% for 5 years?
Notice in the assumptions that nothing got any cheaper around you to buy in other asset classes. Houses are more expensive, stocks are more expensive and your cost of living has continued to go up.
The point of looking at these assumptions is that the time to plan for this possibility is now…not when you are looking at your GIC maturity in the future and interest rates have fallen.
Why might interest rates fall so low?
The most commonly talked about reason is that sluggish growth coupled with huge levels of indebtedness would force central bankers to keep lowering interest rates to maintain present asset prices.
But there is another factor that could hasten the move to zero interest rates: Muted inflation expectations.
In real life, this simply means people and businesses slow down spending because there is no worry about the price getting more expensive if they don’t spend now.
The chart below shows “inflation expectations” in Europe where this has already taken place!
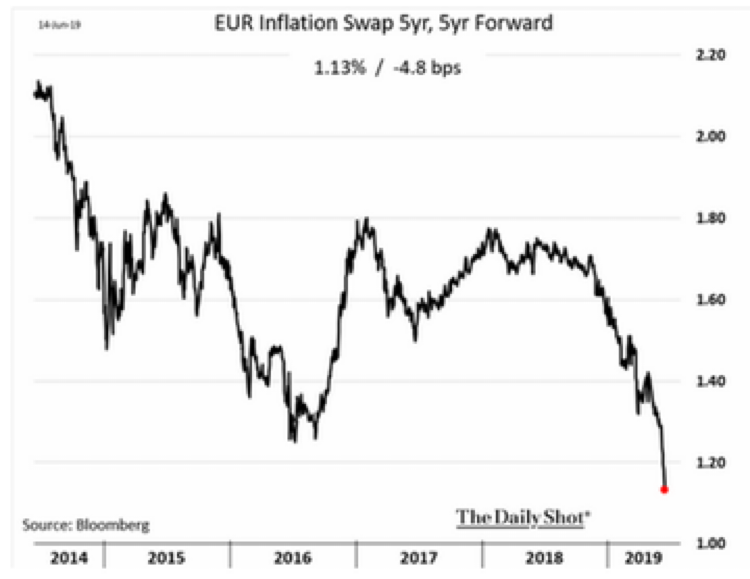
As hard as it is to understand, the farther that interest rates fall the more inflation expectations fall to extrapolate the trend.
Strategically, we have been working on four different portfolio asset mixes that attempt to defend against a world where interest rates head towards zero.
It is my pleasure to share these with you but I only do that in person so it can be personalized to your goals and objectives AND risk tolerances.
Without giving anything away, gold exposure would be expected to do well in such an environment.
Update on Gold
Best to start with a visual aid before discussing gold.
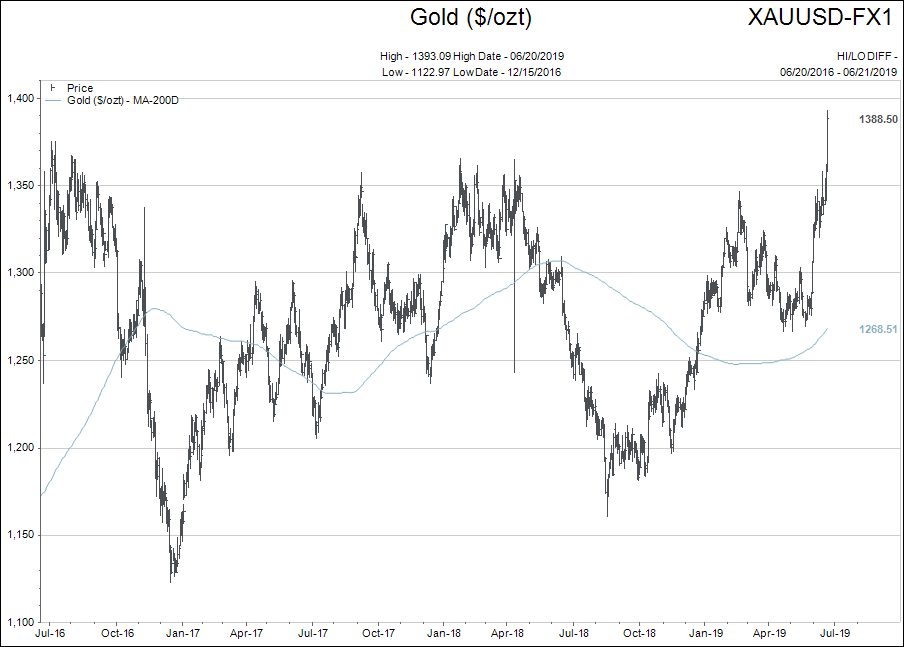
It shows the US dollar price of gold bullion for the past 3 years. It appears it is “decision time for the gold bulls.”
But let’s look past the price. Why would the yellow metal of ancient kings be more valuable in coming weeks and months given the scenario of lower global interest rates shown above?
It is not my habit to look at asset prices in a vacuum. I prefer to view them as a “collage” of relationships.
Consider the following macro-economic view.
If American interest rates are going to trend lower what would be our expectation for other asset classes?
- Flat/lower US dollar index
- Higher Oil
- Higher Gold
- Slower real growth.
Each day I like to look at the “flow” of these correlations. The frequency of days where these relationships “flow” in the anticipated order is noted.
As the frequency of “flow” days rises, the more confident I become in my macro view.
If…and I mean if commodity/gold prices are staging a recovery to a cyclical BULL market phase, then most investor portfolios are massively underweight these investments.
It only makes sense, commodity/gold investments have done nothing for a long time in terms of price gains.
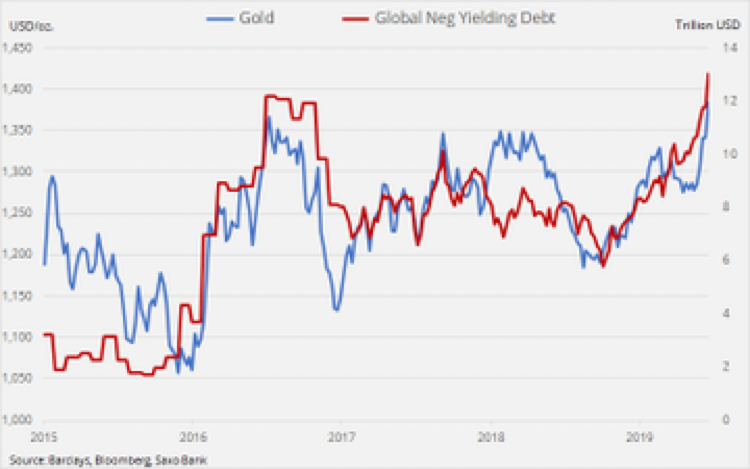
Using gold as a proxy, look how the more negative yielding debt that is created around the world positively correlates with stronger gold prices.
If you believe interest rates are firmly in the control of central banks and they will do whatever it takes to keep growth alive around the world, then gold and commodities look cheap.
Two things to remember in commodity BULLS:
- They rise in price very rapidly
- They collapse in price very rapidly.
It is early in the cycle. Don’t get overly excited and ramp up your commodity exposure all at once.
But it is time to nibble. The commodity based index have shifted positively enough to dip your toe in the water.
Here is One to Think About
There is a lot to chew on in the graphic below.
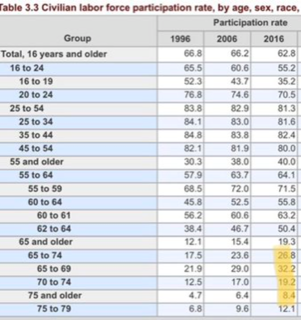
The title says by “age, sex, and race,” but all I wanted to focus on is how the labour force at the youngest oldest end of the scale has shifted in the last 20 years.