
Consolidation Breakout or Head and Shoulders Top?
The first section of this week’s editorial is taken from my weekly comment published April 6th, and tells what I was looking for out until the end of May.
From Nick’s April 6th:
The double-bottom base held and the stock markets recovered ground through Thursday of last week.
The most encouraging part of this chart formation is that it significantly lowers the probability of a “crash” in stock prices.
It is also important to see that it in no way signals “all clear” for the stock markets either.
What I am now watching for is to see if the stock market will create double-bottom breakout to the upside or form a right shoulder to a head and shoulders BULL market top?
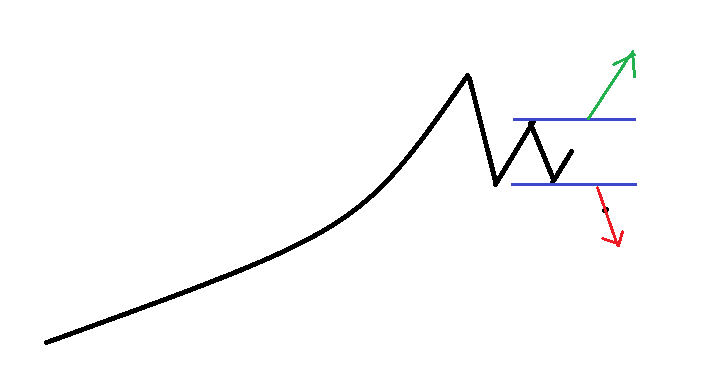
The diagram above shows what either of these two outcomes would look like. The double-bottom breakout would follow the green arrow higher and the head and shoulders BULL market top would end up tracing out the red arrow lower.
The gap between the two lines in blue is basically the war zone for the BULLS and BEARS to fight this battle out within.
Let’s take a look at both the Canadian and US stock markets in light of this chart pattern.
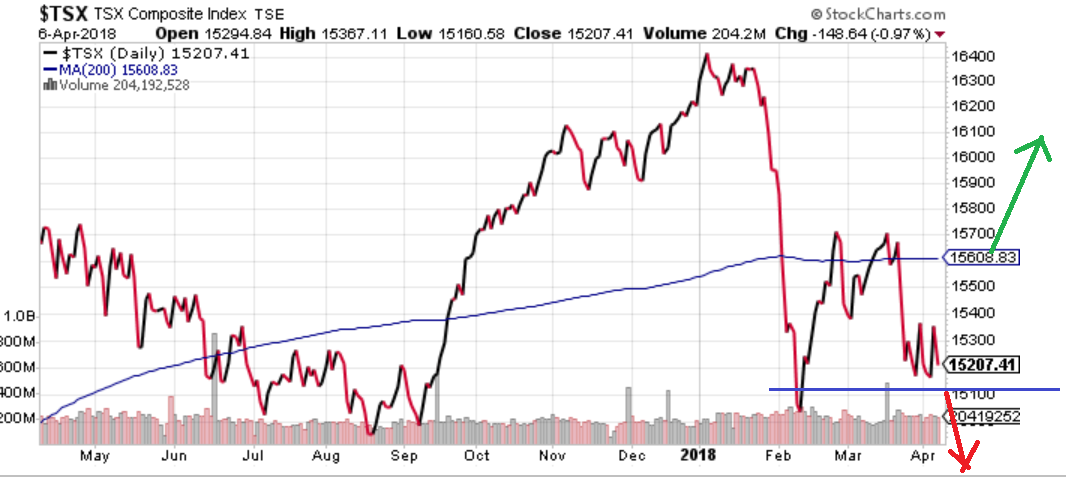
Note, I have added in the same green and red up/down arrows for charts as in the chart example above. The blue 200 day moving average line is the buy signal blue line.

The reality of the two charts is that both Canadian and US stock markets are sitting in neutral positions.
The double-bottom pattern can continue to play out with a continuously rising market. If the result ends up being head and shoulders BULL market top, I would expect the right shoulder in this process to take about two months to complete. If the stock markets are breaking down as I write, then the next level for support comes about 6% to 9% lower where the technical analysis would begin again.
End of excerpt from April 6th.
The emboldened, underlined section above is where I am going to focus this update, so let’s start in Canada.
The Canadian stock market has performed better than the US market over the timeframe from April 6th until present. We can thank the oil sector for all of that outperformance.
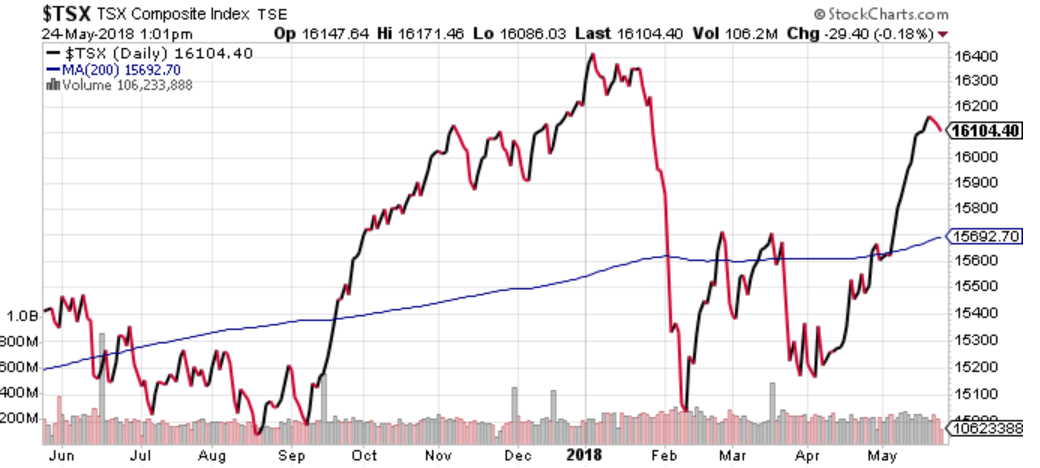
Notice that the TSX has crossed above the 200 day moving average (blue line) on the chart. Based on the Dividend Income TEAM model portfolios should be fully invested again. But I have resisted making the purchases…why?
Well, below is the chart of the iShares Core S&P/TSX Composite High Dividend Index that I use to hold the tactical part of the Dividend Income TEAM model. Notice it has not been able to clear the 200 day moving average…but it is close!
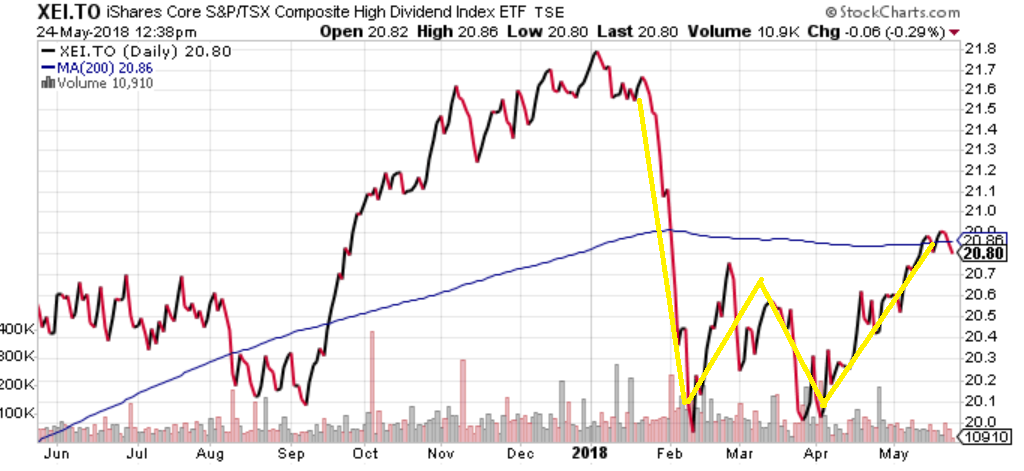
Summary of TSX: The overall TSX is inclined BULLISH and the chances of not breaking the old lows at just below the 15,000 level are good. When factoring out the oil stocks, the chart pattern is not so clearly BULLISH. We will take a BULLISH profile above the 200 day moving average line on the iShare Core Dividend ETF when the model warrants that move. We continue to hold all core individual stocks.
Next, the US S&P 500 stock market:
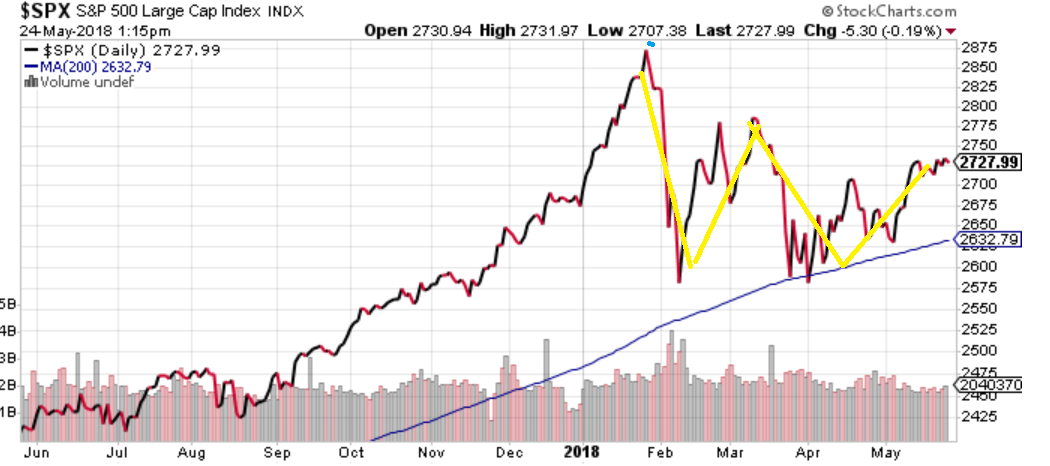
The broad US stock market is still technically more BULLISH than Canada’s stock market. The S&P 500 has defended and held its blue 200 day moving average a number of times this year. At the same time, the “head and shoulders” top formation is still valid as a potential outcome.
Notice the recovery rally since the beginning of May looks more like the Canadian Dividend paying exchange traded fund than the TSX index. This is because oil makes up a much smaller part of the S&P500 than the TSX Comp index.
Summary of US market:
Stay BULLISH on US stocks. At this point, there is no reason to change that perspective.
Overall Summary:
The early April rally in the global stock markets started with the Bank of England stating that they could not tighten monetary policy anymore and they might have to consider Quantitative Easing (again) in the future.
Anyone who does not think that the central banks of the world still don’t rule the financial world please take a look at the chart below.
That is a 14% rally in two months in one of the world’s largest stock indexes!
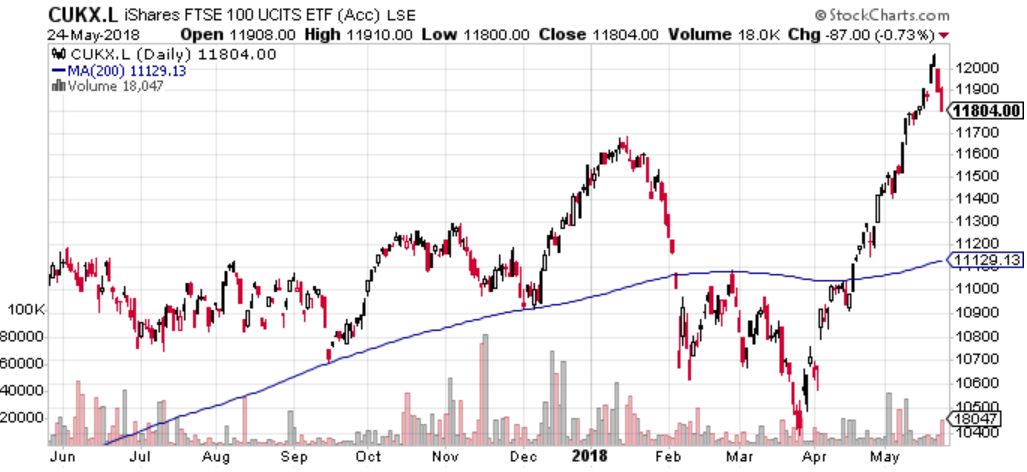
That is some serious central bank rocket fuel moving the London stock market.
What I found interesting last week was the US Federal reserve minutes made the point that the Fed is willing to tolerate higher than 2% inflation for a “temporary period of time.”
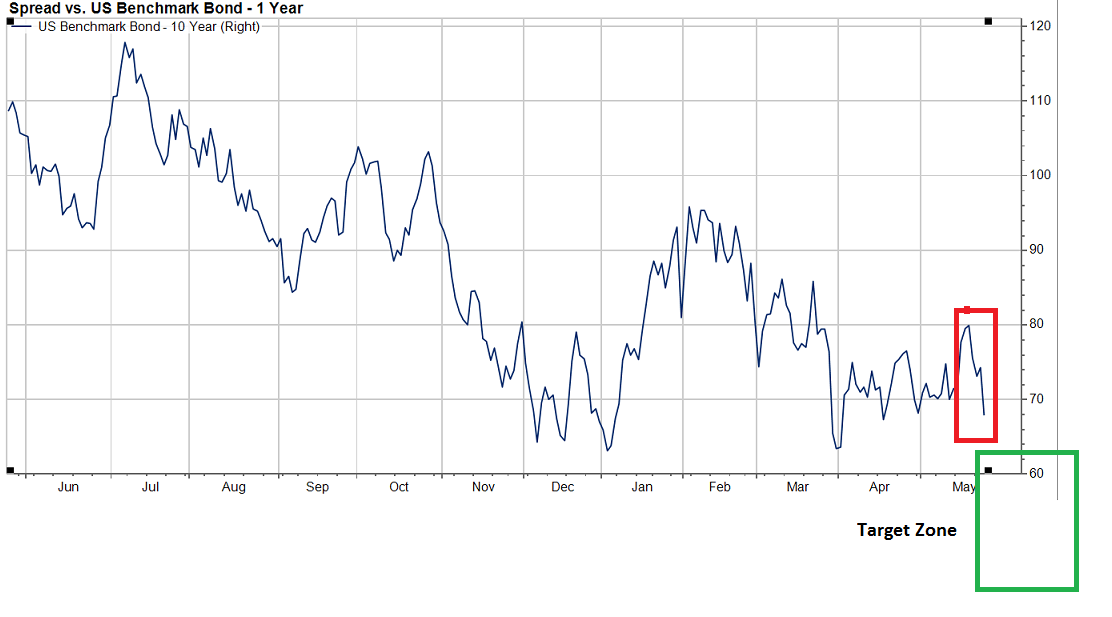
First off, I was surprised by the comment. Nothing has even gone wrong in the markets yet and the Fed is already back-pedaling from aggressively raising interest rates. Second, the US yield curve immediately started to flatten on the announcement, meaning the difference between the 10 year US Treasury bond and the 1 year bond is getting smaller (blue line in chart below shows basis points of spread).
Why I mention the Fed minutes tolerance of inflation is to make you aware that these types of repositioning statements eat away at the Fed’s ultimate ability to move the stock markets back up when they finally have to end their quest to Quantitatively Tighten (QT) and move back to Quantitative Easing (QE).
There are a lot of BULLS and BEARS out there telling you why they are right in their outlook. It is important to hear them all out.
Personally, I don’t think much has been settled yet when it comes to the trend of global stock markets.
I am inclined to add to our tactical dividend payers if and when the tactical model says we should. Let’s keep it that simple.
Gold Comment:
I will keep this short.
For those still interested in Gold and precious metals in general I believe you will find all of the information in the summary above as BULLISH to your outlook.
It is not Golds “day in the sun”…yet.
But the fact that the central banks are so willing to spend their remaining QE firepower so readily shows they truly do understand that the debt outstanding could quickly cause asset prices to decline. Spending firepower too early in the cycle is good news for precious metals holders.
If I have learned anything about central banks in my 31 years of doing this job, it is that they only have one tool in the toolbox (a QE “hammer”) and therefore, the entire world looks like a “nail” to them (do more QE).
The next round of global QE will come. That may be just the time that Gold finds its happy place as a safe refuge from debt-laden central banks that will be perceived to be totally out of control.