
Interest Rates, Debt, and Quantitative Tightening (QT)
Summary:
The investment landscape is changed; interest rates stayed too low for too long and that has created a dislocation of “relative asset prices.”
As interest rates go higher the probability of the asset price dislocation correcting itself goes higher.
The easiest way to understand what low interest rates did in the real economy is to see how they enticed future consumption forward into the present. In general, purchases were made immediately with borrowed money rather than delayed to be paid for with savings.
This comment considers some of the changes being brought about by higher interest rates.
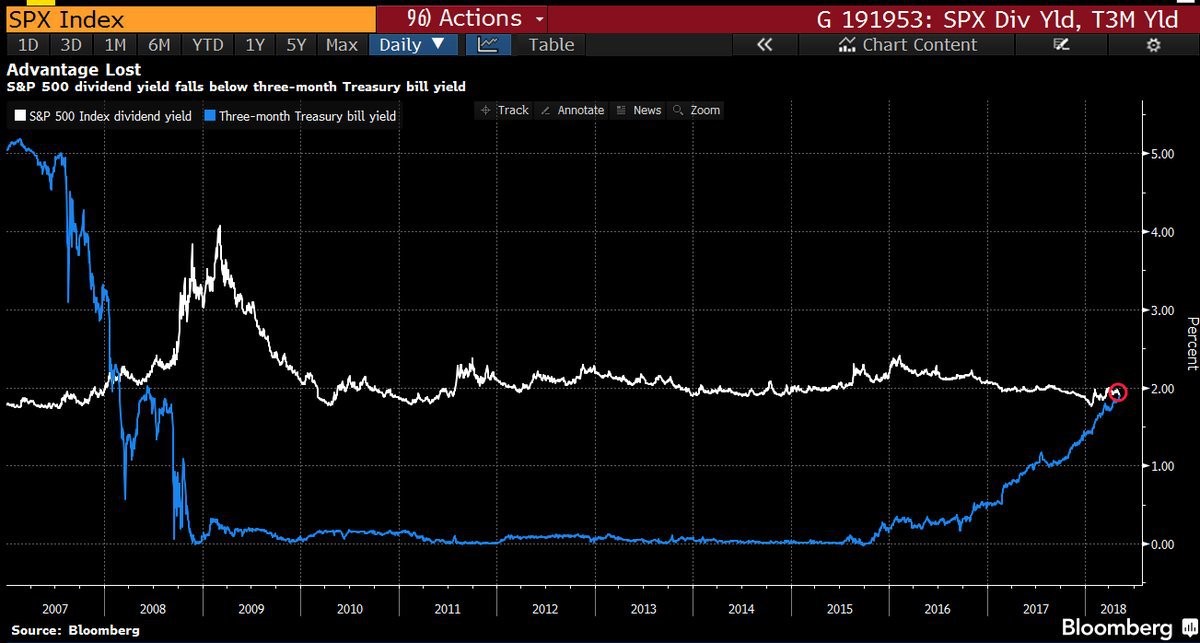
- Rising interest rates are giving investors a choice between having to own stocks or choosing to own short term bonds. The chart below compares the dividend yield on the S&P 500 and the yield on the 90 day US Treasury bills. As you can see, the cash yield for both investments is the same today.
The relative advantage for cash flow no longer exists for stocks over T-Bills.
- Debt is oozing out at every level of the global financial system and some of it is getting “uncomfortable” with the new, higher interest rates. The cost of all this debt is rising with interest rates exactly like a rising tide lifts all boats in the marina. The examples of the higher refinancing costs are now commonplace in the financial media.
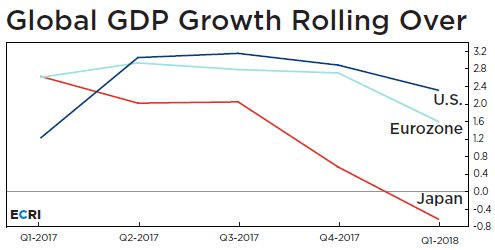
- Economic growth is already moderating and the interest increases have not yet worked their way fully into the global economy.
- Quantitative Tightening by central banks has taken a huge backstop away from global central banks to manipulate interest rates lower and leaves a lot of bond inventory to be rolled over by organic buyers. The body of this editorial makes the case to justify the summary statement in this bullet.
Summary Support:
Let’s start with interest rates.
As of Tuesday, May 15th, we have seen a new high in Canadian and US interest rates for the present up-cycle. RBC Dominion Securities offered the following charts and comments.
- US: The US 10-year Treasury yield has broken above 3% today and sits at 3.07%. This is the highest yield level on the 10-year in seven years. The 2-year and 5-year yield have not touched today’s levels since 2008.

(Nick comment – note how steep the short term bond trend (white line) is compared to the 30 year (purple line). We will watch this relationship closely. This is referred to as a “flattening” of the yield curve and has been discussed a number of times in these weekly comments over the past few months).
- Canada: Government of Canada bond yields are also breaking out to multi-year highs today, but it’s been a lower altitude flight for Canadian yields as high levels of household indebtedness have placed a bit of a governor on the Bank of Canada in raising rates. Nevertheless, rates are at 4-7 year highs across the curve in Canada.
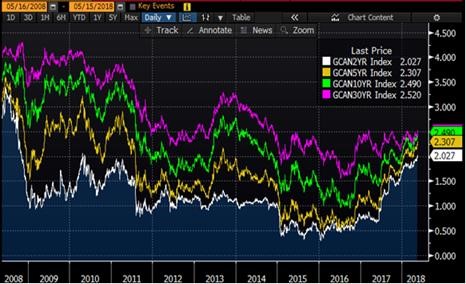
(Nick Comment – same situation as above).
RBC Thoughts: From a Canadian fixed income perspective, we believe the move higher in rates should be viewed as both an opportunity and a warning shot.
We believe the opportunity is found in short- and intermediate-term bonds. Shorter-term bonds now provide a good alternative to cash because short-term bond yields have climbed significantly more than the high interest savings account (HISA) rate recently has so there is now an opportunity cost to sit in cash.
We think the warning shot is being sent for longer duration Canadian bonds. Despite the recent rise in yields, the 10-year (and 30-year) GoC yield is still barely above the rate of inflation and ~60 bps below its US equivalent. This would mean that investors could experience a similar positive 1-2 year holding period return in a bond in the 5-year part of the curve because rates would fall more on this issue than a 10-year bond in the positive scenario for bonds.
From a credit perspective, we will be closely watching how the Canadian consumers and floating rate borrowers in the leveraged loan market handle higher rates. There is ~$1 trillion of floating rate debt outstanding in each of these respective markets, so they are two of the credit hot spots we are watching.
For the most part, I have been focused on bonds that are less than 10 years in maturity. I do agree with the idea that short term savings accounts can be re-invested in bonds that range in length from 2 to 4 years AS LONG AS YOU ARE WILLING TO HOLD THE BONDS TO MATURITY.
If interest rates keep rising, even the short term bonds fall in price. Please be completely clear on that point if you wish to add to some bond positions with available cash.
Next, a look at debt.
past comments, we have viewed debt lots of different ways. We have talked about debt in sheer gross terms, and we have looked at debt as it pertains to higher interest payments impacting the budgets of governments, corporations and individual households.
This week I am looking at how much debt needs to be rolled over and am asking the question: “Who is going to buy all the debt?”
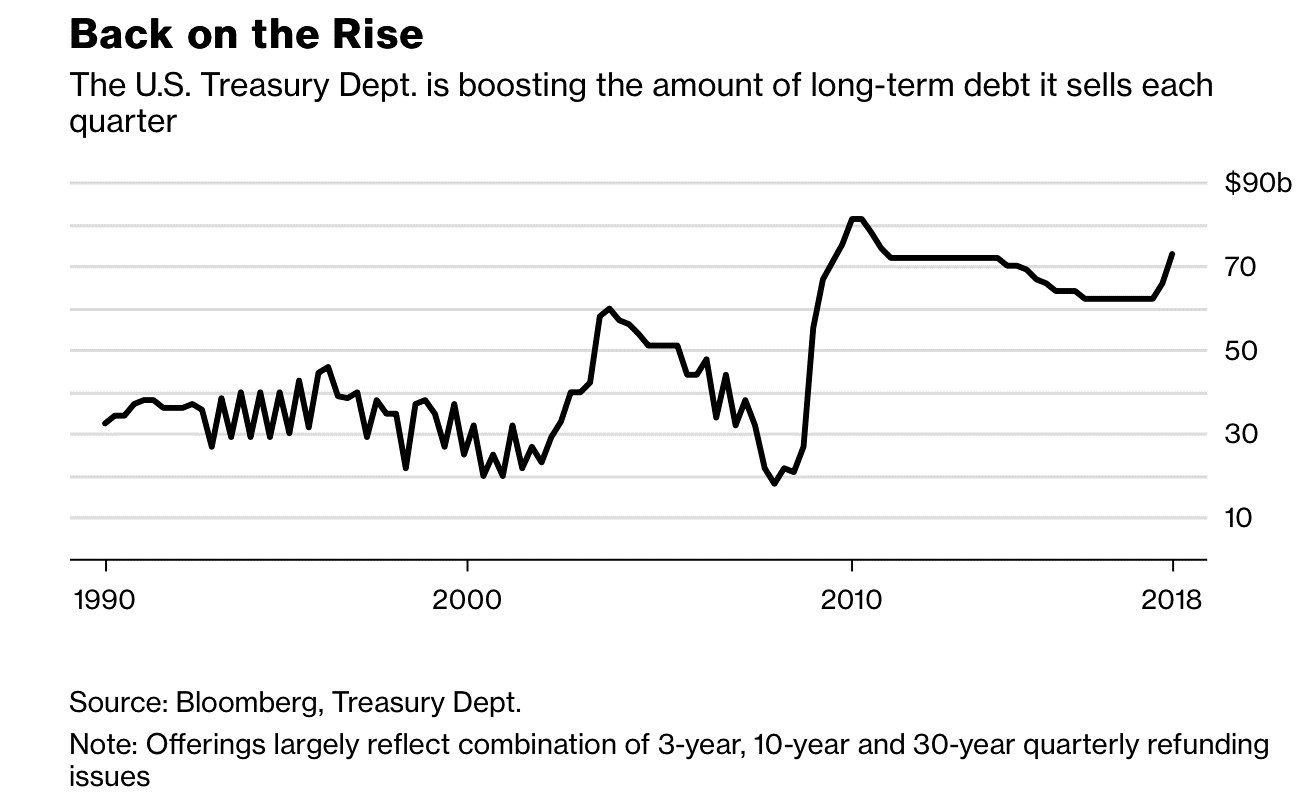
Let’s start by looking at the US Federal Government level.
We know that the tax cuts have greatly expanded the size of US Federal Deficits. It is also true that there are large piles of debt already in existence that need to be rolled over at maturity, but are you aware of how fast the Quantitative Tightening by the Fed is going to add supply to the markets and require additional buyers to soak up?
The following is from Roger Lipton of Lipton Financial in the US:
“We all know that the Fed is normalizing its balance sheet, by $10B/month in Q4’17, then $20B/month in Q1’18, now at $30B/month in Q2, going to be $40B/month in Q3 and $50B/month in Q4.”
This is a huge shift in policy.
From past QE initiatives where the US Fed was buying up to $90 billion in bonds and mortgage securities a month to the present where the Fed is SELLING $30 billion a month! If I add in the higher deficit and higher interest rates to be paid on the debt, the extra amounts to be funded start to really add up.
Here is a comparison from last year to the present:
January 2017 May 2018
Quantitative Easing/Tightening $0.00 -$30 billion
Projected Federal Deficit -$33 billion -$72 billion
Interest rate on debt (average) 0.90% 2.68%
If interest rates only stay where they are today and the FED is able to continue to Quantitatively Tighten until the fourth quarter, that $70 billion per month of extra bonds to sell grows to nearly $100 billion per month.
Simple question…who steps in to buy those extra bonds?
Next let’s look at the corporate side of debt.
John Mauldin wrote an excellent editorial last week speaking to the precarious nature of debt, especially corporate debt. I have added a couple other little tidbits I found while researching this topic too.
The first two charts come from Mauldin’s weekly; they speak for themselves.
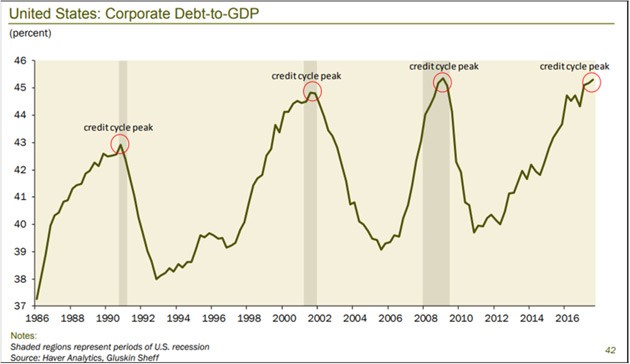
Point of interest: Notice that the cycle peaks near the end of the recessionary period but we don’t know that until the cycle is set about 18 months later.
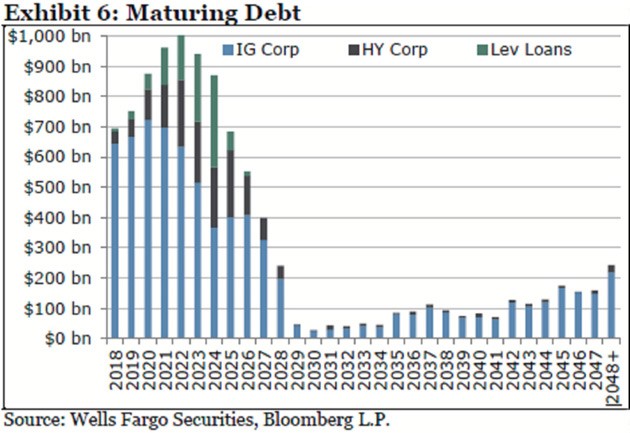
The key to corporate debt is in the rolling over the maturing issues. I think the comment below by Zachary Chavis at Sage Advisory Services was a good summary of these issues:
“Companies will need to refinance an estimated $4 trillion of bonds over the next five years, about two-thirds of all their outstanding debt, according to Wells Fargo Securities. This has investors concerned because rising rates means it will cost more to pay for unprecedented amounts of borrowing, which could push balance sheets toward a tipping point. And on top of that, many see the economy slowing down at the same time the rollovers are peaking.
“If more of your cash flow is spent into servicing your debt and not trying to grow your company that could, over time, if enough companies are doing that, lead to economic contraction.” – (Emphasis Zachary’s)
To round out this discussion, I want to show the data on how the tax cuts have actually compared to prior years as per the US Federal Budget.
Sven Henrich (@northmantrader) presented the US Federal Budget through April for the years 2016, 2017 and 2018. Below are the results:
Interest on debt +36%
Corporate taxes -24%
Individual taxes +11%
Social Security +8%
Deficit +8%
Hmmmm….
Next is a chart showing the projected US Federal Deficit created by the Daily Shot and sourced via the Congressional Budget Office.
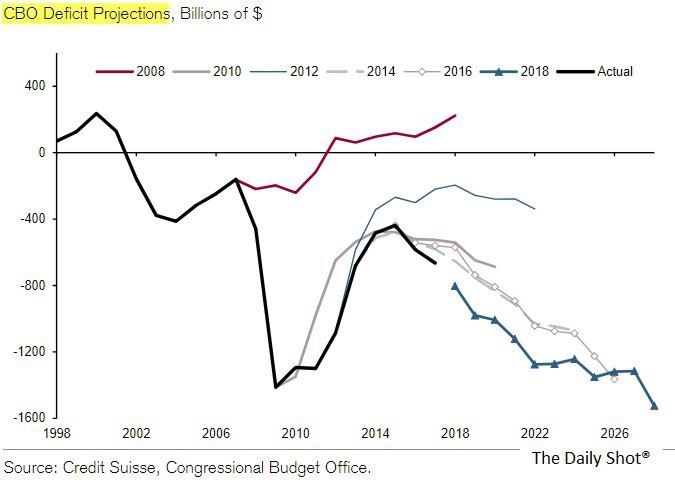
Again I ask…who are the buyers of all this new debt and what interest rate are they going to demand?
Conclusion:
If stock and real estate markets stall or decline as interest rates go higher and Quantitative Tightening is progressing what is the US Fed likely to do?
My speculation is that the Fed would stop raising interest rates BEFORE they quit Quantitative Tightening.
That leads to the final question in my mind: Would interest rates stop going higher if the Fed only stopped raising short term interest rates?
I’m not sure they would.
With all the refinancing required at the government, corporate and personal levels, investors may demand still higher interest rates to offer their money to borrowers.
Looking back at the past 10 years, I can’t help but see where there were so many better opportunities to try and rebalance the financial markets in terms of asset prices and interest rates. But there is no point looking backwards now…
These changes are still in the very early innings of impact on asset markets. At this point, I am only trying to keep you in the habit of watching for the change.
Some analysis is warranted but it is way too early to draw conclusions.
Stay tuned…