BTFD is now STFR
In more than 30 years of being a student of the financial markets there have been two stock market characteristics that have always been early signals that something is changing in terms of trend:
- Daily volatility increases dramatically as stock markets change trend. Not only are down days larger but up days are huge too.
- Psychology shifts from buying the “dip” in prices to selling the “rally.”
What causes volatility to rise? When central banks add liquidity to the system, they suppress volatility. When liquidity dries up, volatility rises.
The reason the psychology shifts from buying the dip to selling the rally is simple: The strategy stops working.
Let’s look at a chart of the TSX Comp.
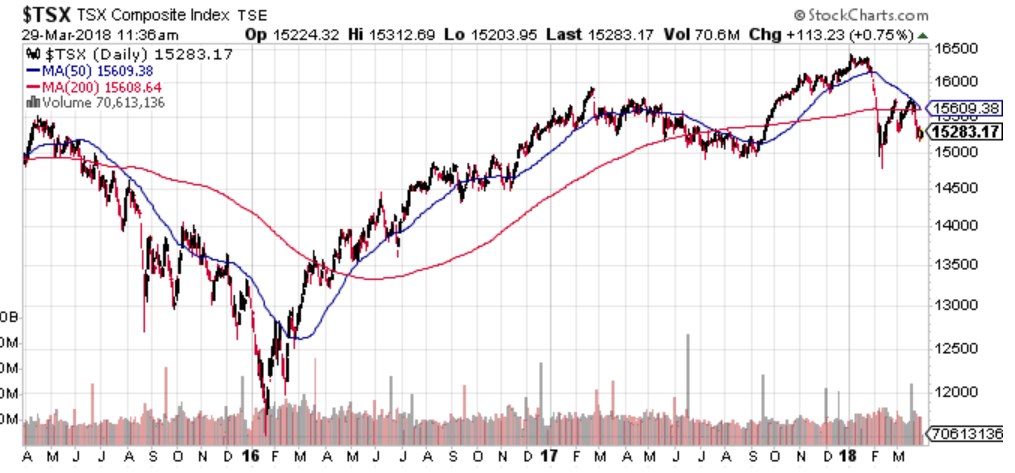
The TSX is getting very comfortable below its red 200 day moving average line. That is not a great indicator for the argument of an extension of the BULL market in Canadian equities.
The other point I want to draw your attention to is where the blue 50 day moving average line is diving below the red 200 day moving average line. Just look back on the chart and you can see where this is a sign of medium term weakness for an index.
Caution is warranted for Canadian equities.
This week we are going to focus on the US side of the stock market. Specifically, we will focus on the S&P 500.
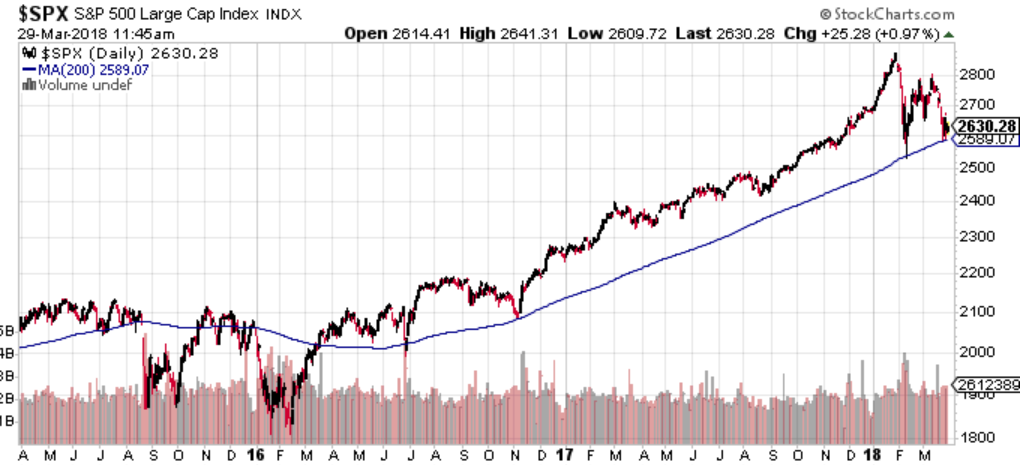
Please notice how the S&P 500 has held the 200 day moving average line over the past couple of years. The important question for investors is “will the 200 day moving average continue to hold the S&P 500 index above it?”
For traders, it is a good time to keep your risk in tight control. Know what you own and know at what point you would change your mind and not own it.
For the majority of the clients I work with who are investors rather than traders, care and attention to asset mix is required.
The next chart compares the path of the last six S&P 500 corrections and the present correction. I would argue that this picture is significantly unique to the past six and to treat it with more care and attention.

March 29th marks the end of the fiscal quarter so I would expect markets to trade with their usual BULLISH biases until Tuesday or Wednesday next week.
That will coincide with the time for writing the next weekly comment.
Interest Rates and Housing
Let’s revisit where interest rates are at present. Please take some time to think about how many things in the world today are predicated upon changes in interest rates.
We must live in the most interest sensitive time in history.
Chart 1 shows the interest rate for the US 10 year Treasury bond and the 2 year Treasury bond on the bottom window. As you can see both have been rising.
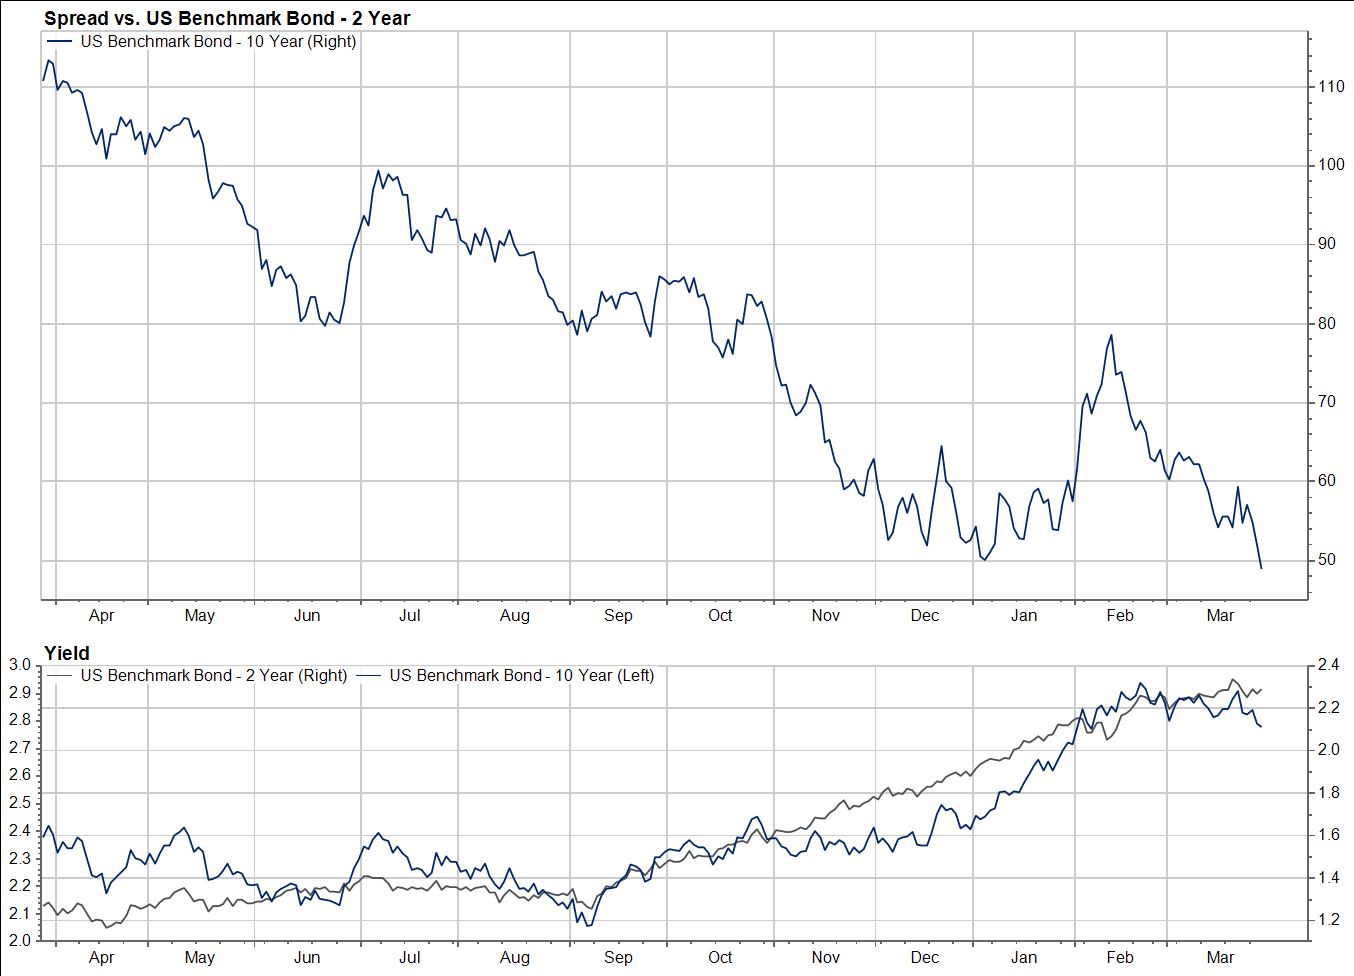
The top window shows the 10 year Treasury bond yield minus the 2 year Treasury bond yield. This is called the “spread” between the two yields.
A shrinking spread between the 10 and 2 year bonds is a harbinger to potential recession and while it does not always signal a recession in the future, it always happens before a recession takes place.
The threat is for global central banks to keep raising interest rates which, in turn, should continue to shrink the spread between 10 year and 2 year bond yields.
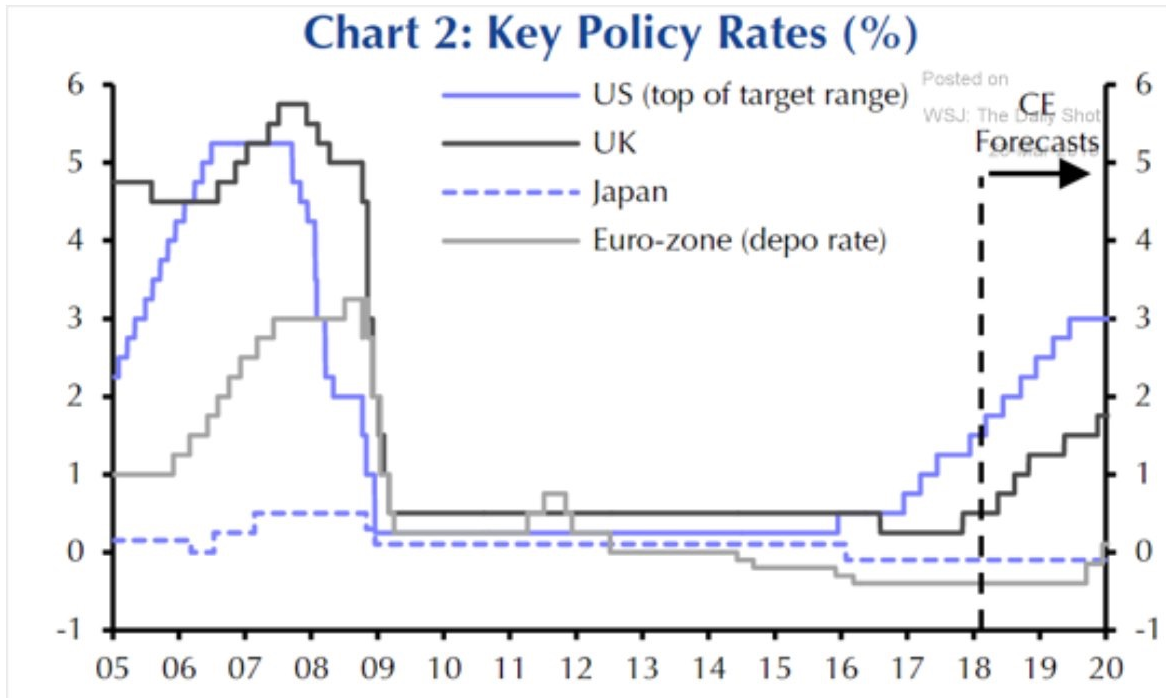
It will be worth keeping an eye on these central bank projections in the chart above. Personally, doubt the central banks will get anywhere near that many increases, but we will see.
Canadian interest rates have lost some of their upward trajectory since the Bank of Canada has stopped with their 0.25% step up in their Bank of Canada rate.
The 10 year Government of Canada bond is meandering around a top and our short rates have leveled out too.
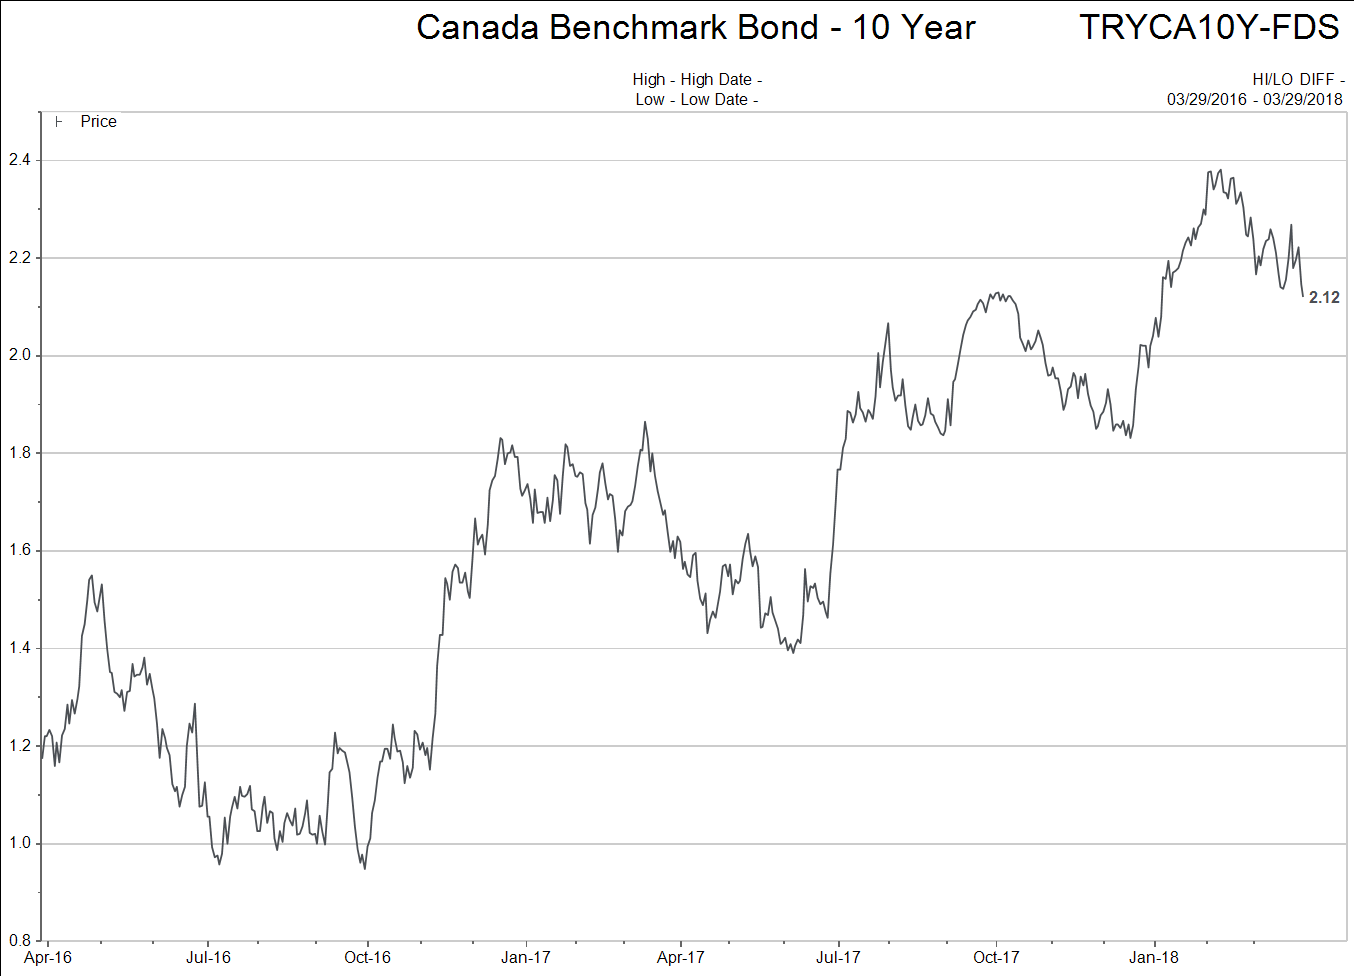
I remain for more focused on the US yield curve than the Canadian one in terms of economic meaning. The trend above has lots of implications for our real estate markets though. Higher interest rates are making a difference.
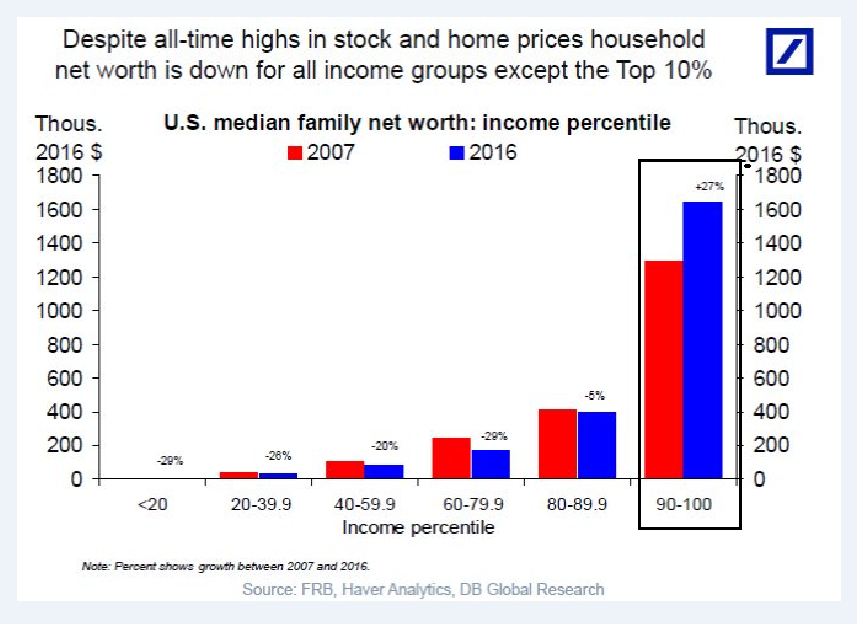
The final graphic I want to include is about US Net Worth figures.
It is stunning to me to see just how seriously skewed net worth increases have been to the highest income earners in society.
Lots to watch and think about in the coming week.
Enjoy your Easter long weekend!