
Key points
- Upper-income households are increasingly driving the growth in consumption, which is the largest component of the U.S. economy. Fully a third of economic activity relies on spending from the top 10% of households by pre-tax income.
- Higher-income households also own most investment assets in the U.S., and the rising importance of this group’s purchasing power has come at a time of record-high stock prices.
- There are multiple reasonable explanations for the causes of rising wealth disparity, but we believe there’s a strong policy and technology component.
- High equity and home prices make it difficult for future generations to become asset owners as early and at the same pace as prior generations, raising the stakes for policymakers.
The pandemic recovery period was marked by a wave of stimulus programs from governments around the globe. In the U.S., these included cutting interest rates to zero, extending forgivable loans to business owners, and distributing direct support to households. While some of the programs had analogues in the global financial crisis, many were effectively unprecedented in modern times. The combined firepower was largely successful in combatting an economic slowdown, but the nature of the subsequent recovery has been uneven. The post-pandemic period has seen a sharp improvement in outcomes for higher-income households, along with stagnation and relative decline for those with lower incomes.
Some analysts have confined themselves to the post-pandemic period when looking at this phenomenon, but we think that view is too limited. Economic bifurcation in the U.S. accelerated after the pandemic, but it did not start five years ago. Instead, we see a multidecade process that has left the U.S. with what is effectively a two-tier economy. Upper-income households are increasingly driving the economy and reaping the benefits of its advance, while lower-income and newly formed households face a narrowing path ahead.
Most of the issues raised by this evolution are social and political in nature, but it poses challenges for investors as well. It leaves the U.S. economy less resilient, more prone to shocks, and with a potential structural need for a weaker dollar. Any social instability that results could also feed back to investors through populist programs or policies designed to reward particular income segments at the expense of others.
Who’s buying?
The largest component of the U.S. economy—by far—is household consumption, which routinely accounts for almost three times as much economic activity as government spending or business investment. Increasingly, that consumption is coming from the top 10 percent of households by income. In the second quarter of 2025, consumers in that stratum accounted for just under half of all household spending, up from just over a third in the early 1990s. Put differently, consumption by 10 percent of households was behind 34 percent of all economic activity in the United States.
It’s no coincidence, in our view, that the top 20 percent of households by income directly or indirectly hold 90 percent of stock investments and that the ramp-up in consumption is concurrent with all-time highs in U.S. equity indexes.
Upper-income spending rises faster than GDP
Cumulative growth in household spending and GDP since 2020
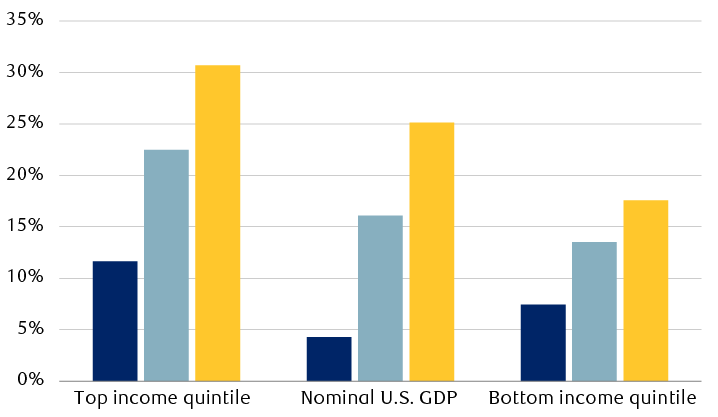
Note: Average annual expenditures for the top 20% and bottom 20% of U.S. households based on pre-tax income. Nominal GDP does not account for inflation.
Source - RBC Wealth Management, U.S. Bureau of Labor Statistics, Federal Reserve Bank of St. Louis
The chart compares spending by the top 20% (quintile) of households as measured by pre-tax income with the nominal U.S. GDP and spending by the bottom 20% of households by pretax income. For each category, the chart shows cumulative growth from the 2020 level in 2021, 2022, and 2023. The cumulative increase in spending by the top income quintile was 12% in 2021, 22% in 2022, and 31% in 2023. The cumulative increase in nominal GDP was 4% in 2021, 16% in 2022, and 25% in 2023. The cumulative increase in spending by the bottom income quintile was 7% in 2021, 14% in 2022, and 18% in 2023.
One obvious implication is that demand for nearly a third of the goods produced in the U.S. relies on a very small slice of its population whose consumption behavior is almost certainly driven at least in part by the performance of the stock market. The circular nature of that relationship—with stock prices fueling demand that drives corporate earnings that lead to higher stock prices—means that even a relatively small shift in consumption patterns could have large implications for the overall economy and global equity performance.
How we got here
There are numerous lenses through which we can view the shift in purchasing power between income strata:
Changes in the federal budget: Larger tax deductions and expansionary fiscal policy have had both direct and indirect economic benefits for wealthy households with large investment portfolios.
Declining relative importance of wages: Viewed from the income side of GDP, labor’s share of national production has been falling since 2001. For folks without investment income, the result is a relative decline in economic participation.
Post-crisis monetary policy: In the aftermath of the global financial crisis, countries around the world kept interest rates artificially low. This policy was intended to help support asset prices, propping up banks and investors facing large writedowns on defaulted loans, and it was largely successful. The side effect, however, was that rising asset prices made it more expensive for income-constrained workers to purchase homes or build savings portfolios.
Technological rewards: Income disparity arose alongside revolutionary changes like the rise of the internet and the launch of practical artificial intelligence (AI). The flow of rewards for those world-changing innovations to their creators has tended to exacerbate inequality.
Ultimately, we think it was the combination of technological innovation and low interest rates that led to significant gains for the U.S. economy, and it was government policymaking that helped direct most of the benefits to upper-income households.
How one views that outcome is often a matter of political perspective, and reasonable people can certainly disagree on the desirability of income inequality and the advisability of policy shifts to offset it. What cannot be reasonably disputed, however, is that the U.S. today is near the highest levels of economic inequality since record keeping began nearly 60 years ago.
No way home
The cleanest way to break up the current stagnation in economic mobility, in our view, would be to move wage-dependent households into the investor class. That is easier said than done, unfortunately, due to changes in initial conditions. For instance, although average wages are up a hefty 77 percent since 2007, rent has risen 90 percent over the same period. That 13 percent relative rent inflation is a major drag on the U.S. economy given that the overall savings rate is only 4.6 percent of disposable income. Add in food inflation and a general rise in the cost of living—not to mention the impact of high student debt levels—and the mathematical reality is that there are severe practical limits on how much younger households can save. One may argue that taking on student debt is a voluntary choice, but that doesn’t change the fact that food and shelter are biological necessities.
Historically, home ownership has been the path to wealth accumulation for U.S. households. Absent a policy shift, however, it’s difficult to see how low savings and high home prices will allow the next generation of Americans to enjoy the same access to home ownership as the Baby Boomers. This would hold true even if mortgage rates were to decline from current levels.
Safety first—but how?
A narrow base for economic growth has potentially large implications for the Federal Reserve.
Traditionally, the U.S. central bank has cut interest rates to spur investment and hiring, based on the idea that consumption by the newly employed would lead to a virtuous cycle of economic expansion. Today, however, the case for that type of accommodation—while it still exists—looks weaker.
Instead, the low-hanging monetary fruit now appears to be asset prices, which the Fed acts on through two related channels. One is by lowering longer-term interest rates, which makes future cash flows more valuable today. The other is through currency debasement: rate cuts that weaken the dollar. Both a lower discount rate and a weaker currency tend to drive up equity and real estate prices, and those factors in turn tend to spur so called wealth-effect spending among those with large investment portfolios.
As asset price gains outpace wage growth, younger workers see a slower path to accumulate assets
Change in equity prices, home prices, and wages, 1997–2023
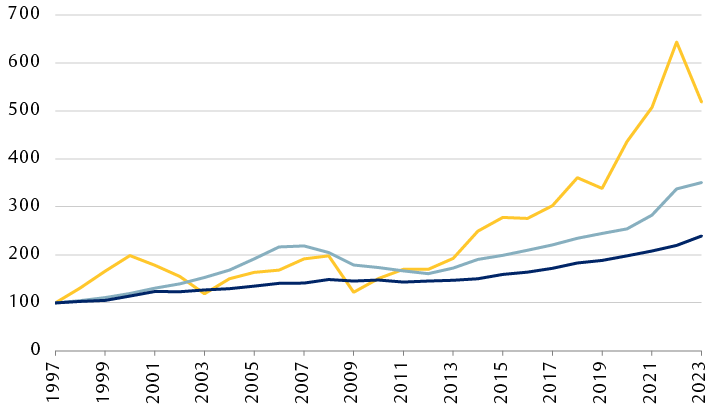
Note: Data normalized to Jan. 1, 1997; wage and salary data for 2024 not available at time of publication.
Source - RBC Wealth Management, Federal Reserve Bank of St. Louis
The chart compares the level of the S&P 500, the Case-Shiller National Home Price Index, and the average wage for U.S. workers aged 25 to 34. The data is normalized from January 1, 1997. The value of the S&P 500 has increased the most, particularly since 2009. The home price index has also increased faster than wages.
In our view, this type of policy framework has three important implications:
First, it’s heavily reliant on longer-term interest rates. The Fed cannot directly control those by adjusting its overnight policy rates, so it may have to consider less conventional tools like bond purchases. Reaction to the Fed’s latest rate cut underscores this point: while 2-year Treasury yields fell nearly 8 basis points in the days following the cut, both 10-year and 30-year yields rose in that period.
Second, currency debasement is a two-party game. Other countries may not play along with moves that benefit the U.S. to the detriment of overseas producers. Currency wars are potentially problematic across multiple dimensions of international trade and relationships.
Finally, there is a limit to what the Fed can do. Absent negative interest rates, which have their own host of problems, the Fed is stopped at the zero bound. Once it is reached, we believe the U.S. will either have to generate true growth or face a potential reckoning.
It’s important to note that there are multiple ways to view Fed policy adjustments. One is the story sketched above: using monetary policy to inflate asset prices. The other is through the lens of the Fed’s full employment mandate. In that interpretation, the Fed would not be targeting the S&P 500 Index or home prices per se. Instead, it would be recognizing that falling equity prices would challenge consumption, economic growth, and eventually employment, and looking to fight that impact.
Whatever lens we use to view that type of policy move, however, we believe the key takeaway is that the longer the central bank is in the business of asset price support, the more painful it is to get off the treadmill.
Related challenges, shared burdens
As we survey the U.S. economic landscape, we see a series of interconnected challenges: debt growing at an unsustainable pace, a two-tier economy, and economic growth that appears increasingly dependent on a narrowing base of upper-income spending and a weaker dollar. Ultimately, we believe these challenges can be overcome, but doing so will require a degree of political unity and a rational discourse on burden sharing. While such a scenario may seem remote, we think that ultimately facts and economic reality will force that conversation. In other words, if something can’t go on, it won’t—but the longer we wait, the more expensive the adjustment is likely to be.