
September has rarely been a favourable time for investors. Let’s examine to why stocks tend to fall off this time of year (pun intended).
The S&P 500 is up 30 % since the tariff scare low in April and 10 % year to date. Since 1928, the S&P 500 has declined an average of 1.2 % in September, underperforming all other months.
While that’s not a big decline, it’s a notable contrast to the average performance of other months:
- September returns were negative 55 % of the time since 1928
- 9 of the 40 worst monthly losses occurred in September, more than any other month.
- October has posted six of the 40 worst monthly losses
- 4 of the past 5 Septembers have lost 4.2 % on average (long-term average 1.2 % decline)
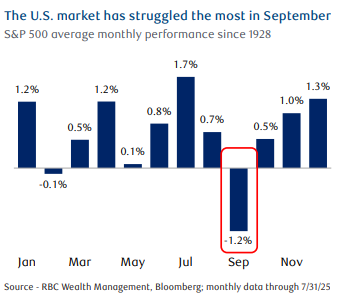 September returns in the last four years ranged from -3.9 % in 2020 when the pandemic was still a factor, to -9.3 % in 2022 when post-pandemic inflation was raging.
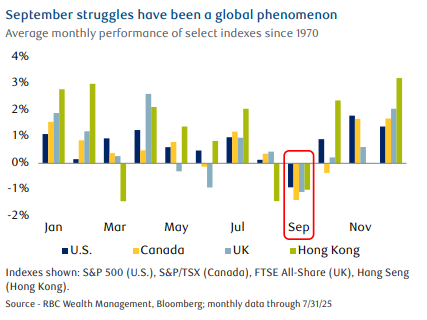
The September slide isn’t just a U.S. phenomenon. Stocks in Canada, the UK, and Hong Kong—in addition to markets elsewhere—also tend to struggle. Since 1970, the S&P/TSX Composite, FTSE All-Share, and Hang Seng have fallen by an average of 1.4 %, 1.1 %, and 1.0 %, respectively, in September).
Why?
There is no one single reason. There are a few factors that have likely contributed to this:
Window dressing:
Due to Bank’s Year-End (Q3), institutional investors tend to clean up their portfolios in September and October before the fiscal year ends by selling their worst-performing stocks, while chasing stocks that have performed better in the previous period – a.k.a. “window dressing”
This can create volatility and hold back major equity indexes.
Tax-loss selling:
This portfolio tax-management strategy in the U.S., Canada, and some other countries occurs in a variety of market situations. This can depend on individual portfolio circumstances. The worst-performing stocks are sold at a loss to limit or offset capital gains.
While this has contributed to relatively poor September returns at times, the bulk of tax-loss selling typically occurs later in the year. For instance, our practice will generally use the November window to identify loss harvesting opportunities.
Investor Sentiment:
Is September performance impacted by behavioral patterns, as many return from summer holiday ?
Perhaps.
This can be more open to changing short-term tactical strategies and/or cleaning up portfolios, although there is little seen that can quantify this theory.
Fundamentals drive performance, not seasonal moves. September’s poor historical track record should not prompt long-term investors to make major portfolio adjustments. This seasonal cycle and other market cycles should be respected, but not dominate portfolio decisions.
Other factors will primarily drive long-term U.S. stock market returns, just as they have over prolonged periods in the past, such as:
- The normal ebb and flow of the business cycle
- Federal Reserve policy
- Innovation
It’s those factors that tend to shape economic growth, corporate profit growth, and equity valuations the most. All of these are fundamental characteristics that meaningfully impact stock returns.
In addition to fundamental analysis, for short- and medium-term tactical portfolio positioning, is also important. This works together with our quarterly review and rebalance strategy.
The U.S. and other equity markets have run up sharply since April and have posted outsized year-to-date gains. Equity exposure in portfolios may have drifted above the strategic recommended allocation level.
Profit-taking and pullbacks in major indexes would be normal after such strong runs, if not in September, then at some point before year end.
As always, please let me know if you have any questions or comments.