
The mainstream media continues to make the lives of investors increasingly stressful by creating fear, which to the media's benefit, drives viewership as people are drawn to stories how imminent danger is going to effect them. Investors' memories are short, and market pullbacks are normal, and we have nothing to stress beyond the short-term.
Those is the personal finance media and many financial advisors often push suboptimal strategies that feel good, like excessively large cash allocations intended to buy the dips. But understanding what is statistically likely to happen, you can understand what to expect when the market dips, understand that it's impossible to time the market both out and in (even more improbable to do both), and understand whether you are statistically better waiting for pullbacks in cash or investing money immediately.
The stock market does not go straight up
- Every day - stocks have a 53 percent chance of rising and a 47 percent chance of falling
- 3-month period - stocks rise 68 percent of the time and drop 32 percent of the time
- 12-month period - the odds your stocks are up rise to roughly 75 percent.
If you are in the market for a long enough period of time, there is a 100 percent chance that you will experience temporary price declines at times, however the trend over time is up.
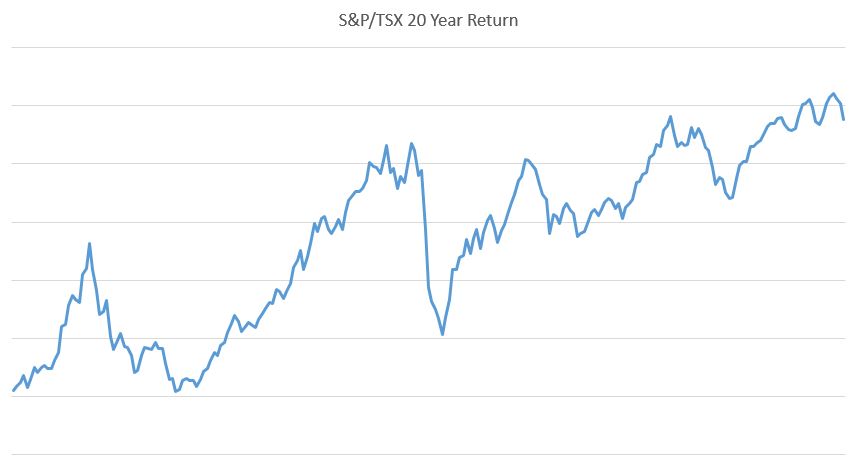
Despite a tremendous rally since 2009, stocks have not gone straight up. In fact, history shows that we've experienced seven declines of 9.8 percent or more in the S&P 500 since the bear market bottom (last week was over 6%). Staying the course each time was the right move. By knowing what to expect from the market, we can sleep easier and make better investment decisions.
How often are corrections likely to occur?
Guggenheim Funds did a research piece this August on every stock market decline from 1946. The results:
- Declines of 5 percent or greater occur about 1.5 times per year
- Declines of 10 percent or greater (corrections), occur roughly 0.5 times per year
- Declines of 20 percent or greater (bear markets), occur on average about every 7 years.
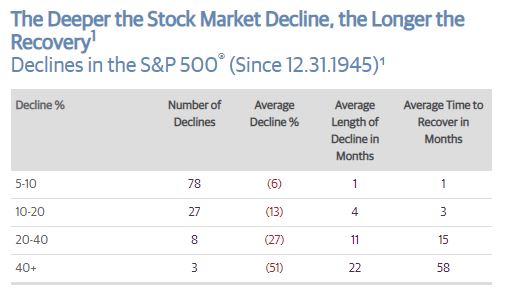
Source: Guggenheim Funds
Declines of 5-10 percent have traditionally taken a month to recover. When the market does decline, avoid selling into it, if possible. If you live off of your investments, you can draw money from your bond allocations or rely on your dividend payments for your living expenses while going through declines, as they do, roughly 1.5 times per year. This way, you aren't fighting the traffic of other panicky and over-leveraged investors selling stocks into the slightest downturn.
Statistically, you only have to wait a month to recover from market declines. Also, if you happen to get a liquidity boost like an annual bonus when the market is down or dividend payments you do not need for cash flow, you typically won't have to wait very long to make money off the bounce-back to the upside. Surprisingly, however, the data does not back up waiting in cash for a pullback.
Should you wait for a pullback to buy stocks?
Not usually.
Talking heads in the media love to boast that they are "waiting for a pullback" to buy. After all, it seems like the most natural and prudent thing to do. While there is a time and place to wait for price declines to buy assets, the strategy of waiting for pullbacks to buy stocks is grossly overused and rarely successful. Many advisors like to recommend the use of dollar-cost averaging as a way to reduce risk and increase return. However, neither of these methods has been shown to outperform simple buy-and-hold over time.
Vanguard published a white paper on this phenomenon a few years ago, entitled "Dollar-Cost Averaging Just Means Taking Risk Later." Vanguard found that lump-sum investing – not waiting for a pullback, outperformed dollar-cost averaging/waiting to invest roughly two-thirds of the time. Here's what they had to say:
Clearly, if markets are trending upward, it’s logical to implement a strategic asset allocation as soon as possible because it should offer a higher long-run expected return than cash.
Stocks have traditionally gone up over time, although they are likely to pull back, the odds they will pull back from a higher price than what you paid. Additionally, being invested allows you to collect dividends and interest, which you can either reinvest or use for lifestyle purposes.
Many in the media and financial advisors push "waiting for pullbacks" as if they know when and how long they will occur for. But the data does not back their claims up. Dollar-cost averaging has a place, for example, if you contribute to an RRSP with each paycheck you are dollar cost averaging. This is acceptable because you aren't letting the money pile up in cash while waiting for a decline to time the market.
Takeaway
The old adage "that time in the market beats timing the market" is backed by statistical research. However, market pullbacks are common, and understanding how they work helps guide our decisions to buy and sell stocks. Knowing what to do (and what not to do) when the market pulls back helps you achieve your goals and get to where you want to be.
Contact us today to discover how we help our clients navigate the markets.