
After dropping sharply a couple weeks ago, North American developed equity markets have attempted to stabilize of late, but volatility persists amid the crisis in Ukraine. Market participants continue to take note of the negotiations between Russia and Ukraine and multiple discussions between various leaders.
Sanctions and counter-sanctions are also garnering attention—and should—especially as they pertain to commodity prices, which have jumped meaningfully so far this year, as the chart illustrates.
YTD performance of select energy, metals, and agriculture commodities
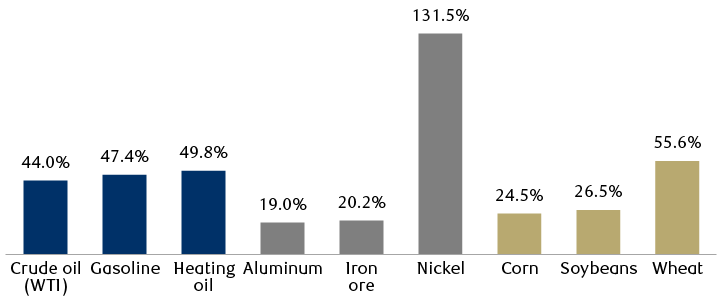
The bar chart shows that on a year-to-date basis commodity prices have risen substantially in three major categories. Energy: crude oil (West Texas Intermediate or WTI), 44.0%; gasoline, 47.4%; heating oil, 49.8%. Metals: Aluminum, 19.0%; Iron ore, 20.2%; Nickel, 131.5%. Agriculture: corn, 24.5%; soybeans, 26.5%; wheat, 55.6%.
Source - RBC Wealth Management, Bloomberg; commodities futures prices from U.S. and London exchanges; data as of 9:54 pm ET, 3/9/22
For equity markets, the relevant question is: where do all of the sanctions leave economic and corporate earnings growth, inflation, and profit margins? We think there is now a much wider range of potential outcomes than there was before the crisis began.
The sanctions campaign
The collective West has implemented “sanctions from hell” against Russia (a phrase coined by a U.S. senator years ago) in a very unified and resolute manner—effectively blockading Russia from Western countries—with more sanctions likely coming from the U.S. and allies outside the EU.
But it’s notable that, thus far, not all nations are going along. China, India, Turkey, Brazil, Mexico, Israel, Saudi Arabia, Egypt, other Middle Eastern countries, and Central Asian nations, among others, are choosing not to implement sanctions of their own against the world’s largest commodity producer. Most of these countries have strategic partnerships with Russia in various areas.
Russia has yet to formally roll out its package of counter-sanctions and administrative actions against countries that have imposed sanctions, although this should happen soon enough.
From our vantage point, the Ukraine crisis is starting to morph into an economic war between the West and Russia, with many other nations preferring to stand on the sidelines—although all nations are bound to be negatively impacted in one way or another given the upward pressure on commodity prices.
Regardless of how developments in Ukraine unfold, we think most sanctions will be in place for a long time. The origins of this crisis go back decades, as we wrote in our recent special report before events escalated.
Inflation blowback?
Major central banks acknowledge the sanctions will make it more difficult to fight what already had been a challenging inflation environment, and this will likely put additional pressure on households.
According to a study by the U.S. Congress Joint Economic Committee—an entity that has historically done some good research, in our view—even before the Ukraine crisis began, the average cost of inflation for American households was $385 per month relative to January 2021. There is little doubt in our minds that the sanctions will further increase the costs associated with inflation in the U.S., and those costs could end up being higher in Europe. Sanctions can constrain supply chains and act as an indirect “tax” on commodity prices, which filters into the prices of multiple goods and services.
The consequences of higher prices for energy, metals and chemicals/gases used in the industrial and technology sectors, and agriculture have yet to be fully fleshed out by economists—we think it’s just too early.
The agriculture component not only impacts Russian exports but also those of Belarus, a leading fertilizer producer. And, of course, the crisis in Ukraine will disrupt the planting season there. All three countries are major contributors to global food supplies. According to the UN, global food prices rose to a record level in February, climbing 20.7 percent year-over-year, even before the Ukraine conflict and sanctions reached acute levels.
Economic scars could be a growth scare
Due to the knock-on effects of high commodity prices, the global and U.S. economies could be facing what the RBC Capital Markets U.S. Equity Strategy team is terming a “growth scare.” In this sort of scenario economic growth is put at risk, stoking fears among market participants of either very slow growth or recession, but in the end a recession is avoided and economic growth resumes at a normal pace over time.
Since 2009 when the global financial crisis occurred, growth scares have happened four times, negatively impacting the equity market: (1) the European debt crisis in 2010, (2) the U.S. debt downgrade in 2011, (3) the industrial recession in 2015–2016, and (4) during the Fed’s first quantitative tightening procedure and when the U.S. and China were engaged in a trade tussle in 2018.
The S&P 500 declined 17.3 percent, on average, during these four episodes, according to RBC Capital Markets. The chart shows the S&P 500’s path one year before and one year after the market hit bottom. It took 147 days, on average, for the market to work through the growth scare, before reaching the trough level (indicated by the vertical orange bar on the chart).
How the market handled previous “growth scares”
S&P 500 performance when GDP growth was threatened but avoided recession (since 2010)
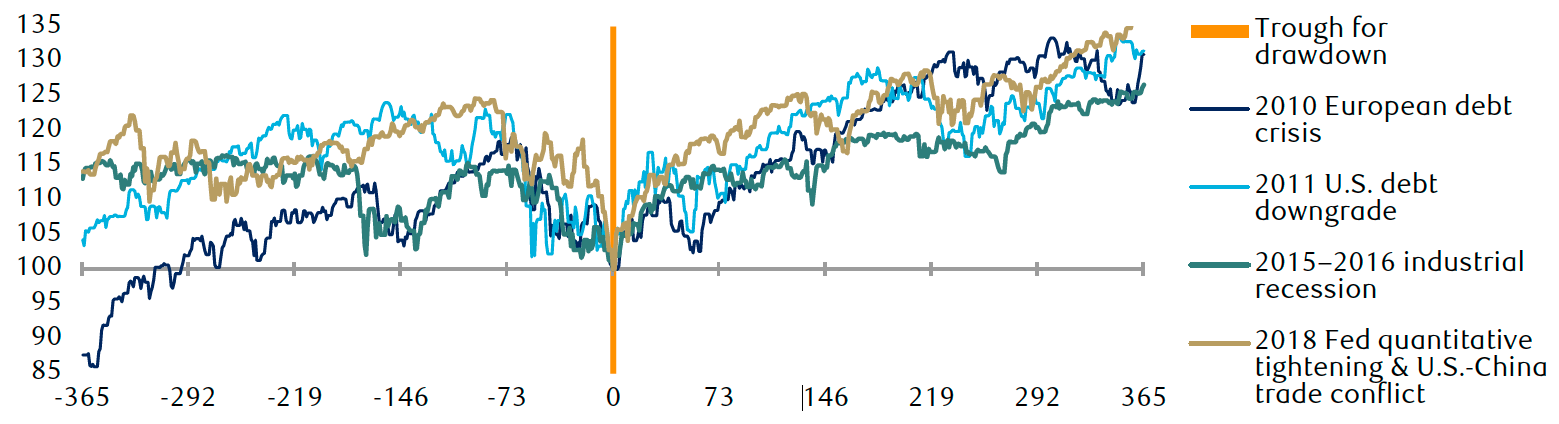
Source - RBC Capital Markets U.S. Equity Strategy, Bloomberg; vertical axis indexed at trough level = 100; horizontal axis shows one year preceding and after trough (in days)
What’s notable is that after the troughs, in each instance the market built on its gains one month, three months, six months, and 12 months later. The S&P 500 was higher by 30.9 percent, on average, 12 months after it troughed.
If this crisis ends up resulting in an economic growth scare—instead of a recession—history indicates that there could be more bumps along the way with additional downside, and the turbulence could last a number of months, but that over the medium term, economic conditions should sort themselves out.
Thus far, none of our seven U.S. leading economic indicators of recession have budged—they are all still flashing green, which signals expansion. We will continue to closely monitor these indicators and others given the crisis situation and the wide range of potential outcomes.