The theme of this year’s International Women’s Day (IWD), #EachforEqual, calls on each of us to do our part to create a more gender-equal world. Canada can point to a dramatic increase in women’s participation in the labour market over the past four decades as creating the conditions in which economic equality is finally in sight. Women are a force in the labour market like never before, giving them a new financial independence that’s serving them well during their earning years and into retirement. A recent RBC/IPSOS survey said 70% of women over the age of 45 are looking forward to a comfortable retirement.
In our previous IWD reports, we focused on the gaps that women face, in terms of pay or because they take a hit to earnings when they have a baby. While these gaps persist, this year we’ve chosen to highlight the financial gains Canadian women have made.
They include:
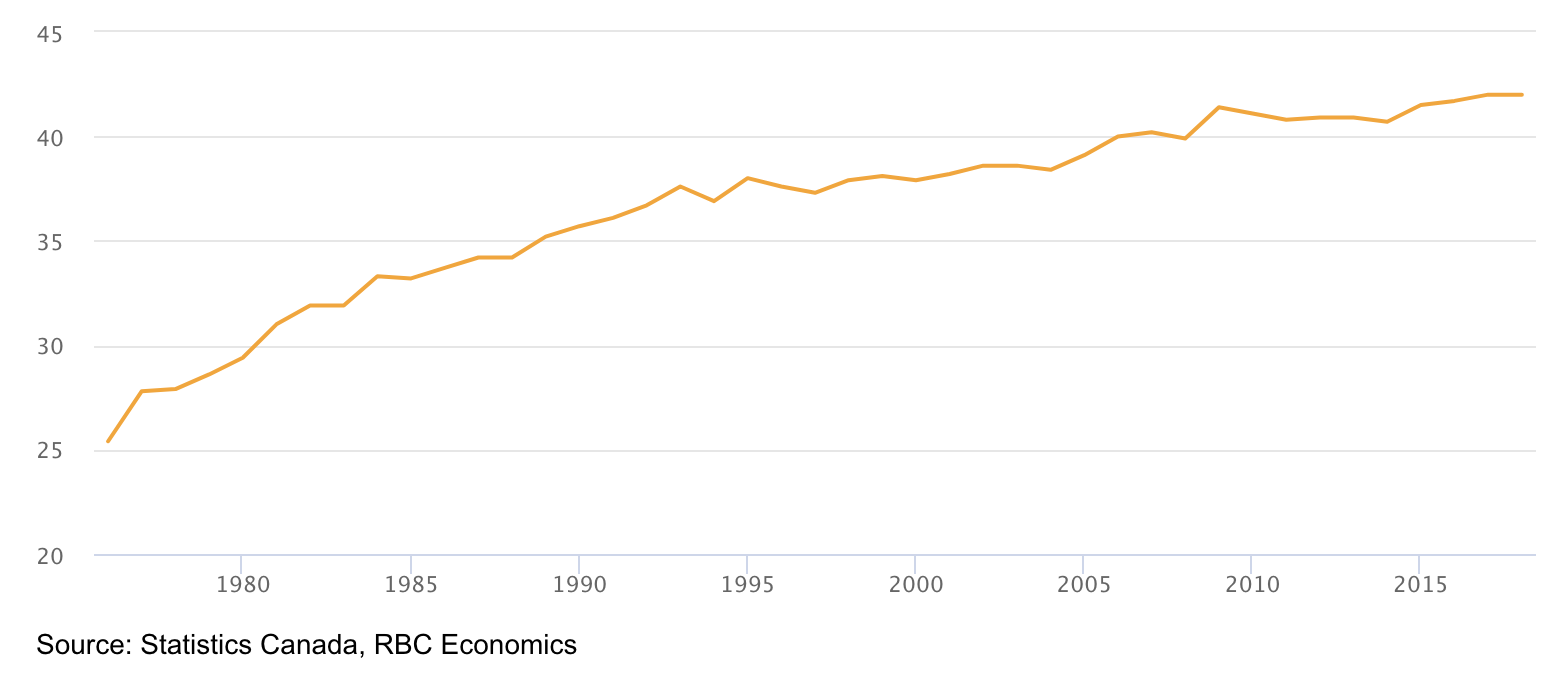
- Women earn 42% of total Canadian household income, up from 25% in 1976
- Those income gains mean Canadian women collectively control $240 billion more each year than if their income share hadn’t increased
- Growth in women’s retirement savings prevented more than 1 million senior women from falling into poverty
- Working-age women boast a collective net worth of $3.4 trillion, 46% of the Canadian total
Women’s economic clout helps drive the consumer economy; they make the majority of household purchases, including food, necessities and healthcare. More surprisingly, single working women now boast larger private pension assets than their male counterparts, reflecting their strong presence in sectors where defined-benefit pensions are more prevalent. Women are also a growing force in the housing market and in charitable giving.
Closing in on half of the income pie
Two important factors behind women’s increased share of total income are an increase in their labour-force participation rate, and the move from jobs to careers.
Share of income earned by women has increased dramatically since 1976
Share of total earnings (%) earned by women
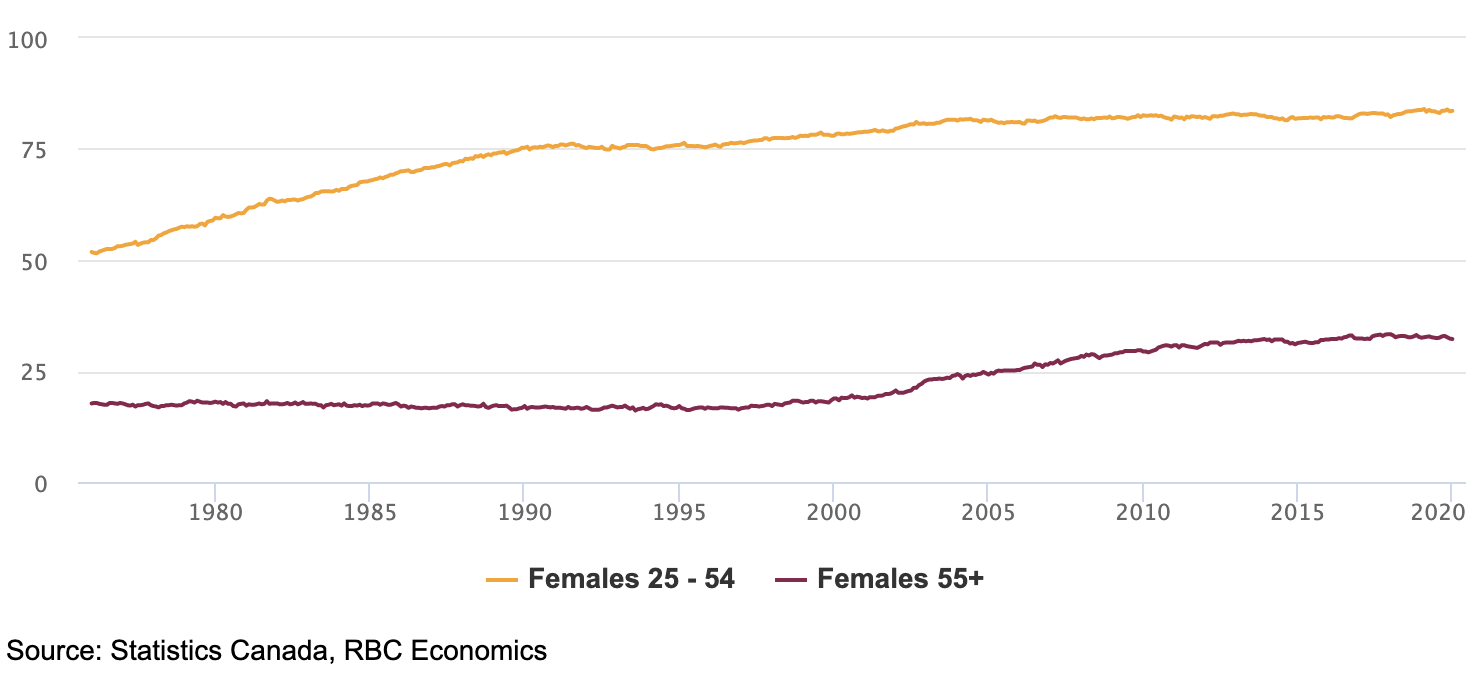
Since 1976, the participation rate of prime-age women (age 25-54) has increased from 51% to 83%. For older women (age 55+), the increase has been even more dramatic, nearly doubling from 17% to 32%. While women continue to face higher career costs for having children, their stronger and longer attachment to the workforce (relative to the 1970s) has helped even out their share of the income pie over time. This has happened in spite of the persistence of a wage gap that sees them earn just 88 cents for each dollar a man earns.
More and more women in the labour market
Participation rate (%)
In 1976, women’s earnings accounted for 25% of the total income earned in the economy. Today, it’s 42%, underscoring the massive rebalancing of earnings of men and women. The extra share of total income amounts to $240 billion more for Canadian women, each year.
From jobs to careers
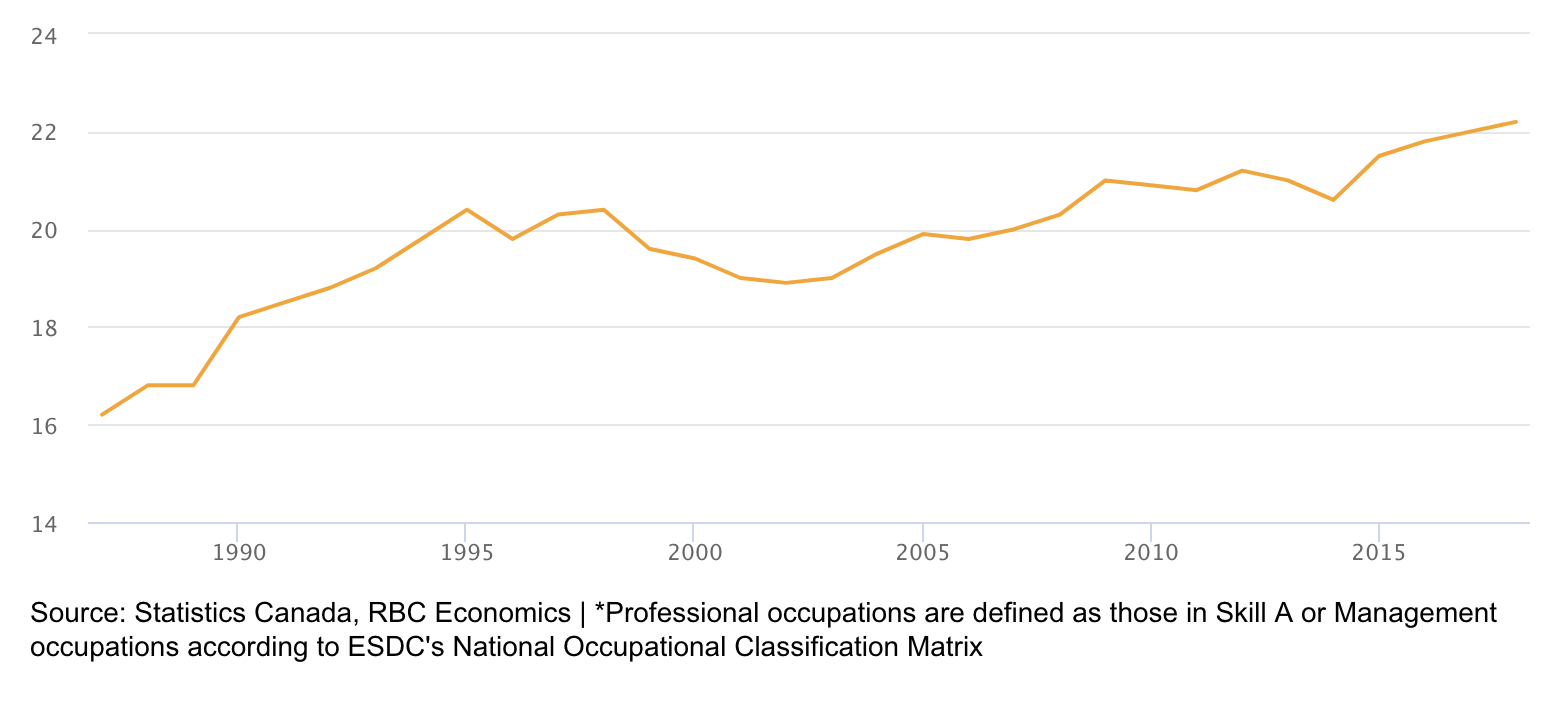
Women aren’t only holding down more jobs; they’re occupying different jobs, largely because of education. In 1991, 15% of women had a university certificate, diploma or degree. It’s now 35%. Over the same period, men only increased their educational attainment from 19% to 30%. Relative to 30 years ago, women are also much more likely to be managers or in professional occupations that usually require a university degree such as physicians, secondary school teachers, or lawyers.
The shift to careers—higher-earning positions with longer tenures—has paid significant financial dividends.
Women increasingly working in professional occupations*
Percentage (%) of employed women
Accumulating wealth
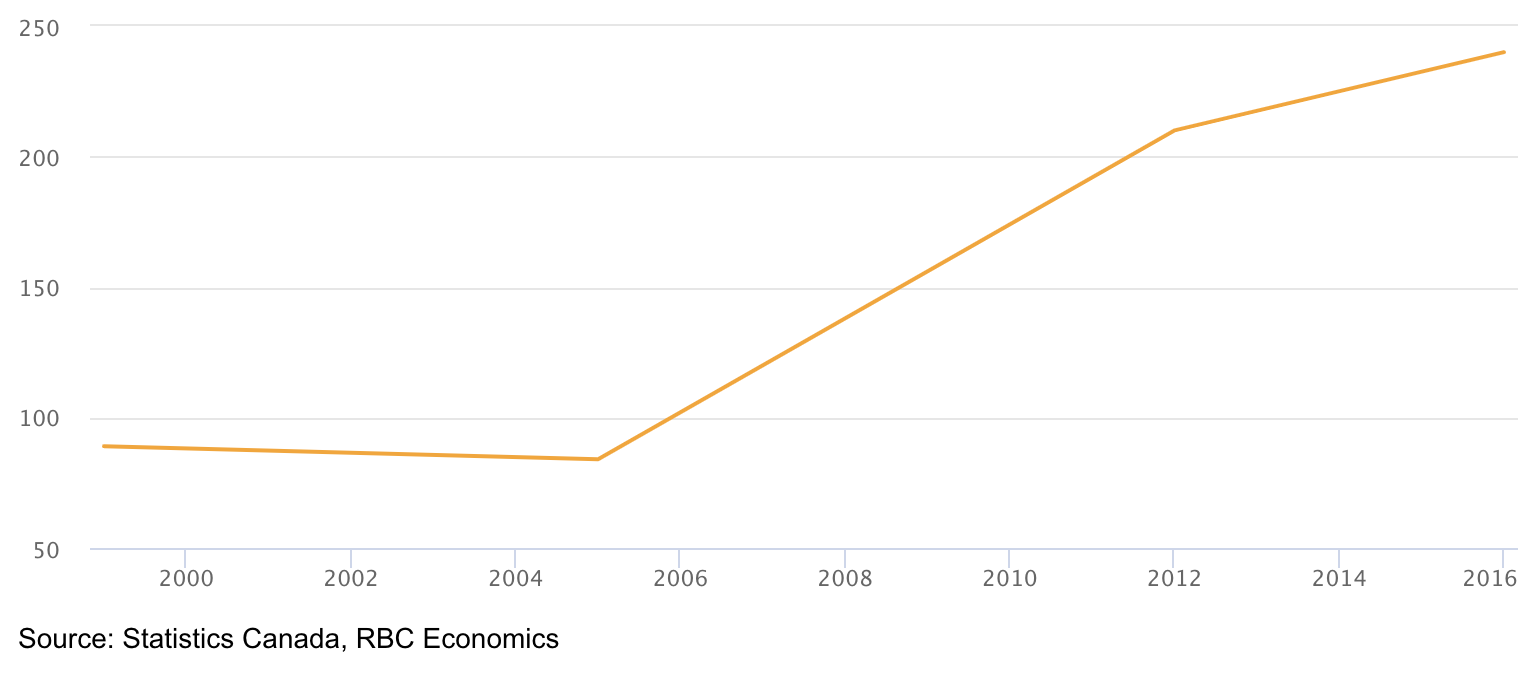
Women between the ages of 18 and 64 now control a net-worth of about $3.4 trillion today. That’s 46% of the Canadian total for the working age population, according to data from Statistics Canada. Single women without children outpace single men without children, with a net worth of $250,000 vs $230,000 for men. Another notable development has been the rise in net worth of single mothers from an average $89,000 in 1999 to $240,000 (in 2016 constant dollars) in 2016.
Single mothers have nearly tripled their net-worth since 1999
Average net worth (in thousands of real (2016) dollars)
Part of these gains reflect women accumulating their own workplace pensions—savings pools that were less available to them when they were either in short-term low-paying jobs, or not working outside of the home. Increased access and improved maternity leave benefits, which in 2000 effectively increased total leave benefits from six months to one year, have helped link Canadian women more permanently to long-term employment relationships.
Now, with women employed in record numbers in the social services, healthcare, and education—professions that tend to also come with retirement plans—they’re building their own nest eggs. Two-thirds of women said they, and not their spouse or partner, were primarily responsible for their own retirement savings, according to the RBC Insurance/IPSOS poll. Nearly 60% said they had a defined benefit pension or matching program at work.
Deploying wealth
Home-ownership rates among women and men in Ontario, British Columbia and Nova Scotia are virtually equal. Single women with no children have a higher rate of home ownership than single males (40.2% versus 38.4%). However, a large gap still exists between the home ownership rates of single mothers relative to that of single fathers (38.2% versus 62.0%).
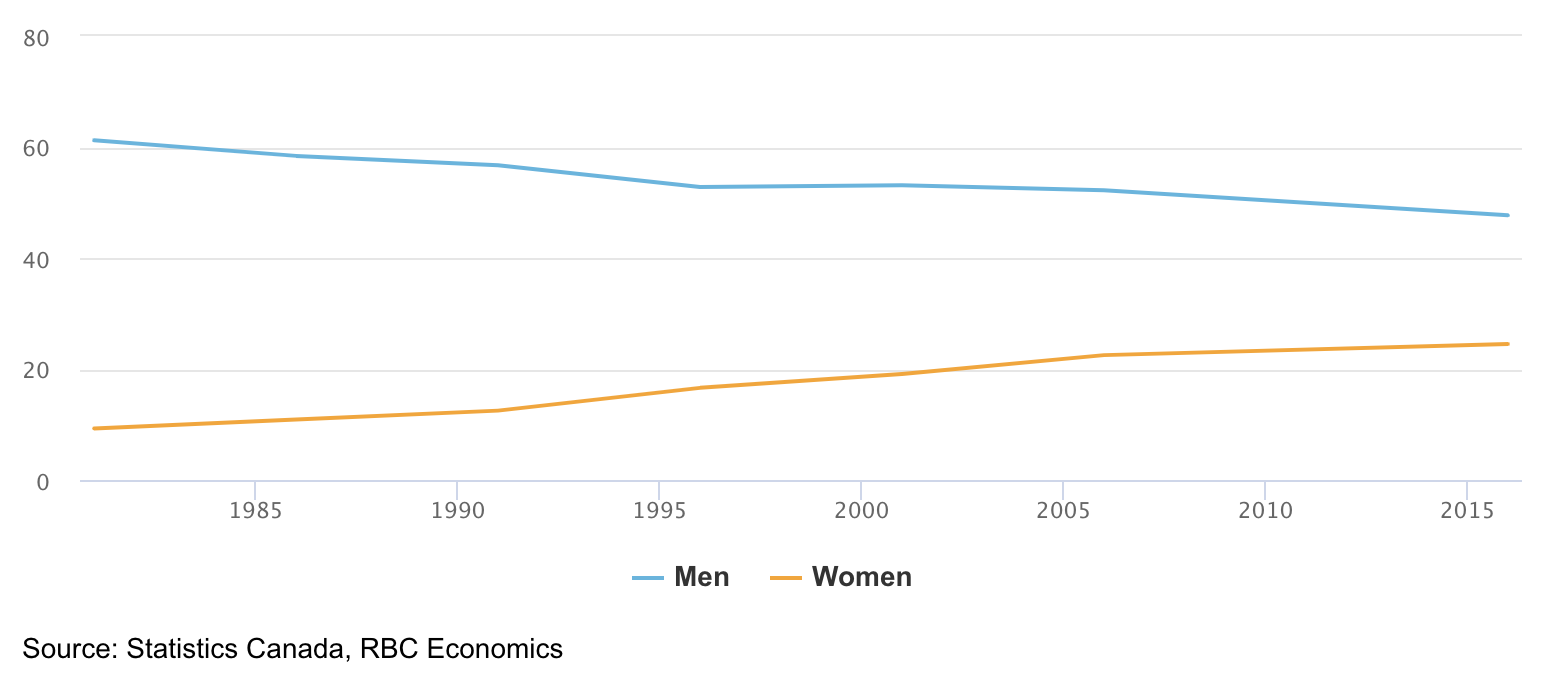
Women are also increasingly responsible for paying rent, mortgages, taxes, and electricity bills within the household. In 1981, the share of women aged 25-64 identifying as the primary household maintainer was 9.3%. Today, nearly 25% of women identify that way.
The share of women who are the primary maintainer of a home has doubled
Percent (%) of women who are the primary maintainer of a home they own (25 to 64 year olds)
As women’s share of household income catches up to men’s, so too is women’s share of total household spending. Married women on average were responsible for 47% of household spending over the last two years, according to RBC internal data. Women spend more on average than males on groceries, health expenditures and at specialty retail and department stores.
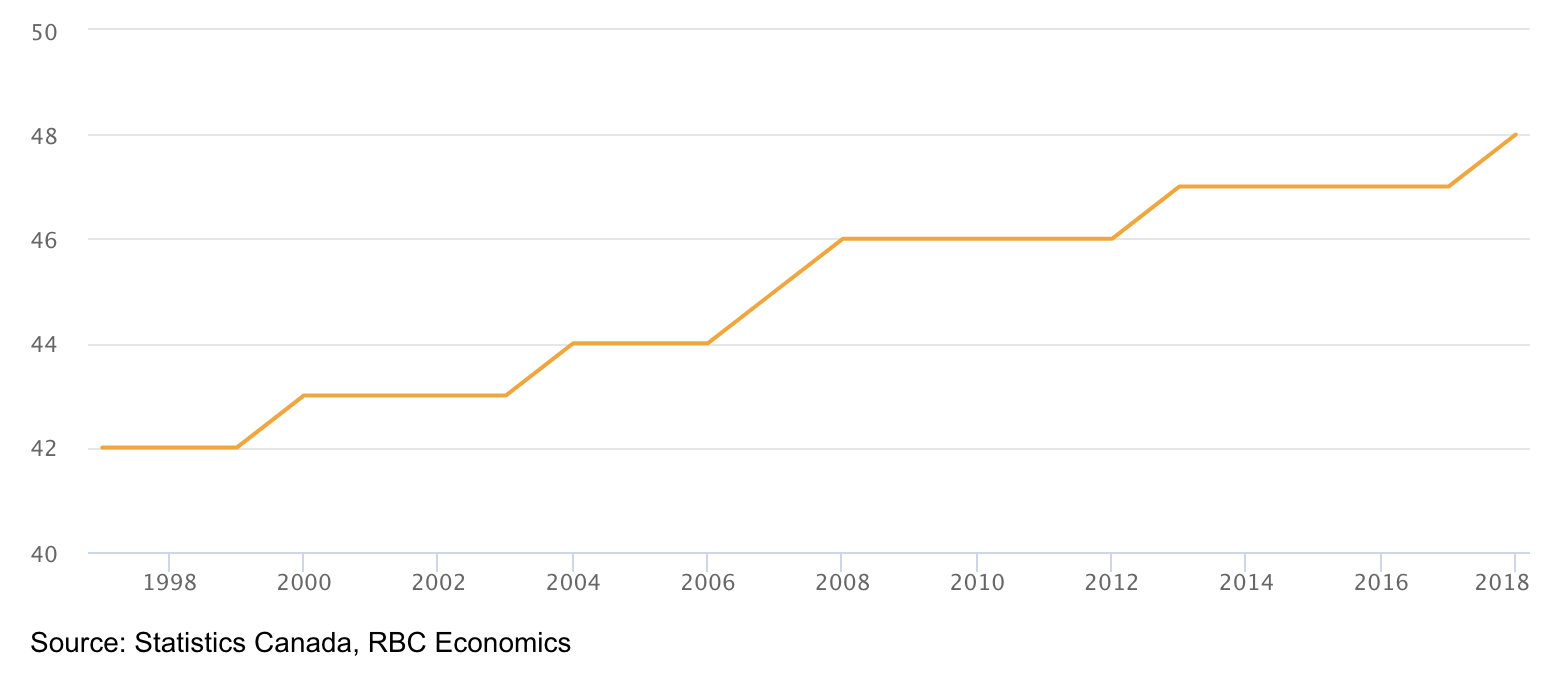
Finally, women are sharing their newfound wealth. The percentage of charitable donors that are women has grown from 42% to 48% over the past 20 years.
Women increasingly giving to charity
Percent (%): 44Percent (%) of all donors that are women
Golden years are more golden
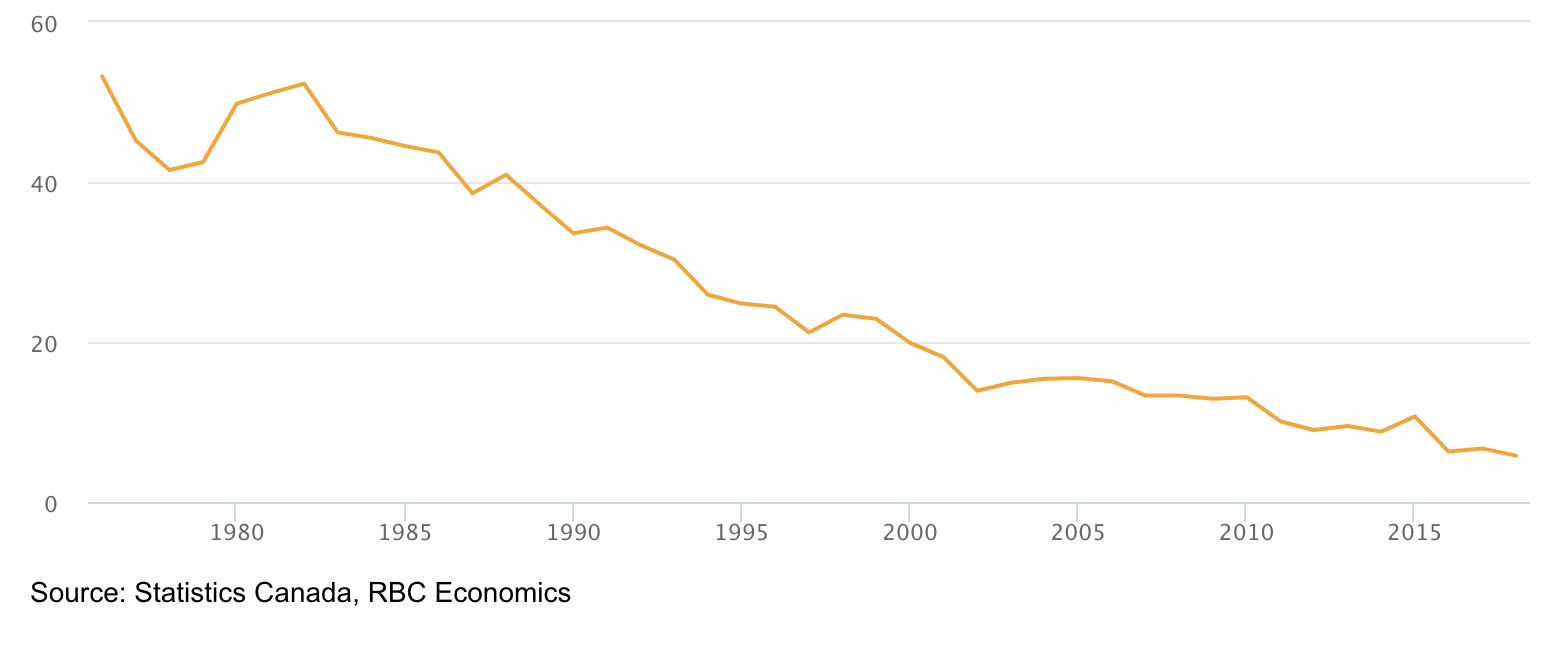
A lifetime in the labour force has allowed women to tap into programs that are strongly tied to past employment. In 1976, women’s income from CPP/QPP came to half of what men earned from those retirement plans. Today, their share of CPP/QPP earnings is almost the equal to men’s. When we include all retirement income (both private and public), women went from earning 40% of what men did to 80% today.
The gap in retirement earnings from CPP/QPP between men and women has nearly closed
Earnings gap (%) in CPP income between men and women
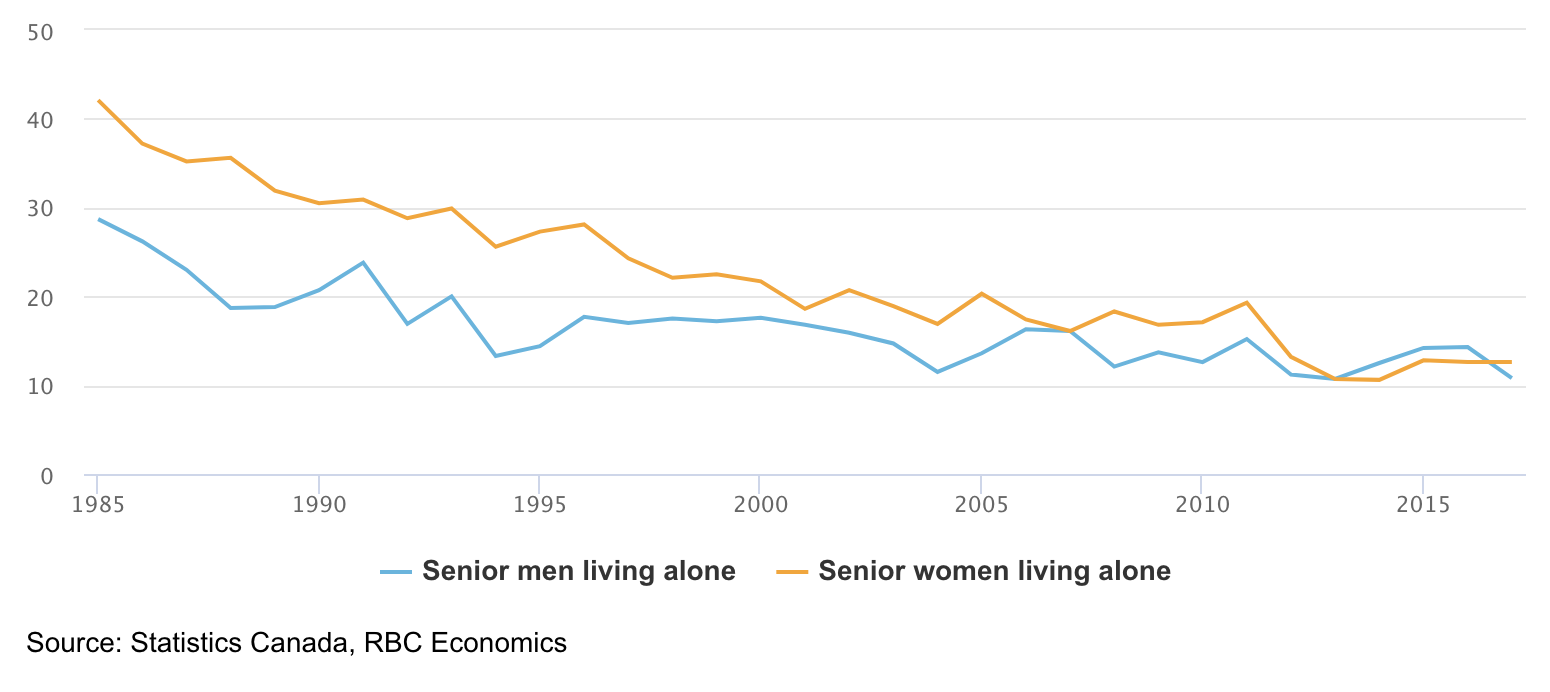
As a result, the fraction of women seniors who live alone and are considered low income has fallen dramatically. In 1985, 42% of elderly women living alone were considered low income, compared with 29% of elderly men living alone. Today, this gap has essentially closed, meaning there are 1.1 million fewer elderly women living in poverty.
Senior women living alone now much less likely to slip into poverty
Percentage (%) of persons in low income (Low income cut-offs after tax measure)
Their improved financial security couldn’t have come at a better time. The proportion of women aged 65 and over has increased rapidly since the 1970s, doubling from under 5% of the population in 1971 to nearly 10% today.
By 2030, one in eight people in Canada will be a woman over the age of 65. Thanks to their workplace gains, women are now more than ever in a position to enjoy the fruits of their labour.

This report was originally published by RBC Thought Leadership.
RBC Economics provides RBC and its clients with timely economic forecasts and analysis.
This report was authored by Vice President & Deputy Chief Economist, Dawn Desjardins, Senior Economist, Andrew Agopsowicz, and Economist, Carrie Freestone.
This article is intended as general information only and is not to be relied upon as constituting legal, financial or other professional advice. A professional advisor should be consulted regarding your specific situation. Information presented is believed to be factual and up-to-date but we do not guarantee its accuracy and it should not be regarded as a complete analysis of the subjects discussed. All expressions of opinion reflect the judgment of the authors as of the date of publication and are subject to change. No endorsement of any third parties or their advice, opinions, information, products or services is expressly given or implied by Royal Bank of Canada or any of its affiliates.
