JANUARY 26,2018

MARKET ENVIRONMENT

Most global equity markets have had an excellent start to the year. For example, the US markets have recorded 14 all-time records so far in January. This is a record unmatched in market history and broadly seen as a positive indicator for strong performance in 2018.

The Canadian markets, however, continue to notably underperform and are slightly negative so far this month (due to unfavourable) local conditions. As a result, we continue to reallocate Canadian funds to more productive global investments.

Global markets in 2018 have been supported by strong economic growth, higher employment, excellent corporate profits, and anticipation of the profit impact of the US corporate tax cuts becoming more visible.

Based on all of this good news, interest rates have been rising – but only by a little (as per the slight upturn at the far right of the below 15-year chart):

All of these trends have led to a strong and growing investor preference for growth- oriented sectors (with the money for these new investments being transferred from the more defensive, dividend oriented sectors.

These defensive equities still maintain their fundamental quality and dividends.

However, the growth sectors seem clearly to offer the best opportunities for capital appreciation this year.

The below chart indicates relative performance among US sectors; Canadian sectors follow the same patterns (except Energy) but are not as extreme.

In growth oriented portfolios, the growth sectors deserve higher allocations.


January 19, 2018

MARKET ENVIRONMENT

RATE INCREASE FOR CANADA; BULL MARKET FOR THE US

Another rate increase for Canada. More to come?

As forecast, the Bank of Canada raised short-term rates by another 0.25% this week.

Canada’s economy is strong and growing - With the lowest unemployment since the 1970s.

This is the third rate increase in six months (see the below 10-year chart) and this pushes variable and prime rates to the highest in 9 years.

Anticipation of this (and future) rate rises has boosted the Canadian dollar but is creating concern among many heavily indebted people. (Almost one-half of all Canadians could not service an additional $200/month increase in debt service or other expenses according to a recent survey).

Looking to the future, the Bank of Canada expressed caution about further moves citing risks of a possible ending of NAFTA and to heavily indebted households.

That said, most forecasters anticipate that continued strength in the Canadian economy and labour markets will lead to another two, or perhaps three more 0.25% rate increases this year.

In brief, the squeeze on debt payers will continue ….

Great equity markets for the US; less so for Canada

In the first few weeks of 2018, the (US) S&P 500 index is up a strong 4.8% compared to a decent (but clearly underperforming) Canadian TSX Index at 0.8%.

A strong US economy, benefiting from low interest rates and now from a significant cut in corporate taxation, has accelerated investor confidence.

This has resulted in strong broad markets - in particular, the economically sensitive sectors are benefiting (e.g. technology, industrials, financials).

Note that this increase is being largely financed by rotation of money away from the previously favoured defensive, dividend sectors (e.g. REITs, utilities, telecoms, staples). Rising long term rates also encourages this trend.

The Canadian markets lack a large number of industrials and technology firms and so are relatively underperforming. Further, Canada lacks the tax reform accelerant and could suffer from a breakdown in NAFTA (or, at minimum, severely changed terms of trade with the US).

The below chart illustrates the strong US market outperformance over the past month (with focus on early 2018).

In fact, this Canadian underperformance trend has been evident for at least the past year (see the below chart).

The foreign exchange factor complicates things. The US currency has been falling compared to almost all other currencies (including the Canadian dollar).

So while US investors are posting impressive gains in terms of their own currency, Canadian and other international investors are receiving less benefit from their US investments given the lower value of the USD.

Conversely, US investors see improved performance from Canadian and international investments since these benefit from currency appreciation.


JANUARY 12, 2018

MARKET ENVIRONMENT

A new direction?

Last year saw the slow-and-steady build-up of a stronger economy with more jobs and less unemployment.

Consumer optimism and spending grew as did corporate revenues and profits.

Now, in 2018, high expectations over the impact of the recent US corporate tax cuts are acting as an accelerant to the markets. The major US indices are achieving all-time highs.

That said, not all investments are benefiting.

Higher growth implies higher inflation – and, therefore, higher long term interest rates.

Higher rates lower the valuation of long term bonds (as an illustration, a bond paying 3% is of less value if the prevailing interest rate is now 4%).

Not only is fixed income weakening, but so are the equities of the traditional defensive sectors. These companies continue to be profitable, experience moderate growth and pay sustainable (and growing) dividends. However, in a high growth market, they are viewed as “sources of funds” for reinvestment in sectors which benefit more from the cyclical uptrend.

Growth-oriented portfolios need to be adjusted in view of this changed market environment.

The Canadian Perspective

Canada is not directly benefiting from changes in US tax policy and its market performance is much more muted. And, in general Canada does not have the large industrial, technology and health care companies which are benefiting from the strong economic growth theme.

Canada does have a large energy sector, but it is underperforming the US. While world oil prices are at 3-year highs, Canadian oil is trading at only about 60% of the world price. Significant environmental and local interest restrictions has stopped much of the ability of new energy production to actually reach US and other global markets. Additionally, carbon taxes further harm Canadian oil profits.

The Canadian dollar continues to rise against the US dollar – largely because of the Bank of Canada rate hike (0.25%) expected for next week.

However, there are also early signs of currency volatility related to the renegotiation of NAFTA. This week, Canada initiated a forceful claim against the US at the World Trade Organization (WTO) which governs all world trade. Of course, the US trade negotiators were highly displeased. However, there seems to be increasing conjecture among the Canadian trade leadership that NAFTA will not be successfully renegotiated. If so, this would be negative for the Canadian currency.

We are continuously monitoring changes here and will report as events develop.


January 05, 2018

MARKET ENVIRONMENT

A new year begins …

Early January market trading patterns typically are good predictors of investment trends.

The early results are that most indices continue to set new records in a broad-based advance. The US indices (S&P 500, Dow Jones Industrial Average, NASDAQ) achieve record highs daily. Even the sluggish Japanese market is at a 26-year high.

In brief, the positive markets of 2017 seem to be continuing and with maintained focus on growth themes.

Supporting the market advances is a stream of strong economic data indicating rapid global expansion in the manufacturing and service sectors.

While there is always some possibility of a short-term pullback, the dominant theme is a very solid global economic advance.

Good news/ bad news for Canada …

The good news is that employment continues to rise in Canada and unemployment (5.7%) is at the lowest level since relevant data collection started 40 years ago.

The related “bad” news is that this positive data may encourage the Bank of Canada to continue raising rates.

first opportunity for a (0.25%) rate hike is as early as January 17. Many analysts are forecasting a total minimum of three such hikes in 2018.

As a reminder, increases in the Bank of Canada rate leads immediately to an equal increase in the prime rate.

In practical terms, the interest cost for debt such as variable rate mortgages and personal and home equity lines of credit will likely be increasing soon.

The Declining USD

A low key, but very influential, market factor is the continuing decline of the US dollar (USD) against other global currencies.

In 2017, the decline was a significant 9.5% against a trade-weighted basket of currencies (including the Euro and yen).

The decline against the Canadian dollar (CAD) was about 6.5% last year. (The Canadian and US economies are closely intertwined and their currencies tend to trade closer together).

The same pattern of USD decline is continuing at the beginning of this year. See below.

This is somewhat counter-intuitive given an era of “America First”, strong economic growth, increased employment and wages, and, expected rising rates.

Part of the explanation is that, the rising rate trajectory of the US Federal Reserve is already well-telegraphed and is already included in future US economic projections. Rising rates in 2018 and 2019 is already “old news”.

The more important factor is that other major economies (Europe, Japan, China, emerging markets) are now growing even faster than the US.

Since their growth recoveries are at an earlier stage than the US, and their financial assets are less expensive, their markets are experiencing major international fund inflows.

In the markets, it is usually the directional change which matters most (rather than absolute levels). Although the US growth trajectory is well-established, it is the nascent surge in international growth which has attracted investment prioritization.

The US tax package was a much publicized Republican political victory; however it is not expected to have a material impact on the US economy.

The corporate sector was already profitable and able to finance any desired developmental projects or capital investments. The tax windfall (financed mostly by increasing national debt by $1 trillion) will likely mostly benefit shareholders i.e. through increased corporate dividends and buybacks. A few companies did announce (small) pay raises to employees associated with tax reform – however, these are primarily corporate strategies to gain favour with the US administration.

The lower USD is supportive of several investment themes:

  • US multinationals becoming increasingly profitable since (i) their products are cheaper (more competitive) when priced in the local currency of their rivals and (ii) their international profits increase when translated back in to USD
  • Commodities (energy, materials) which are always priced in USD, increase in value, since they become relatively cheaper to foreign buyers with rising currencies
  • Emerging markets investments benefit from (i) strengthening local currencies and (ii) commodity exports.


December 22, 2017

MARKET ENVIRONMENT

2017 was quite a year …

Despite some (well-publicized) disaster scenarios, 2017 was a very pleasant strong year for many investors.

Broad-based global economic growth translated into employment and wage growth which, in turn, resulted in increased consumer spending and accelerated business activity.

response to this economic expansion, central banks raised short term rates a little (0.50% in Canada, 0.75% in the US) and with careful communications.

Predications to the contrary, there were no significant increases in either inflation or long term rates.

Higher corporate revenue and profit growth, combined with continuing low interest rates, produced strong market gains.

These ideal global conditions also supported unusually low volatility. The all-country index moved more than +/-1% on only 8 days this year; there were no days when the market moved by 2% or more.

Much attention has been focused on the impact of the recently passed US tax package.

The broad consensus is that it will provide some mild, short term economic benefits – but that the main beneficiaries should be shareholders.

For many large public corporations, the reduced tax costs will provide a profit windfall which will likely be returned, in large part, to shareholders via share buybacks and increased dividends.

Of course, there are always uncertainties in any market.

However, overall, as we head into 2018, we have quite a good starting point.

We wish all of our readers health, wealth and happiness in 2018!

The next issue will be published on January 5, 2018

December 15, 2017

MARKET ENVIRONMENT

It is essential to be mindful of risks in the market environment and to evaluate them carefully.

That said, fears can often be overblown and they can lead investors (and regulators) to make poor decisions.

Should we be afraid of rising short-term rates?

Some media have reported worry about the potentially damaging effect of rising short-term rates. The concern was that the economy did not have the strength to cope with higher interest costs.

In the two years, since the first of five US rate hikes we confirm the reality that there was been remarkably little disturbance of the economy or capital markets:

  • The yield on 10-year US Treasuries increased only a tiny amount (0.13%) over the two years.
  • The S&P 500 equity markets did very well (increased by 32.3%)
  • Inflation held steady at under 2%
  • Economic growth held steady
  • US unemployment declined every month and is the lowest in decades.

The US Federal Reserve has already laid out their projected plan for increases in 2018, 2019 and 2020. These future moves are deliberately gradual. Well-telegraphed and well integrated into current market markets.

The Bank of Canada does not publicly publish its short term rates projections i.e. given the more changeable economic conditions in the more commodity-dependent Canadian economy. Nevertheless, the same trends are clear – only slower.

Should we be afraid of high Canadian consumer debt?

A couple of ratios suggest that Canadians seem the most indebted in the world.

For example, household credit as a ratio to disposable income is now over 171%. In other words, there is an average $1.71 in mortgage and other credit debt for every dollar of household disposable (i.e. after tax) income.

The similar US ratio was only 130% when their housing market collapsed.

This is causing apoplexy among certain economists and government regulators.

A common (US) hedge fund bet is to short Canadian banks in expectation that Canadian housing prices will soon collapse and bring utter ruin to Canadian banks and the domestic economy in general.

Despite these views, Canadians continue to be very responsible with handling their debt. For example, only 0.24% of all Canadians with mortgages are three months (or more) in arrears. This low level has been consistent for years.

What are the economists and hedge funds missing?

  1. They are not considering the “ability to pay”. Canadians have been comfortably paying 13% - 14% of their disposable income to service their mortgage and other debts. And, this ratio has been steady since at least 1990 (when data collection began).Clearly, in a low rate environment, the size of the debt is much less important that the ability to comfortably pay the monthly bills
  2. Also, as a result of lower current rates, the percentage of each payment which repays principal has been increasing. In 2017, of the 13.9% of disposable income devoted to debt payments, more than half (7.6%) is actually a repayment of capital.In effect, Canadians are being economically intelligent by using their debt payments as a disciplined, low-risk, tax efficient wealth building plan (i.e. building home equity by paying down the mortgage).
  3. Economists do not differentiate between productive debt (i.e. buying an asset expected to appreciate) as compared to consumption debt (i.e. Caribbean vacation paid by charge).

For many Canadians, using credit carefully to buy an appreciating asset (like a home) is an intelligent way to build wealth.

Sometimes fears can directly impact the real world

Does looking at the below 30-year chart of continuous falling rates, suggest that rising rates are an imminent danger?

Despite the above discussion, federal regulators are still concerned about Canadians ability to handle sharply higher rates (should these ever materialize). As a result, on January 1, 2018 they will insist that new mortgage applicants be tested for their ability to pay their mortgage at the rate 2% higher than the rate actually negotiated with their bank.

This extra “stress test” will depress the spending capacity of future homebuyers and constrain home prices.

December 8, 2017

MARKET ENVIRONMENT

INVESTING 301: ROTATION or REBALANCING?

When a fundamentally strong equity has a major price change, it’s essential to understand the underlying changed market dynamic.

Generally, there could be either of two factors in play:

  1. Rotation

Here, a company or sector loses favour (usually because of lower relative growth expectations) and investors sell it to reinvest in more attractive sectors.

While the corporate earnings and yield may continue to be solid, the market places less relative value on them. This could lead to a long trending valuation decline.

From a portfolio growth perspective, such investments would become less attractive.

  1. Rebalancing – A highly successful investment has outgrown its intended maximum position size and needs to be pared back to that maximum.

Highly successful investments can grow to a size which clearly exceeds the target maxim portfolio allocation. Here some profit-taking is required to trim back the investment to the maximum level associated with proper risk management.

In this case, the reduction is one time only and, when complete, the investment will likely resume its price expansion.

This has been an excellent year for many investments and, for the past couple of weeks, their market prices have been restrained due to year-end rebalancing.

Let’s illustrate by considering the impact of the recent rebalancing of the Hong Kong market the “Hang Seng”.

Like many other equity markets, the Hang Seng does not allow any one constituent to grow to more than 10% of the index (i.e. as measured on December 1st).

However, this year, some high growth tech companies doubled in value and, by consequence, grew to 12% of the index.

Hang Seng index investors were forced to reduce their positions to the 10% level and this created a short-term price decline.

However, as expected, after a couple of weeks, market prices for these equities resumed their price increase.

From a growth portfolio perspective, periods of rebalancing are not significant (and perhaps could present a “Buy Low” opportunity).

December 01, 2017

MARKET ENVIRONMENT:

The markets rose again in November (as did client portfolios). 

Certain reliable indicators suggest that the bull market will continue. 

Mediocre Investor Expectations

A great risk in extended strong markets is that happy investors will eventually become unrealistically optimistic and increase prices to an unsustainable (“bubble”) levels.

And, as history and experience has amply shown, expanding bubbles inevitably burst (at some point).

However, investors remain generally wary of the markets, despite the recent good returns, and have only mediocre expectations for the future.

As per the below chart, investor sentiment is only average.  (This corresponds to market valuations which are only slightly higher than average).

Continued investor caution supports the future durability of the bull market.

We will continue to monitor this variable (among many others) as an early warning of the build-up of speculative excess.

Lack of Market Volatility

The relative calmness of the markets is also considered as evidence of a prolonged bull market.


A study of 43 global market corrections (drop of 10%+), since 1990, has shown that that significant volatility preceded every significant market decline. 

In technical terms, the “VIX scale” of market volatility measured over 15.

Current measures are more than one-third below that level.

US Tax Reform?

At the time of writing, it was unclear if the Senate would approve tax reform and in what format. 


If approved, the bill  would then require (i) reconciliation of the differing Senate and House bills followed by  (ii) Presidential approval, before the dimensions of this now 500+ page legislation would be assured. 

Most non-partisan observers have concluded that the tax plan would have only minor impact on the real economy:

  • Many large businesses have stated that they already have sufficient revenues and profits to achieve their growth targets, and, that additional tax savings would go directly to shareholders (e.g. dividends, share buybacks).
  • The result of the last corporate tax cut (2004), which allowed US multinational to repatriate their foreign profits without excessive tax penalties, 90% of the cash repatriated to the US was targeted to shareholder benefit.
  • The neutral Joint Committee on Taxation estimates that the current Senate bill would only contribute a net 0.008% to GDP growth over the next decade (i.e. total impact of only 0.8%)

Under any tax reform scenario, investors would benefit (lower personal taxes, lower estate taxes, higher share prices and dividends) and so the market has been rising in anticipation of these direct benefits.


November 24, 2017

MARKET ENVIRONMENT

Is the Tech Rally for Real?

The tech sector has performed very well so far in 2017 - producing returns not seen since the 1990s. (see below chart)

Quick notes:

  • The global tech sector has doubled the returns of the broader world indices
  • The top 8 global tech companies have increased, as a group, by $1.4 trillion in market cap this year (equivalent to the combined GDPs of Spain and Portugal).
  • The market cap of the US tech sector alone (excluding major private companies such as Uber) is larger than the entire Emerging Market Index or the Eurozone Market Index.
  • Markets having larger tech sector membership (US, Emerging Asia) have done very well this year. Markets with fewer tech companies (Canada, Europe) have underperformed.

Is this a repeat of the late 1990’s “dot com” boom and bust cycle?

Not likely.

  1. For one, the large tech companies recording major revenues and profit growth. On average. US internet companies have grown revenues over the past three years by 35% annually (Similar tech companies in China have been growing by 50% annually). In the late 1990s, markets’ excess optimism about future revenues and growth drove stock prices ever higher. At the high point, the market was willing to pay 52 times expected annual profits for shares. Now, the current generation of tech companies are generally meeting (and exceeding) future expectation. At this point, the market is generally willing to pay only about one-third of that at the high i.e. 19 times expected profits.
  2. The confirmed earnings growth rate (21%) this year for tech was double the next highest sector. For investors seeking growth, tech is the place to be.
  3. The giant companies continue to build long term competitive advantages from an accelerating critical mass of users, user data, processing power, profits, and R&D spending. Google alone has 10,000 Ph.D. graduates working to enhance its offerings.
  4. The broad economic environment is quite healthy. There is no obvious reason for consumers or companies to reduce their tech spending.
  5. Tech companies have very conservative balance sheets with almost 30% (and growing) cash positions (compared to about 10% for the S&P 500)
  6. Tech companies have been using some of their cash to buyback significant amounts of their shares – which makes their remaining shares more valuable.

Also, if the proposed US tax reform package is approved, then the major tech multinationals will repatriate significant volumes of their cash to the US and are expected to accelerate their buyback programs as a result.

November 17, 2017

MARKET ENVIRONMENT

The continuing multi-year market rise (which has taken place with relatively minor volatility) still seems to worry some investors.

(It is likely that the two previous bear markets (2000-02, 2008-09) continue to have considerable emotional resonance.

To achieve a more sound perspective on the current situation, we can view the below chart illustrating market volatility over the past 90+ years.

As we can see (far right of the chart), volatility is at historically low levels. Only 1963 was lower.

What does market history suggest about the future of our current markets?

1963 featured much more direct geopolitical risk than today – and the market did not care.

The highly popular President John F. Kennedy was just assassinated. The nerve-wracking Cuban Missile Crisis occurred just the previous year. Nuclear war with Russia was considered a high possibility event; any city in North America or Europe was potentially a target of a nuclear bomb. Schools of that era had mandatory preparatory drills for moving to emergency bomb shelters.

In this context, major current concerns of a possible North Korean strike on Guam are misplaced.

The era of low volatility continued for at least a decade (the duration of the Cold War). This was not withstanding other high profile events including the assassinations of RFK and Martin Luther King, major civil unrest in the US (urban riots, Vietnam protests).

It is important to note that a continuing equity bull market continued during this low volatility (but high geo-political tension) era. Even the prominent rise in interest rates during this period did not dent the bull market.

The core conclusion would be that solid economic fundamentals (economic and corporate growth) are key drivers of steadily growing markets. Geopolitical news is largely extraneous noise.

What is a “Sharpe Ratio”? Why does it matter?

The “Sharpe Ratio” (designed by Nobel Laureate William F. Sharpe) is the industry standard measurement for risk-adjusted return.

The holy grail in investment management is having a high Sharpe Ratio i.e. the highest possible returns commensurate with low volatility.

The Sharpe Ratio of the recent markets is calculated at the 99.7% percentile. In other words, over the course of market history, only 0.3% of market periods have been more attractive i.e. the bull markets of the 1950s – 60s and of the mid-1990s)

This is a comforting observation.

Of course, at some undefined future year, volatility will grow and performance will weaken. But nothing is visible on the horizon.


November 10, 2017

MARKET ENVIRONMENT

Solid foundations

Global markets continue to achieve all-time highs combined with the lowest volatility since 1968.

For some, this pattern of ongoing success is worrisome.

Certainly, various media, searching for some newsworthy drama in this peaceful market environment, have offered discussions on “what if disaster suddenly appears” scenarios.

In fact, the strong market environment simply reflects a strong economic and corporate environment:

  1. Inflation and long term interest rates are constrained by a glut of global savings (reflecting investor and consumer conservatism) combined with the production efficiencies from technology and global integration
  2. Short term rates, which are still historically low, are rising only carefully, gradually and in a manner well communicated to the investing public.
  3. The massive economic stimulus from the global central banks, applied in massive amounts for almost 10 years is finally having a deep impact. All major global economies are moving ahead synchronously.
  4. Leading Economic Indicators (which have been proven by economists to accurately forecast future growth) are all positive as are readings of GDP.
  5. Corporations are increasing their profits (the recent Q3 results showed an average 6% earnings increase) which was even higher than expected by the optimistic analysts. Target prices are being raised as a result.
  6. In turn, corporations are hiring. Unemployment is at multi-decades lows (even for people with high school education or less).
  7. Workers are also consumers and this supports continued spending growth.
  8. Market valuations are generally on the higher side of average - but not outlandishly so. The growth of earning generally validates the growth in equity prices.

Added to the above is rising oil prices (good for energy company investors) and typical year-end positive sentiment (good for all investors).

More stable trading environment

Generally, the boom-and-bust market cycles have reflected more of the hyperactive passions of young (inexperienced) traders rather than changes in corporate fundamentals or dividends (which tend to be fairly stable during most periods)

Perhaps the dominance of more calm (and mature) investment trends are due to:

  1. The replacement of aggressive young traders at many of the major hedge funds by computer-based algorithmic trading programs;
  2. The (US) government-mandated closure of many of the major (US) banks proprietary trading desks. These “desks”, which the banks used as aggressive own-account trading profit centers, added considerable market volatility.

How important are headline dominating geopolitical issues in determining the future of markets?

It is not the headlines that matter most (except for election changes and key referendums).

Political rhetoric is exciting, on a news cycle basis, but has little impact on corporate profits or dividends.

In fact, it is the slower-working and lower-key layers of policy (immigration, trade, infrastructure, training and education, industrial development).

What would be early signals of significant market decline?

Regardless of positive current conditions, we are always alert for early signs of negative change.

Such signs would include real observations (not the odd forecast) confirming such factors as:

  • Rising inflation;
  • Significant interest rate increases;
  • Signals of economic slowdown or incipient recession;
  • Declining corporate profits;

Euphoric investment environment (leading to outlandish share valuations a la 1999)

It is true that markets will decline at some point in the future. However most analysts consider this this to be perhaps 2-3 years away at minimum.

Ironically, the more worries are expressed about the positive market conditions, the stronger the likelihood they will continue for the foreseeable future.

How would we deal with major signs presaging an imminent market decline?

We would follow the same steps that we used on behalf of our clients during the 1998, 2000-02 and 2008-09 bear markets, that is, move quickly to reduce risk, increase cash and fixed income and defensive equities.

All investments are “liquid”, that is, they can be sold quickly if circumstances dictate this.

We do not believe in passive buy-and-hold strategies in the face of a high likelihood of a steep market decline.

Of course, bear markets do not last forever (that’s why the markets now are at all-time highs).

Once our portfolio were appropriately risk-managed, we would monitor the markets for the eventual positive reversal of the warning signs listed above. This would provide the signal for an effective Buy Low strategy for high quality companies with our large accumulated cash position.


November 3, 2017

A COLLECTION OF OBSERVATIONS…

This week we survey various significant items over the past week

New Chairman for the US Federal Reserve

Janet Yellen’s term will end in February and Jerome Powell has been selected to assume her role.

Mr. Powell has been a Fed member since 2012 and has always voted with the consensus majority. His selection allows President Trump to put his own imprimatur on this key appointment, maintaining assurance of policy continuity.

The markets considered Mr. Powell a well-known and safe candidate and there was no market impact.

Anecdotally, President Trump seems to be increasingly watchful of (and supportive to) the market uptrend which he seems to consider as a personal report card on his success in office.

Rates Rises and Currency Changes

The sharp rise in short term rates in Canada (while the US was standing pat) was reflected in the sharp rise in the Canadian dollar as shown in the below chart (May to August).

However, the Canadian economy has been cooling (the higher currency could be a factor) and another rate rise this year is considered unlikely. However, the US Fed, this week, hinted strongly of another rate rise in December.

Result: US dollar rising, Canadian dollar falling.

It’s for Real

Almost all tech stocks have done exceptionally well in 2017.

For some, this has led to concerns that this echoes the exaggerated tech expansion in the late 1990s (which eventually led to a sharp market collapse).

However, for investors of 20 years ago, the future ability of technology to drive actual business profits was only a matter of speculation. On the other hand, many tech businesses are now well established and revenues and profits are growing exponentially.

Some examples from recently announced Q3 earnings:

  • Alibaba (61% 1-year revenue growth in core e-commerce operations; 99% growth from hosting cloud computing; 22 million more users)
  • Amazon (35% 1-year growth in North America, 42% growth in hosting cloud computing)
  • Facebook (47% 1-year increase in revenues, 79% increase in profits)
  • The consolidated semiconductor industry’s revenues rose 35% over the past year

Further, all of the above forecast similar or higher future growth.

In turn, this higher growth supports higher equity valuations.


October 27, 2017

THE HIGHER IT GOES ……

The Canadian and US markets continue their steady advance (and with about the lowest volatility in history) as per the below 1-year chart for the Dow Jones Industrial Average.

There has not been even a mild pullback (3%) for over 245 days - a historical record. (On average, even in bull markets these minor dips occur every 90 days or so).

This continued performance has brought confidence to some – but nervousness to others.

Many veterans of the major bear markets of 2000-02 and 2008-09 have come to believe that prolonged good market news must inevitably result in nasty downturn.

What has created this strong market environment?

Ironically, this very cautiousness of investors is supportive of the continuity of current market growth.

The post 2008 economic recovery has been the slowest of any post-recession period, (see below dark line). The good news is that this has created a “Goldilocks” type environment where economic growth is strong enough to create rising corporate profits (and share values) but not so strong as to engender inflation and the interest rate rises which usually incite a bear market.

The prolonged slow-and-steady recovery has been mirrored in the prolonged slow-and-steady growth of the stock markets.

In fact, using the “inverted yield curve test” (i.e. where short term interest rates became higher than long rates), RBC Capital Markets predicts the possibility of recession in the next 12-months at only 2.7%.

Corporate earnings are healthy and growing as reconfirmed by the current round of quarterly (Q3) results.

Consumers, aided by their prudence and low interest rates, have the most solid financial basis since data started being collected in 1980.

Similarly, the labour market is the best it’s been in decades.

Bear markets are the result of expected economic recessions. Note that, as per the below chart, there is no indicator of this in the foreseeable future.

Looking forward

It is rare for markets to have prolonged periods of consistently strong appreciation with low volatility.

Only the 1950s and 1990s were comparable.

Market history from those eras indicates that these positive trends can endure for several years.

Of course, although there are no storm clouds on the horizon, we’ll still be vigilant.


October 20, 2017

MARKET ENVIRONMENT

NAFTA?

President Trump has already pulled the US out of the Trans-Pacific Partnership Trade Agreement and the Paris Climate Accord and is at the point of exiting the Iran Nuclear Agreement.

It is not impossible that he will, similarly, find a reason to exit NAFTA (the free trade agreement between the US, Canada and Mexico) which he has already proclaimed is “the worst deal ever”. In fact, this week, the head US trade negotiator announced that the NAFTA countries would be “just fine” if the agreement disappeared.

Much of this could simply be posturing. In his book The Art of the Deal, the now-President wrote that the best negotiating strategy is to start with your extreme demands and, subsequently, to retreat only to the minimum degree possible.

While this could well be the current situation with NAFTA, we have to be mindful of the possibility that NAFTA could entirely disappear. How should investors consider this risk?

What is at issue?

Perhaps the most contentious US demand is for the removal of neutral international trade dispute panels.

Removing these impartial referees would give the US sole and final authority to make punitive trade actions against Canada and Mexico at their discretion. There would be no appeal mechanism.

Note that, as per the below chart, the US is aggressive in trying to punish others for alleged trade infractions. In fact, this year, Boeing demanded an 80% tariff against Bombardier for alleged government support in helping the Canadian company win an airplane sales competition to Delta Airlines (a competition that Boeing did not even participate in). The US trade authorities increased the tariff amount to 300%. Under the new US demands of NAFTA, there would be no appeal mechanism.

A quick background …

Prior to NAFTA (1988) Canada already had a successful bilateral trade deal with the US, the Free Trade Agreement (FTA) which essentially eliminated duties between the two countries.

decision to subsequently add Mexico to the FTA came at the demand of the US (Canada was reluctant and, foresightedly, saw Mexico as a rival for the US market).

The US objective at the time was to address their Mexican illegal immigration problem by strengthening the domestic Mexican economy i.e. through jobs and prosperity delivered by the proposed NAFTA. (That strategy apparently is now being superseded by simply building a high wall).

any rate, if NAFTA disappears, the original FTA, which was never abrogated, is still in effect. A 2007 study showed that NAFTA added essentially no new net benefit to Canada; the restoration of the FTA would not have a major impact on the Canadian economy.

Even if the US exits the FTA (unlikely since Mexico is the real political target), they are bound by the rules of the World Trade Organization (WTO) which regulates global trade. According to the WTO, all member countries (including the US, Canada and Mexico) benefit from relatively low (average 2.5%) common trade duties. In fact, since Mexico is designated developing country, it would still be given trade preferences relative to the US.

Given this, it is unlikely that globally integrated firms will find it worthwhile to uproot complex manufacturing operations and destroy complex logistics chains simply to save the small duty charge.

The political perspective …

1. The next round of NAFTA negotiations is not scheduled until early 2018. It is unlikely that the President will take radical action before then.

2. Many members of Congress (regardless of party) want to continue the benefits of NAFTA. This includes those from Republican-voting farm states (Iowa, Kansas) and border states (Arizona, Texas).

3. The trade issue is especially politically acute because political campaigning for the US elections will start in early 2018 (the elections include all of the House of Representatives and one-third of all Senators).

4. Trade decision-making powers are blurred in the US. The President may have the power to formally announce the start of a 6-month process of withdrawal from NAFTA, but, this may be essentially symbolic if Congress does not vote to rescind the underlying legislation. The Trans-Pacific Pact could be dropped unilaterally since it was never sufficiently developed to proceed for initial Congressional approval.

5. US business also opposes the aggressive US trade demands. They’ve warned that ending NAFTA would be a “debacle”. 80% of all US small business similarly favour free trade.

The global trade perspective …

Canada’s new Free Trade agreement with the European Union provides special entrée into this huge market (larger than the US market). Also, Canada is still actively negotiating the Transpacific Trade Agreement which will likely proceed without the US.

The bigger picture is that Canada (and Mexico), like most other countries, is working to broaden its global trade relationships with other countries and decrease its reliance on the US.

The market perspective …

The market seems unworried about possible impact on Canada of NAFTA dissolution at this point, (The markets, however, are fairly dour generally on Mexico).

Also, the industries which would be most disadvantaged by the disruption of the trade agreement (e.g. automotive and auto parts) continue to trade at their highs.

In summary …

The NAFTA negotiations will remain acrimonious and receive great political and media attention for the next several months. However, even the worst case scenario, is not that difficult for Canada.

We will, of course, continue to monitor this closely.

October 13, 2017

MARKET ENVIRONMENT

The obvious synchronized global economic growth is proving more powerful than the various geopolitical risks which have received recent media attention.

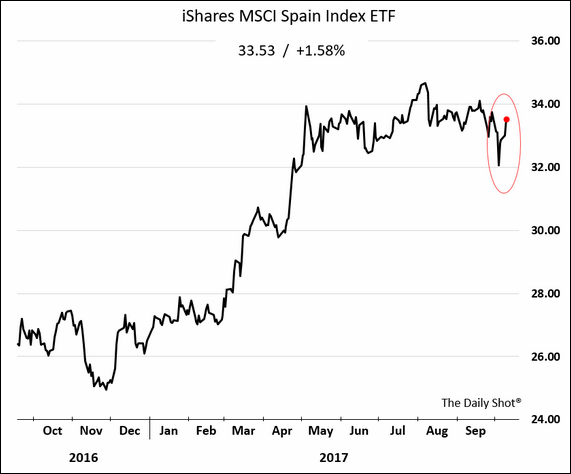
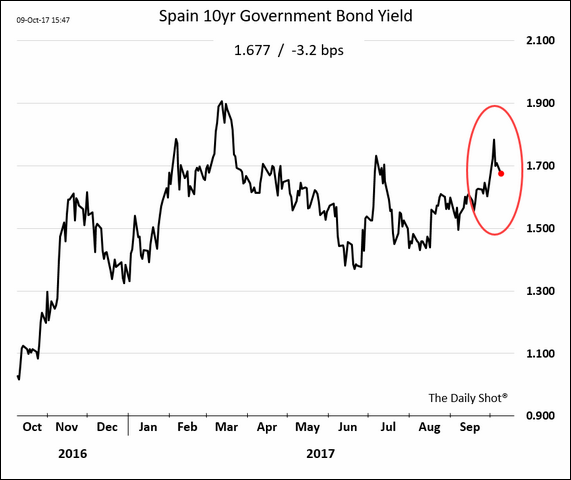
For example, last week, a major region of Spain (Catalonia) voted for succession with scenes of police clashing with angry protesters and voters.

However, as per below, the impact on Spanish equities and government bonds was miniscule and quickly reversed.

Another hot topic recently has been North Korea and the (perhaps) threat of nuclear war. However, this has not had much of a market impact - even in the region.

While South Korea, especially its capital Seoul, is within easy range of thousands of North Korean artillery positions, the fear of imminent war has not upset their stock market (the Kospi) as illustrated below.

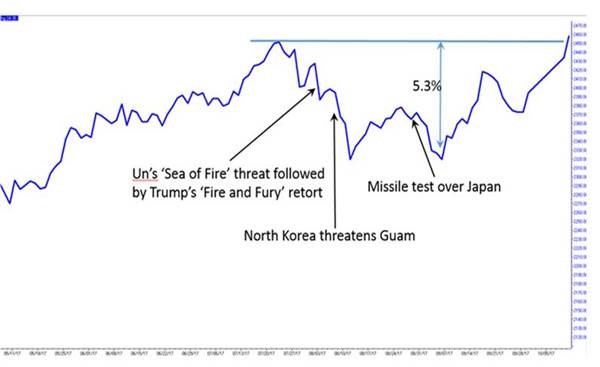
Similarly, Japan, which actually experienced North Korean nuclear missiles overflying its territory is, nevertheless, trading at multiyear highs.

What is the underlying dynamic?

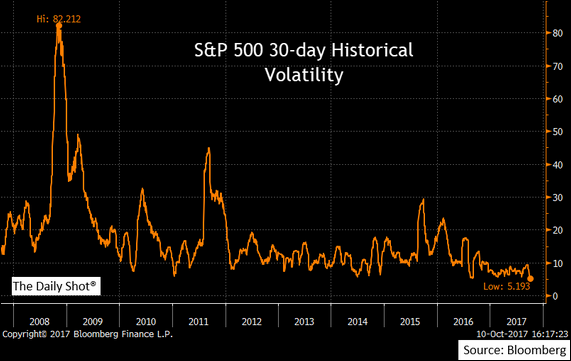
This consistent low volatility, despite significant geopolitical risks has been sustained for several months and across most markets. Its historical decline is illustrated in the below chart.

While the underlying dynamics are unconfirmed, the key factors could include:

Rational, gradual and carefully stated communications from the central banks;

Less market influence from easily excited young traders; more importance to the mathematicians and other programmers of the computer trading algorithms;

Generally favourable economic conditions, low interest rates, growing corporate profits (independent of geopolitical scares).

JUST FOR FUN

The below chart comparing obesity rates around the world has no particular importance to the market environment but is interesting anyhow.


October 6, 2017

MARKET ENVIRONMENT

Happy Thanksgiving (Canada) and Columbus Day (US).

The broad markets are continuing their upward trend and with little volatility.

By Thursday, the S&P 500 had completed 6 days of successive record highs – a record going back to June, 1997 (which then was in the midst of a prolonged multi-year bull market).

Similarly, current volatility has reached all-time lows (with no pullback of 5% within the past year).

(The broad Canadian markets have been more volatile due to its higher proportion of energy companies, miners and other commodity companies. We essentially avoid these sectors though).

This consistent (US) growth pattern is supported by continuing strong economic and corporate fundamentals and carefully constrained interest rates.

Market stability is also supported by the increased importance of algorithmic computer based trading. Trading decisions seem now increasingly driven by dispassionate mathematical calculation and less by young traders’ emotion-laden reactions to the news-of-the-day.

The perverse market reactions to mass gun murders …

Traders react perversely to gun-related tragedies such as that in Las Vegas this week.

As background, prior to last year’s US election, gun lovers feared the expected presidency of Hillary Clinton. In expectation of future tightening of gun ownership laws, firearm sales increased dramatically; manufacturers’ profits and share prices rose sharply.

However, the election of a Republican majority Congress and Presidency brought confidence that ownership would not be restricted. This lowered the urgency of adding to personal armories and revenues of companies like American Outdoor Brands (parent of Smith & Wesson) fell by 22% and profits fell by 50%. Share prices, of course, declined sharply.

However, (similar to previous gun massacres in Sandy Hook, Colorado, Orlando and San Bernardino) the recent Las Vegas shootings led to new expectations of pressure on politicians to tighten regulations. Once again, gun lovers are expected to rush to buy more firearms before the imagined deadlines. Share prices are up 5% in anticipation of rising revenues and profits.

At any rate, we do not invest in gun manufacturers (as an ethical principle).


September 29, 2017

MARKET ENVIRONMENT

Three surprises for speculators this week…

1. The Bank of Canada (BOC) is reluctant to raise rates further.

The BOC raised rates in back-to-back meetings (July, September) and speculators expected this aggressive pattern to continue.

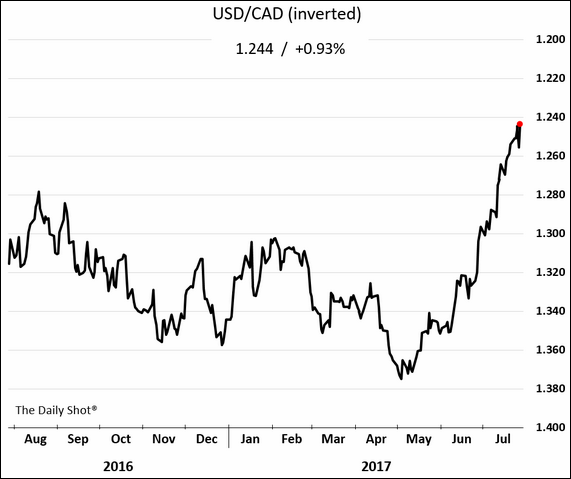
Since foreign exchange is often correlated to the relative national interest rates, traders sought to profit by holding the highest level of Canadian dollars in 5 years.

However, Stephen Poloz, the BOC Governor, effectively squashed this speculation by announcing that he was neutral (“data dependent”) on future increases.

The Canadian dollar immediately declined on the news.

2. However, the US Federal Reserve will likely raise in December.

Speculators have avoided the US dollar recently in their belief that the Fed would continue to hold rates steady for the foreseeable future.

However, Janet Yellen, in her speech this week strongly indicated a commitment to a rate rise later in 2017. (There are likely an additional three more rises planned in 2018).

The US dollar immediately rose against all other currencies on this news.

3. There will likely be some form of US tax cuts/reforms and this will boost economic growth.

The repeated failure of the Trump administration to repeal Obamacare led to speculation that they would also be unable to deliver on their (much desired by the markets) pro-business agenda.

However, on Wednesday, the administration did announce a (high level) proposal for several substantial corporate and personal tax changes.

Realistically, there will certainly be extensive political haggling and reshaping of the tax package before its final approval.

However, the increased confidence that there will be significant tax-based economic stimulus has lifted the share prices of companies in the economically-sensitive sectors e.g. financials, industrials, energy and materials, small caps and value stocks.

Coming soon …. Our Facebook Page

We’re now beta-testing our business-oriented Facebook page.

We intend this to be a sort of “vision board” where we provide a constant stream of background information on the underlying technology, socio-cultural, demographic, consumer and other trends which are shaping our world.

Stay tuned for a formal launch.


September 22, 2017

This week’s post was written jointly by Patrick Fisher and Alessandra Naccarato of our investment management group.

MARKET ENVIRONMENT

The Great Unwinding

As the global economy strengthens, central banks continue to withdraw the extraordinary stimulus they put in place to defend against the potentially dire impacts of the Great Financial Crisis (2008- 09).

This week, the US Federal Reserve announced a plan to start the reduction of some of their giant ($4.3 trillion) stockpile of government bonds and mortgage backed securities which they had amassed through their earlier “ quantitative easing” (QE) programs.

As a reminder, although central banks have direct control over short term rates (and can lower these rates at will to stimulate consumer and corporate borrowing) they have no legislative power over longer rates which are set by market trading.

QE has been the process whereby the US Federal Reserve acted as another (very large) market player and they, themselves, purchased long bonds on the open market.

By adding to the buying pressure, the US Fed raised the price of bonds which had the consequence of lowering their yield.

In this way, the central bank ensured low yields across all durations. This has been very helpful in fostering the current economic and market recovery.

The Fed had long ago stopped one part of its QE program (i.e. it was no longer adding to its net reserves). However, whenever one of their bonds matured, then the Fed bought sufficient new bonds to compensate.

In effect, their reserves have been neither growing nor shrinking.

That will end in October when an increasing number of maturing bonds will not be automatically replaced.

Since the Fed will be a much less active buyer in the bond market and, so, longer yields may rise a little.

The Fed is being extremely careful not to frighten the normal skittish bond traders. The changes were discussed months ago and the relative adjustments are relatively small.

So far, so good…

The market reaction to this news (which was essentially nothing) is a good indication that the Fed has both effectively communicated and engineered what the market views to be a successful ending of QE.

But that’s not all…

This month the Fed also updated its projection as to the level of future interest rates.

Interestingly, they showed that interest rate increases are likely to end at a lower point that previously thought (i.e. low interest rates for longer is now more likely).

Citing continuing low inflation, this is a good signal for equity investors since the chance of a lower terminal rate means that the Fed is less likely to “overtighten” and damage the economy.

That said, the Fed also indicated the potential for another 25 basis point increase to the overnight rate later this year.

As a result, US 10-year bond yields moved slightly higher to the 2.28% range (but are still lower than where they started the year).

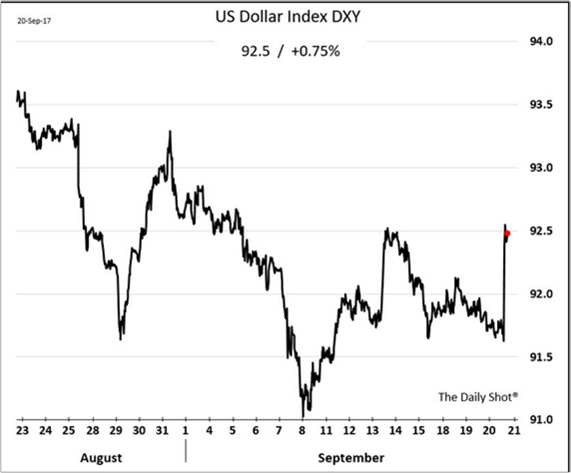
Traders purchased US dollars (which has been surprisingly weak this year) thereby increasing the value of the USD against a basket of currencies including the Canadian dollar.


September 15, 2017

MARKET ENVIRONMENT

Several of the risks that had earlier worried traders have been either bypassed or deferred:

  1. Concerns about crossing the US debt ceiling, which could cause a systematically damaging default on its debt obligations, has been deferred.  While the new deadline is formally December 8, the US Treasury has explicit permission to use “extraordinary measures (i.e. arcane accounting and debt management procedures) after then to effectively delay the date that this issue has to be addressed. In fact, this issue will not be raised again until next March at the earliest.
  2. Hurricane season may have passed its peak without the mega disaster feared by worried traders. Hurricane damage by Harvey and Irma will depress economic growth on a national US level in the short term. However, the recovery and repair efforts will certainly provide subsequent economic stimulus.
  3. Although the US government fiscal year starts on October 1, the required passage of the US budget has also been deferred to December. Delay of budget approval would require the short-term closing of certain non-mandatory government services.However, it is not uncommon for the US government to temporarily close itself down during periods of political wrangling, and, the markets generally are not greatly vexed by these events.

North Korea and terrorism remain very salient issues of political and social concern. However, the markets seem to have inured themselves to these macro level events and they no longer have a material impact on equity pricing.

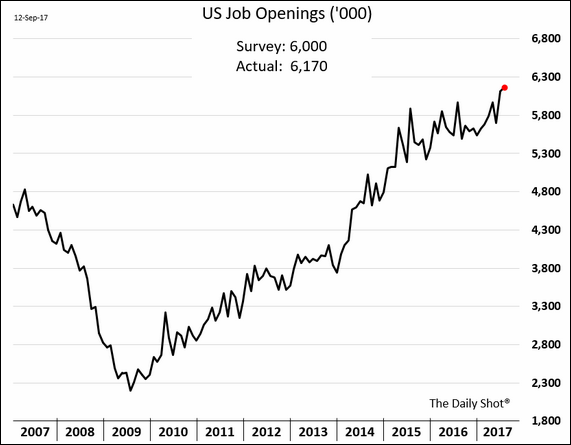
Regardless of all of the above, the global economy continues its fundamental progress. The below chart, showing the rise in new US job openings, illustrates this upward trend.

Recently, there is some optimism that Washington will bring forward their intended tax reform legislation as the keystone of the eagerly anticipated pro-business economic agenda.

While the final outcome of this initiative is yet to be determined, greater optimism for stronger US economic growth is translating into a (mild) increase in the US dollar (see below).

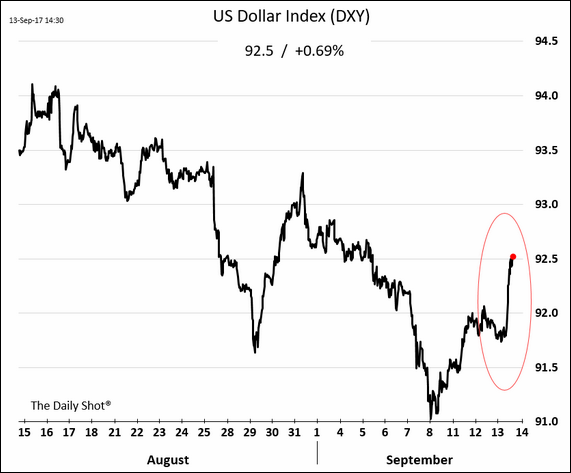
This stabilization of the US currency is welcome for Canadian and international investors holding US assets i.e. since value of these US assets had recently been in decline as viewed from the perspective of their own domestic currencies.


September 8, 2017

MARKET ENVIRONMENT

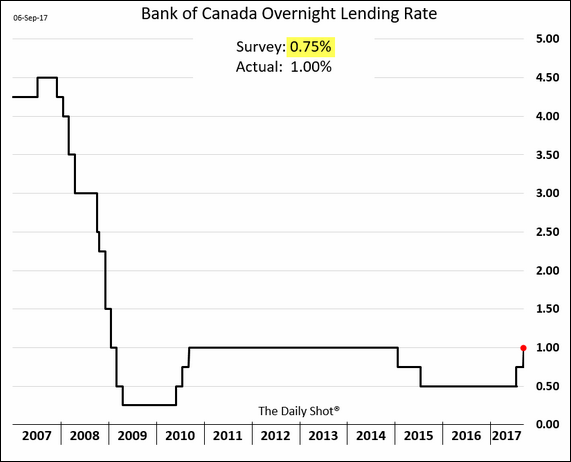
The Bank of Canada raised short-term rates by another 0.25% based on strong domestic growth. This follows a similar rise in July.

The rates are still exceptionally low by historical standards (see below chart).

Increased Interest Costs

Canadian banks immediately raised their prime rate by the same amount (0.25%) thereby raising interest costs for all types of variable rate debt (e.g. home equity credit lines, variable rate mortgages).

In concrete terms, the monthly cost of $100,000 of variable debt is up by about $12.

However, there was less impact on the longer term interest rates (which are set by the markets). The 5-year and 10-year bonds only increased by 0.10% and remain in a trading range which started in July.

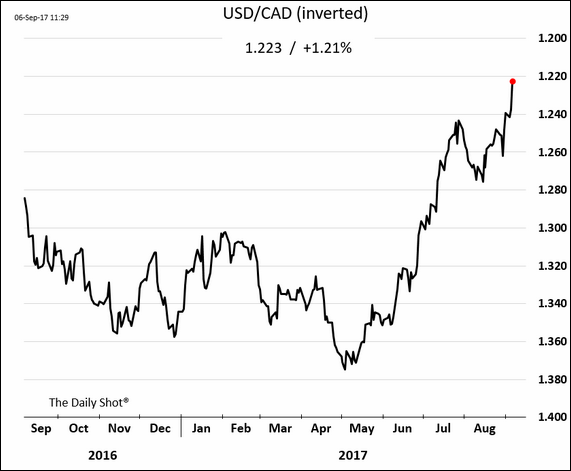
Higher Canadian Dollar

Faster Canadian economic growth and higher rates, combined with uncertainty and lower growth in the US, is pulling the Canadian currency (CAD) higher.

As per the below chart, the CAD is up:

  • 2.7% since the Wednesday rate announcement;
  • 13.3% in the past four months (i.e. when the Bank of Canada first signaled the potential for rate increases).

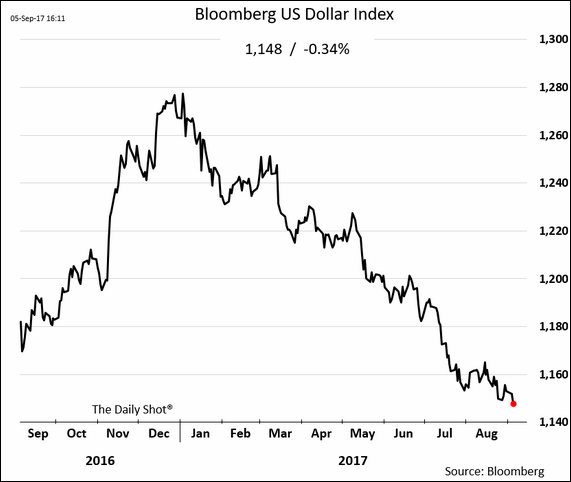
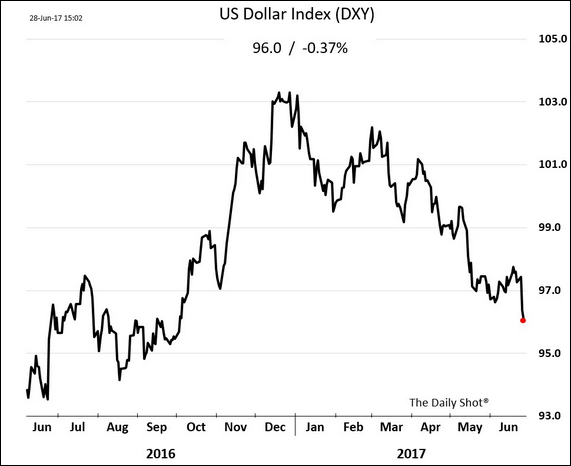
Beyond Canada, the US dollar (USD) has been in general decline against most other currencies (e.g. euro, yen, shekel).

As per the below chart (which measures the USD against a trade-weighted basket of currencies) uncertainty in the US is taking its toll as viewed by the international financial community.

What happens next?

Short rates …

As I have been writing for a while, the era of ultra-low short term rates has ended.

Beyond the two recent increases, the consensus forecast for Canada is three more (0.25%) increases in 2018.

RBC also forecasts another 0.25% increase sometime later in 2017.

Of course, this is a highly dynamic environment and many economic and geopolitical factors will shape the final outcome.

Long rates …

Despite several years of expert consensus forecasts of higher long term rates, this is not happening.

The US 10-year Treasury rate is at the low point for the year.

Canadian 10-year rates have risen a little this year but not at the quick pace of the short rates. In fact, long rates now are the same as five years ago.

Long rates, which are set by the markets, continue to be constrained by such factors as:

  • Low inflation;
  • Generally low economic growth;
  • Conservative investors seeking safe havens;
  • Mandatory bond purchases by financial institutions and pension funds;
  • Worries about future risks (US political uncertainty, North Korea, etc.)

CAD USD exchange rates ...

The key variable now affecting the USD – CAD exchange rate is the differential between the short term interest rates of the two countries.

As above, Canada seems to be growing steadily and without major distractions. Short rates are rising.

Conversely, the US is bedeviled by political uncertainty, slow growth and geopolitical concerns.

The hoped for pro-business agenda is not in place. Further, the basic government processes (ability to pay debt, ability to approve the annual budget) have been in contention.

This, added to the economic pressures from multiple natural disasters (hurricanes in major population areas) has led to forecasts that future US short term rate rises are indefinitely on hold.

The differential between the US and Canada is growing.

The recent US currency decline could be part of a larger picture.

It is important to realize that the USD can be considered as another financial commodity and be subject to the same cyclical patterns.

In fact, the USD has had three lengthy bull and bear market cycles since the 1970s.

The most recent US dollar bull market, started in 2011 and has featured a 43% rise since then. However, between 2002 – 2011, the USD was in an extended bear market and fell over 39%.

Many currency strategists now view that the USD has likely passed the apex of its current bull cycle and has begun a decline.

RBC, discussed this in more detail in its August issue of the Global Insight Monthly in its feature article “Implications of a Peak (US) Dollar World”. (If you would like a copy, please let us know).

It is important to note that each national currency follows its own path against the USD. For example, the Canadian currency is much more closely aligned to the US economy and will continue to track the USD more closely than, say, the euro or the yen.

Impacts on Investment Management

The recent rapid currency moves have had a significant impact on investors –especially international investors.

The 13% USD decline over the past four months means that all US investments have lost that much in value when considered in Canadian currency terms.

So, a Canadian-based portfolio containing 30% USD investments, would have experienced a 3.9% performance drag (30% * 13%) over this period based purely on foreign exchange changes.

Other international investors in the US markets have shown a similar pattern (but with different degrees of currency changes.

Domestic US investors would be unaware of the foreign exchange changes and would simply benefit from the increasingly profitable US global companies.

Certain US investments will continue to be attractive to international investors regardless of foreign exchange factors.

  • Companies whose exceptional value and growth features more than compensate for the currency drag.
  • Multinationals, reporting in USD, which have extensive foreign revenues and earnings i.e. in appreciating international currencies. From a USD perspective their foreign markets would seem far more profitable and their US share prices would reflect significantly the benefits of a lower USD.


September 01, 2017

MARKET PERSPECTIVES

A HEALTHY ECONOMY …

Markets always operate with a background hum of low grade worries.

However, long term market performance is ultimately based on reality – and the reality is that the global economy is progressing nicely.

Canada

Canada is the fastest growing of the G7 countries with a very strong 4.5% GDP growth rate.

(Note that GDP is always described in “real” [after inflation] terms; in nominal terms, Canadian GDP is growing at well over 5%.)

This is powered largely by higher average domestic wages i.e. up an annualized real 6.6%.

This overall wage growth has allowed for significant increases in both consumer spending (up 4.6%) and consumer saving (also by 4.6%).

This growth has led to an immediate rise in the Canadian dollar, and, increased expectation of rising short-term (e.g. prime) rates this fall.

More specifically, another 0.25% short term rate increase is likely at the Bank of Canada’s October 25th meeting. Perhaps, the rate increase could occur as early as their September 6th meeting.

The US

US GDP growth is annualizing at a healthy 3.0% real growth i.e. well over 4% nominal growth.

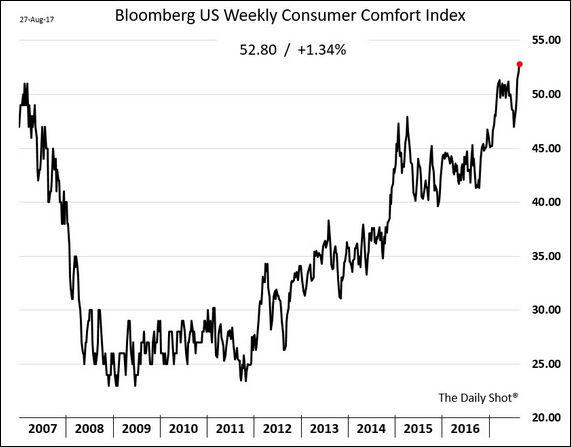
Employment levels and consumer confidence are reaching new highs (see below 10-year chart). Consumer spending is up 3.3% .

The Global View

Strong and accelerating economic fundamentals are global in nature (i.e. inclusive of Europe, China, Japan and the emerging world).

This, combined with continuing low long term interest rates, provides a strong positive dynamic which, historically, has proven more powerful than interim worries.

In fact, RBC Dominion Securities’ current forecast is for no recession before 2019 (at the earliest).


August 25, 2017

MARKET PERSPECTIVES

We are in the deepest part of the summer doldrums with little corporate news and little change in the markets.

A small, but significant news item, was the purchase of Calpine Corporation by the Canadian Pension Plan Investment Board (CPPIB).

Calpine is a major private US power producer (generating enough electricity from natural gas and geothermal heat to heat about 20 million homes in Texas and northern California)

The CPPIB is the investment body that manages the multibillion savings of all Canadians through their Canada Pension Plan contributions.

In many significant ways, we have a similar long term objective ( providing sustainable retirement income) as the CPP. Naturally, we use many similar strategies.

For example, to meet this essential objective, we both invest in real assets (e.g. operating real estate, power generation, other utilities and infrastructure) which provide highly reliable and efficient income. This income can then be redistributed as the foundation of a public or “private” pension plan..

Given its huge size, the CPPIB can invest $750 million (US) to participate as part of a $5.6-billion cash deal to privatize Calpine Corp.

Our investment accounts, of course, do not have the size for such purchases.

However, by owning shares of publicly traded power generators (also with major operations in the US) then private investors can benefit from exactly the same, intelligent economics (and solid cash flows) as those used by the major public sector plans.

Long time clients may recall that, several years ago, we did own shares of high yielding Calpine Power when it was publicly listed.

Unfortunately for us, we were obligated to sell the shares back to the parent company (at a considerable profit to our investors) when it privatized itself.

Ironically, several years later, the CPPIB has come to see the same benefits that we did, and, is buying the entire company (for the benefit of all Canadian current and future pensioners).

If nothing else, this confirms we’re all “on the same page”.


August 18, 2017

MARKET ENVIRONMENT

Income Inequality, Inflation, Interest Rates (Part I)

Inflation can only take hold if consumers can pay inflated prices.

However, if consumer buying power is not growing, then inflation will not happen. Similarly, there will be little pressure to raise interest rates significantly.

Consumer buying power, of course, depends mostly on higher employee wages.

But wage growth has generally been weak.

As per the below chart, since the late 1970s, the benefits of growing economic productivity (dark blue line) have not accrued to the workers (alias consumers) (light blue line). Instead these benefits went to investors, managers and a select group of highly skilled professionals (the 1%”).

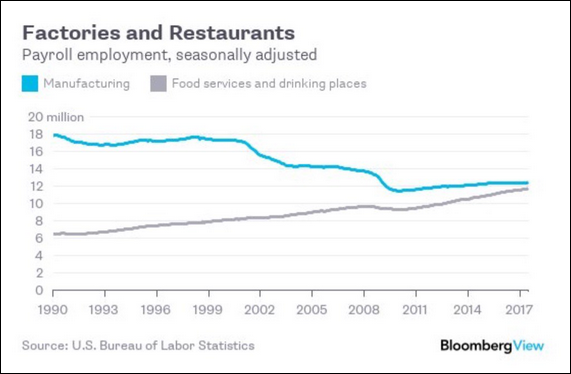
The below chart illustrates the changing workforce. Large number of high paying manufacturing jobs (dark blue line) were lost - to be replaced by less favourable food service jobs (gray line).

Employment statistics do not differentiate between types of jobs so this factor is relatively unnoticed.

This leads to concentrating income power in the investor/manager/professional group.

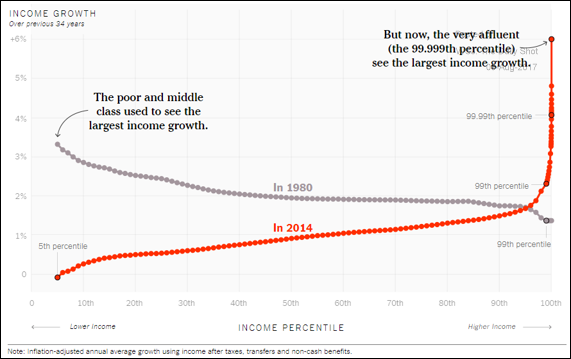
In the below chart, in 1980, the lower and middle income groups (gray line) received the highest income growth.

By 2014 (orange line) almost all of the income growth accrued to the “1%” (actually the “0.1%).

As more workers (consumers) have been constrained in their incomes so has their ability to spend.

Of course, products and services expressly desired by the high earning 1% (i.e. private and “Ivy League” education and art collectables) are experiencing inflation. However, for the vast majority (the 99%) of the population there is little prospect of significant wage gains and therefore of broad-based inflation or significant interest rate increases.

So, despite continuous speculation about rising rates, 10-year rates today are the same as four years ago.

As a reminder, the lower rates are generally supportive of equity markets

Income Inequality, Inflation, Interest Rates (Part II)

Will this pattern change in the foreseeable future?

Certainly the forces which have led to the relative decline of the industrial middle class (foreign outsourcing, replacement by robots, artificial intelligence, etc.) continue.

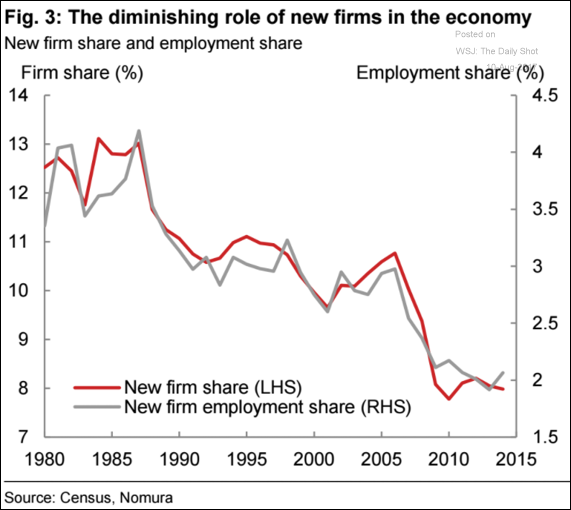
There is much discussion of technology start-ups and their ability to create jobs and wealth.

It is true that a handful of giant technology companies are making major economic and economic gains.

As per the below chart, start-ups are adding an increasingly shrinking contribution to the workforce.

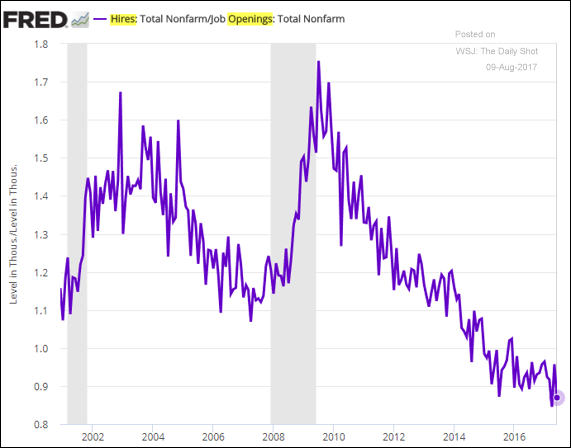
Ironically, there is a dearth of talent to fill quality jobs which are currently available.

As per the below chart, only 10% of available work is unfilled due to lack of skilled applicants.

In fact, lack of skilled workers is now considered the main problem of small business (ranked a much higher concern than taxes or revenues).

Anecdotally, many applicants are being rejected, not only for poor education, but also for poor work attitudes, sloppy appearance and for drug use.


August 11, 2017

MARKET ENVIRONMENT

The Return of Volatility

Markets usually pull back an average of 5% about twice a year.

Such pull backs are certainly irritating to investors but, they are useful to washing out frivolous speculation and therefore, providing a firmer foundation for further growth.

However, until this week, investors have enjoyed an exceptionally long period of low volatility- with no decline larger than 3% in over a year.

However, this exceptional market calm may be coming to end based largely on events in North Korea. The market has declined a little as have long term interest rates.

But, how significant are upsetting geo-political events to long term investment programs?

Not very.

Over the past century (and longer) the markets have been tested by two world wars, a lengthy cold war, near-wars (Cuban Missile Crisis), regional wars (Iraq, Israel) other acts of mass destruction (9/11), presidential assassinations (JFK) etc.

These major global events have had immaterial economic impact. People still go to work, buy groceries, check out Facebook, drive their cars, visit friends, etc.

Corporate revenues and profits are not affected and there is no change to investment income.

However, while the real world is little affected, trading speculation typically cycles through three stages:

  1. Immediate (overwrought) fears lead to short-term selling of equities and purchase of safe haven assets (i.e. fixed income).
     
  2. Once the feared event either happens (or disappears) there is an immediate relief rally. Previously over-sold assets are bought at good value.
     
  3. Over the longer term, speculation about the specific geo-political drama fades and underlying economic and market fundamentals reassert themselves. Strong markets resume their upward trend; vice versa for bear markets.

We remain in a long term bull market.


August 04, 2017

MARKET ENVIRONMENT

Summer Doldrums

We are now in the heart of summer (and vacation season) and there is little significant movement in the markets.

The TSX is at about the same level as a week ago as is the S&P 500.

The Dow Jones Industrial Average (DJIA) did rise by 1.4% and crossed the 22,000 line (creating much media attention to this relative non-event).

The DJIA is composed of 30 huge US companies, all of which receive major revenues and profits from their international operations. The declining US dollar (i.e. equivalent to the rising Canadian dollar, Euro, Yen, Yuan, Pound, Shekel, etc.) has made American export products cheaper to foreign buyers. As well, these foreign revenues are in appreciated currencies and translate higher in the financial reporting of US multinationals.

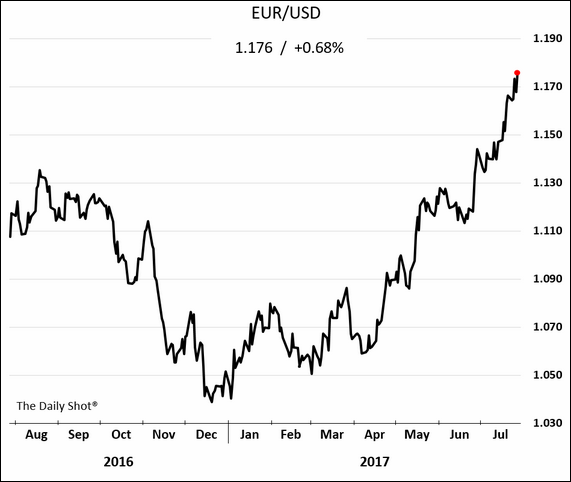
The rising Canadian dollar (CAD) is shown on the left, the rising Euro (EUR) on the right.

Ironically, the DJIA’s strong performance in US dollar terms is due largely to the relative underperformance of the domestic US economy.

Global economic GDP growth is estimated at 3.5% and rising. On the other hand, US GDP growth is estimated at 2.1% and falling.

Business and consumers outside the US are growing their spending power faster than their American counterparts (and becoming bigger clients of US firms). Moreover, the international currencies used to buy the products of the US multinationals have significantly increased in value.

Ironically, the success of US large cap markets (“Wall Street”) would seem alien to the daily experience of the average American (“Main Street”).

Caution is fine …

Many investors do not trust this bull market.

In the US, the fastest growing asset class for investment remains fixed income (not equities).

In fact, over $355 billion USD was invested in fixed income products in the first five months of 2017 alone. This almost exceeds the $375 billion similarly invested in 2016.

As well, many investment strategist are cautious about further market gains.

Ironically, this is good news for long term investors.

Although fundamental, economic and corporate conditions are fine (and central banks remain supportive) this high degree of skepticism provides assurance that markets are nowhere near the stage of euphoria that precedes a bear market.


July 28, 2017

MARKET ENVIRONMENT

Corporate Earnings Season

This week is the busiest week of the second quarter corporate earnings season in the US.

As of today, almost one-half of S&P 500 companies have reported their quarterly results and beat earnings estimates 73% of the time.

In fact, revenue growth at blue-chip US companies (such as Visa), are beating analyst expectations at the best rate in nearly a decade.

In other words, the often pessimistic views of the news media and investment analysts have once again been proven incorrect, or at least, too conservative.

The Fall of the US Dollar

As per last week’s blog, general disappointment with the inability of the US to execute on its proposed economic agenda, and the growing strength in other international economies has weakened the dollar considerably.

As part of the currency realignment, the Canadian currency (CAD) is up 10% since May and has passed the $0.80 level. This week’s episode of repeated failure of the US government to move forward on the repeal of ObamaCare has further impressed investors with the expected futility of their reform agenda in other areas.

The rapid rise of CAD (the inverse of the fall of the USD) was accelerated due to the many foolish US traders who had bet heavily against the CAD in hopes of benefiting from an imagined collapse of the Canadian housing markets (and of the Canadian banking system as well).

The initial signs of the rise of the Canadian currency forced these traders to cover their bets (reverse their short positions) by buying back the CAD. Of course, this buying pressure added to quick rise of the Canadian currency.

Now that these traders have taken their losses and exited their negative trade on Canada, the foreign exchange (CAD-USD) markets are basically in balance at current levels. This new range of the currency may persist for a while.

Of course, almost all other international currencies also rose as compared to the US dollar (USD).

As per the below chart, the lower US Dollar (the pink line) has been a major support for the profit and market performance of US companies (represented by the grey line), especially those who sell their products internationally.

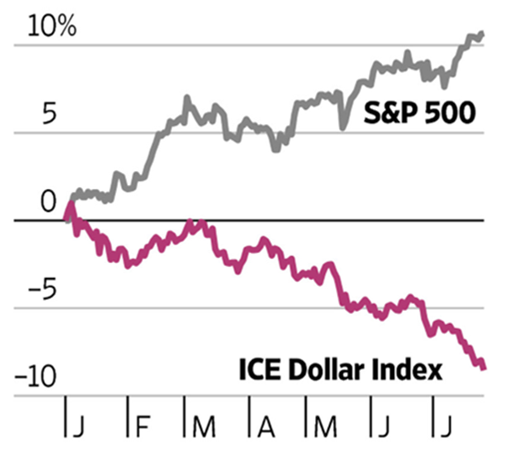
In Canada, the opposite has been true, with exporters experiencing a slowdown in international orders. This will potentially be another self-limiting factor for the further appreciation of the Loonie (and other currencies).

Market Outlook

Short-Term

Most companies are performing well with strong revenue and profit growth, low "cost of capital” (i.e. interest rates on corporate debt are still low) and continuing to benefit from the constrained costs of labour and technology.

Notwithstanding fundamental strength, there can be market volatility at any time, with August-September being a historically more volatile period.

Given the positive economic and market environment, any market pullback should be viewed as a rare “Buy Low” opportunity.

Mid and Long-Term

According to many technical analysts (including those in RBC), most major global equity markets remain in the relatively early phase of a long-term secular bull market.
Such markets, characterized by:

(i) rapid rotation of sectors in and out of investor favour; and by

(ii) a general mood of investor caution
can often continue for years into the future.

Once again, long-term bull markets are inevitably (and uncomfortably) accompanied by periods of short-term volatility, and while unpleasant, these periods would be best viewed as buying opportunities.


July 21, 2017

MARKET ENVIRONMENT

Currency Changes

Perhaps the greatest market surprize this year was the rapid decline of the US dollar (USD) relative to all other developed world currencies including the Canadian dollar (CAD).

The USD ended 2016 with strong gains (and this was expected to continue in 2017) based on expected arrival of the economic agenda proposed by the new US administration. It was expected that this accelerated growth would also increase inflation and then interest rates.

In fact, the opposite has occurred.

There is little progress on new US economic programs and inflation is falling.

The 10-year bond rates in the US has actually decreased this year (from 2.44% to 2.24%) reflecting low expectations for accelerated growth.

The US Federal Reserve did hike short rates twice this year as a precaution for their perceived risk of runaway inflation. However, they now seem to be on hold for the immediate future.

On the other hand, international economies i.e Canada, Europe, China, Japan, Israel are experiencing higher economic growth than the US.

The central banks of those countries are now giving early indications of increasing their rates (or at least reducing their own stimulus programs). In fact, Canada was the first country to actually begin rate increases.

As a result, their currencies are rising relative to the USD.

For example:

  • The Canadian dollar is at a 2-year high (up 7.2% this year) including a sharp 11% rise since May
  • The Euro is at a 2-year high up 10.9% against the US currency

(Israeli readers should note that the shekel was similarly up over 10% against the USD; however this pattern is reversing and the price has declined by 2.5% in July).

The market now doubts that the US administration can implement their economic agenda based on their recent failure to move forward on their high priority health care change agenda. Also, the current high profile Congressional investigations of the Trump campaign also do not add confidence.

What are the impacts of these FX changes on investment returns?

Currency factors are invisible to resident Americans who are invested in US currency investments.

However, they are quite visible to international investors (i.e. Canadians) who have traditionally invested significantly in US equities (i.e. for currency diversification, for direct investment in the major US growth companies).

The decline of the USD leads naturally to an equal decline in the value of the US investments i.e. from the perpective of the Canadian dollar

So, for example, while the major US technology companies (Amazon, Facebook, etc.) remain highly successful companies and are achieving all time highs (in USD), the currency factor makes their performance less strong from the CAD perspective.

For a CAD portfolio with a 30% allocation to US equities, the recent (3-month) 10% drop in the US dollar has created a 3% (30% x 10%) drag on performance from the Canadian perspective.

What next?

There is a considerable range of foreign exchange (FX) forecasts. And, FX markets are famous for their changeability – as we have seen.

As shown in above chart, the USD increase based on the election of the new US President has now all been elimnated.

It would take some extraordinary changes to rekindle the initial enthusiasm.

On the other hand, US economics are still solid and prospects for certain market-positive tax changes remain reasonable.

Assuming that the majority of the bad news has already been anticipated in the FX markets:

  1. The more drastic currency exchange changes likely have already occurred and, in the future, may stay in the current trading range. The sharp rate of FX change will not continue at the same pace.
  2. The portfolio drag for international investors holding US investments may be ending
  3. US companies may benefit from their lower currency since (i) their products will be more price-competitive internationally and (ii) their profit for international operation will seem much higher when translated back into USD. Conversely Canadian and other international companies which operate and/or sell into the US will be disadvantaged.

In other words, the recent FX changes will self-correct over time.

We will be constantly monitoring the currency situation and keeping readers informed.
 

July 14, 2017

MARKET ENVIRONMENT

Higher short rates for Canada …

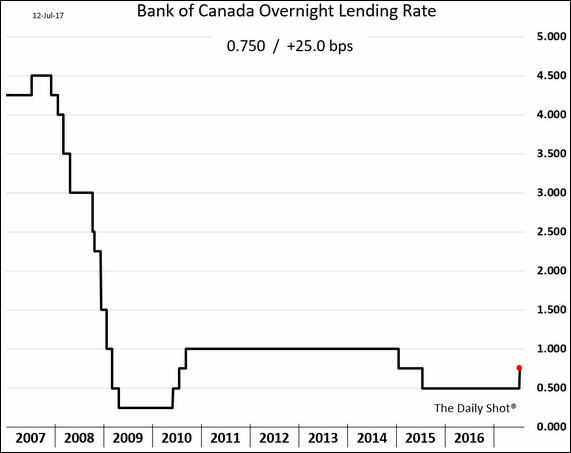
As expected, based on solid growth in the domestic economy, the Bank of Canada raised its short-term (“overnight”) rate by 0.25% this week.

All Canadian banks immediately raised their prime rates by the same amount (to 2.95%) causing commensurate increases in the credit costs for adjustable rate loans and home equity lines of credit.

This first rate increase in seven years has created a flurry of media excitement but is actually relatively quite small (see below 10-year chart)

What is more important is the path for future rate increases.

Currently, the consensus forecast is for a second 0.25% rate hike (in October) and, likely, another two more sometime in 2018.

Looking into the hazy future, some forecasters suggest a total of six rate increases over the next few years.

This could translate into a prime rate of about 4.20%. While this is considerably higher than the rate for the past two years (2.70%), it does not reach the levels of 10 years ago.

Admittedly, these forecasts will be revised over time However, rising short-term rates have become a financial reality for the first time in years.

While the US is on pause …

The US has already raised short rates three times over the past three quarters (3 x 0.25%) but now seems to be pausing while assessing the economic impact.

In her semi-annual testimony before Congress this week, Janet Yellen stressed yet again that any future rate increases would be only “gradual” and did not signal immediate urgency to do more in the near future.

Markets now assume that US rates would not be raised soon (i.e. not before December), and made some quick adjustments:

  • The US dollar fell relative to other currencies (i.e. since other countries are expected to raise rates in the interim);
  • Bond rates declined (i.e. since there would be little upward pressure from rising short rates)
  • The equity markets generally increased. (i.e. since there would be little threat of higher long term rates)

But there is little change in long term interest rates …

The above changes in short term rates are best viewed as the end of an extraordinary period of central bank administered financial support after the Great Financial Crisis (2008 – 09). It is not a great surprise that these extraordinary supports can begin the process of winding down.

Gradual, and well-communicated, rate changes of 0.25% should be easily absorbed by a healthy economy and would be of worry only to those who are severely overly indebted.

Notwithstanding the rise in short rates, there was been only minor change in longer term rates (i. e. 10+ years).

These rates, set by the markets and not by the central banks, remain very low (2.32% in the US and 1.89% in Canada).

These are at the same levels as 2011 and reflect continued expectations for low inflation for many years into the future. In fact, inflation over the next 30 years is estimated at only 1.86% annually.


July 7, 2017

MARKET ENVIRONMENT

“Happy Canada Day” to our Canadian readers; “Happy Fourth” to our American readers.

Looking forward to “H2"

As we enter H2 (i.e. the second half of this year), let’s review the major economic expectations.

The North American economies continue their multi-year moderate expansion - growth to expand at about 2% in real (inflation-adjusted) terms i.e. almost 4% in nominal terms.


This essentially continues the “Goldilocks” scenario of (a) strong enough growth to expand employment and consumer spending but (b) without the high velocity which could create sharply higher rates or an excited boom-and-bust sequence.

Post-US election expectations of accelerated growth from a promised agenda of deregulation, tax reform and infrastructure have now faded away.

Nevertheless, the economics look fine with the (US) unemployment numbers down to that of 1991.

Central banks are pulling back their financial stimulus.

Despite little sign of inflation, central bankers remain worried that their continued high levels of (post-crisis) financial stimulus (i.e. mostly via low rates) could create future inflation or a financial bubble. They seem to doubt their own economic forecasting talents (i.e. they entirely failed to predict the 2000-02 and 2008-09 bubbles) and so are extremely (perhaps excessively) vigilant.

The US has already raised rates twice this year. Their next steps are likely to be:

  • In September, starting to decrease the reinvestment of maturing bonds that they already own. This would remove a major buyer from the longer term bond market and could lead indirectly to higher long rates.
  • Later in the fall, perhaps add another 0.25% rise.

Canada, which dropped short-term rates twice in 2015 (to offset the impact of falling oil prices on the western provinces) is now worried about potential bubbles in certain housing markets as well as consumer debt.

Although Canadians can easily afford to service such debt and maintain very low default rates, this does not assuage the fears of the Bank of Canada

As a result, Canada is broadly forecast to raise short rates by 0.25% as early as next week (July 12) and again in October. The thought is that this would restore the rate cuts of 2015. In 2018, more rate rises could occur.

Note that the central banks are moving very cautiously (a 0.25% rate rise is not inherently cataclysmic) and are using a series of public speeches to signal their thoughts well advance of their actions. They want to make sure that equity and bond markets are comforted by their careful and gradual changes.

Forecasters believe that the gentle and cautious patterns of short-term rate rises will help push up longer rates in Canada and the US.

Perhaps.

Higher rates have been forecast continuously since at least 2000; however long rates have continued to decline.

Apparently the stronger disinflationary forces of technology, globalization and demographics are stronger than the inherent optimism of economic forecasters.

Any rate, once again in 2017, the higher rate forecasts have proved backward; long rates have declined again this year. Of course, none of this has stopped the dire media warnings of the possible damage of the imagined higher rates.

There is little sign of imminent recession. Goldman Sachs suggests only a 25% chance over the next two years. The several leading economic indicators used to predict economic cycles are universally pointing to continued growth.

The New York branch of the US Federal Reserve has been an excellent predictor of recession. As per the below chart, they consider recessions risks over the next 12-months to be only 10%.

Equities are expected to do moderately well based continued increases in corporate revenues and profits. The first half of the year (H1) produced good returns and the general expectation is for positive but quieter returns to finish off the year.

That said, the markets in the short term are dominated by very active traders (and their computer algorithms) and so the cautious intent of the central banks could be misinterpreted.


There will likely be a moderate increase in volatility across the different sectors and geographies as the markets adjust to any whiff of pullback of the high level of financial stimulus.

The Canadian dollar (and most other international currencies) is expected to continue to gain against the US dollar (USD). This is also likely true for the euro, shekel etc.

This is because, these other countries seem now ready to start raising rates and this would make their currencies relatively more attractive than the USD. On the other hand, the first-moving USD has stalled while their central bank has delayed further increases while they re-evaluate their next steps.

In fact, the USD has declined about 5.6% against a basket of currencies in H1 - with the same amount of decline vis-a-vis the Canadian currency.

If Canadian short rates continue to rise (as expected) while US short rates stand still (as expected) then the Canadian dollar will continue to rise - at least over the short term.


June 30, 2017

MARKET ENVIRONMENT

This week’s market macro analysis, written by Patrick Fisher of our team, provides a comprehensive view of our perspectives.

This week Stephen Poloz, governor of the Bank of Canada, was quite clear that an interest rate increase, as early as July, is now on the table.

In his view, with the economy improving, inflationary pressures may be just around the corner.

In reality, in spite of a relatively robust economy and improving employment, inflation remains muted in most of the world.

An ideal inflation rate of 2% has been the target of most central banks in the western world (i.e. the Bank of Canada, the US Fed etc.).

Academically, economists agree that when the average price for most goods and services increases at an annual rate of 2%, it is reflective of a healthy economy.

Despite years of various policy measures (i.e. ultra-low interest rates and quantitative easing) from the central banks, inflation remains low and, if anything, maybe in secular decline.

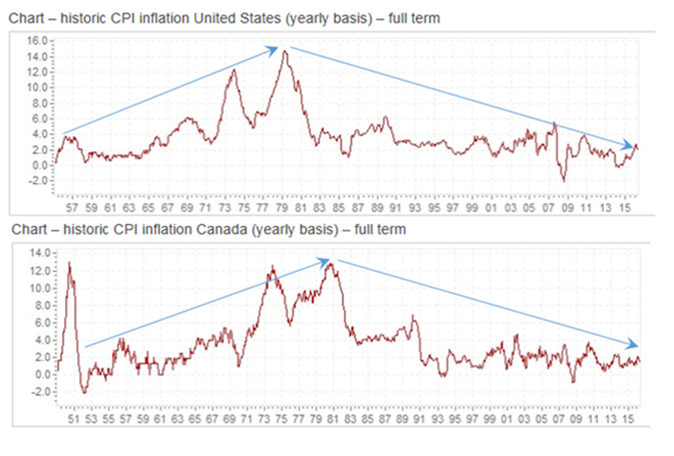
To highlight this, below are long-term charts of the US and Canadian inflation rates since in the 1950s.

Generally, we can see rising inflation from the 1950s peaking in the 1980s (this broadly tracks the inflationary pressures of the baby boom generation).

However since the peak in the early 80s, it is clear that long-term inflation trends are either a) stable at levels below 2% or potentially b) in secular decline.

One cause of stubbornly low inflation is certainly aging demographics. Older consumers tend to spend less.

Globalization, enabling international price and wage competition, further lowers domestic consumer prices and domestic wage expectations.

Also, technological innovation has broadly and profoundly kept a lid on inflation, but in often subtle ways.

For example, this week was the 10th anniversary of the introduction of Apple iPhone to the public (i.e. the beginning of the smart phone revolution).

Here’s a list of things that the iPhone has replaced in the last 10 years:

  • DVD & CD players,
  • PC computers,
  • Flashlights,
  • Cameras,
  • Land line telephones,
  • Maps,
  • Books,
  • And maybe even your wallet.

In other words, one consumer product has replaced many others (and counting). This is disinflationary.

Last week Jeff’s blog described how oil extraction technology has led to price disinflation (and its various secondary impacts) in energy prices.

But that’s not all. Below are a few more ways that technology is (or will be) generating more disinflation in our lives either directly or by way of secondary impact:

  • Amazon’s purchase of grocer Whole Foods will certainly lead to further price competition in groceries;
  • Elon Musk’s company Space X is now using reusable rockets to launch satellites (a single satellite launch used to cost $61 million, a reusable rocket launch costs $7 million);
  • The technology industry, almost in unison, is now focused on disrupting the auto industry through the introduction of autonomous and/or electric cars and ride sharing which is sure to continue to put downward pressure on prices.

June 23, 2017

MARKET ENVIRONMENT

Implications of Cheap Oil

Massive production growth of US shale oil has led to the highest inventory stockpiles since World War II. This has forced down the price of oil to “bear market” levels (a drop of 20%+) despite the self-imposed production quotas from OPEC and Russia.

This production growth is based on new, technologically sophisticated recovery methods that allow oil, which is trapped in shale rock formations, to be extracted profitably even at current low prices.

With oil becoming more of a technology product (and less a passive commodity), its price will likely continue to decline as cost-efficiencies increase.

We have immaterial investment in energy production companies for this reason.

However, there are major and widespread secondary impacts of the price decline:

  • Lower inflation (lower fuel and heating costs);
  • Less need for (highly paid) workers or (major capital intensive) business investment in the energy sector;
  • Lower interest rates (due to the disinflationary impacts of the above);
  • Lower Canadian dollar (since domestic oil exports have less value);
  • Lower broad markets (since the energy sector is a significant contributor of capital spending and profits).

By the way, drivers will hardly notice the commodity price impact when refilling their vehicles. Much of the pump price is based on taxes.

Won’t Get Fooled Again?

For many years, forecasters have consistently over-estimated economic growth, inflation and long term interest rates.

According to a recent survey, their 1-year forward projections for 10-year interest rates have been 0.6 percentage points too high on average since 2003.

Similarly, the consensus forecast for 2017 was also that rates would have to head higher, pushed up by rising inflation and a lift-off in growth.

In reality, the 10-year US Treasury note (the foundation for setting rates for corporate debt yields, revolving credit and certain other consumer debt) fell to 2.153% on Friday down from 2.446% at the end of last year. The equivalent 10-year Government of Canada yield is only 1.48%.


June 16, 2017

MARKET ENVIRONMENT

Short Rates Rising

Continuing moderate North American growth is leading to higher short-term rates.

As a reminder, the overnight rates (which are set directly by the central banks) determine prime rates and, in turn, the cost of variable-rate mortgages and home equity lines of credit.

This week:

· US short rates increased by another 0.25%. As well, the Federal Reserve expects another similar increase later this year plus three more both in 2018 and 2019.

· In Canada, where rates have not increased since 2010, speeches by the two highest ranking members of the Bank of Canada indicated that it now considers economic conditions to be strong enough to entertain rate rises of its own.

Futures markets now indicate an 80%chance of the first increase being later in 2017.

RBC projects three quarter percent increases in Canada by the end of 2018.

The likelihood of rising borrowing costs for several types of debt grew sharply this week. Borrowers should be prepared for these extra costs.

But Not Long Rates …

Long rates (bonds of 2 years and longer duration) are set by the markets and they continue to decline.

The secular forces working against inflation (lower energy and retail costs, lower wage gains, technological innovations) have not disappeared.

Somewhat contrary to the projections of the central banks, current inflation and long term interest rates continue to decline.

Current 10-year US Treasuries trade at levels (2.15%) last seen in November 2016 and before that in December 2014 and August 2011.

Despite central banks fears of rising inflation, the markets do not agree and are trending down. This is supportive to the “interest sensitive” sectors of the markets.

INVESTMENT 101: Case study of how markets really work …

The share price of quality companies with growing revenues and earnings should be expected to grow over time.

However, short-term speculation (which in hindsight, is often found to be wrong) can often obscure (and temporarily frustrate) longer term investors.

As a case study, let’s take a look at an industrial REIT common to growth oriented client accounts. This company is a global giant in logistics and warehousing real estate with over 676 million square feet of space in 20 countries, a 97% occupancy rate and 7% year-over-year rent increases. The company also pays a 3.0% dividend which it has nearly doubled since 2013.

Given the strong secular growth of e-commerce (which requires large, local warehouses/ distribution centres to fulfill orders quickly), this company is clearly in an enviable position.

However, the below (1-year) price chart of this REIT shows that transient, external events (as misinterpreted by active traders) can substantially influence actual trading prices – at least for a period.

Box A (November 2016): Traders react enthusiastically to the election of Donald Trump on the assumption that his pro-growth agenda will be quickly implemented. More specifically, they assume:

(i) higher inflation (and interest rates) since the US economy will surely over-heat with growth; and

(ii) his ‘America First’ policy will rollback global trade.

Based on this speculation, the share value quickly fell by over 10% (Box A).

Subsequently, value-oriented investors recognize the opportunity and buy shares at lower prices (rise between A and B). The share price returns to its previous amount.

Box B (January 2017): The inauguration of the new president reminds traders to rekindle their initial enthusiasm and a new round of selling ensues.

Once again, subsequently, value buyers seize the opportunity.

Earnings Report (April 2017): In its quarterly report (and contrary to the negative speculation) management confirms solid expansion, revenue and earnings growth. RBC’s analyst publishes a report about the company entitled “Portfolio is positioned for solid long-term growth”, reiterates their ‘Outperform’ rating and increases the target price.

Concurrently, the Presidential pro-growth economic agenda is not in evidence and interest rates are actually falling.

The speculation was wrong and this REIT is now trading at an 8-year high.

An intelligent and patient approach proved effective.


June 09, 2017

MARKET ENVIRONMENT

The (disappearing) Trump factor

Investors remain disenchanted with the lack of progress on President Trump’s proposed pro-growth economic agenda.

As the post-election optimism fades, the main market impacts have been:

  • Decline of the US currency relative to other international currencies;
  • Decline of US long term interest rates;
  • Market disinterest in (economic cyclical) companies and sectors i.e. which would have benefited from the announced agenda;
  • Rotation of some investment funds out of the US to other international centres.

On the other hand, certain market sectors continue to perform well in this slow, but still positive growth economy:

  • Interest sensitive sectors (e.g. utilities) which thrive in a low rate environment;
  • Defensive sectors (e.g. consumer staples, health care);
  • Major exporters (which benefit from the lower US dollar)
  • Secular growth sectors (e.g. technology).

These remain a focus for portfolio concentration.

And, further to that ….

Since the last recession (2008-09) the numbers of available jobs in the US have been growing sharply and are now over 6 million.

However, the labour force has not been able to fill them.

The below chart, from the US Federal Reserve, illustrates the declining ratio of people hired compared to job openings.

The current ratio of 0.84 indicates that only 84 out of each 100 available jobs is being filled (bottom right corner of chart).

In other words, available jobs outnumber the qualified candidates by about 16% (an all-time record difference).

So, the problem seems to be less a lack of jobs and more a lack of workers with the requisite education or technical skills to fill those jobs.

Notably, this skills gap is mostly in the high-pay positions which energize companies and economies.

The obvious economic policy would be to train/retrain the workforce to address these needs and opportunities.

However, this issue is not even mentioned in the (proposed) economic agenda.

In fact, the tabled Presidential budget proposal for the next fiscal year, recommends significant cuts to the Departments of Labour, Education, and Human Services. This will decrease training program access.

This labour force mismatch is continuing the pattern of lower productivity and growth in high skill industries and skewing of the labour force to lower skilled work. In turn, this is resulting in little wage (or general) inflation and continued low interest rates.

Without necessary attention to this fundamental economic problem, the current low growth economy is likely to continue on.

In turn, this seems to confirm the longevity of the current market environment.


June 02, 2017

MARKET ENVIRONMENT

General Notes

The announced US withdrawal from the Paris climate accord has more symbolic than real-world impact.  

1. Under the accord terms, the US must wait until November 1, 2020 to exit. This effectively ensures that yesterday’s announcement can only be confirmed via the next presidential election.

2. The accord itself is quite loose with each country required only to put forward an environmental plan of its own choosing and to monitor its own results.  There is no external (i.e. non-US) monitoring or accountability.

3. The federal withdrawal has no impact on other levels of US government (e.g. California), on consumer preferences for clean energy, or on the corporate intentions to embed environmental factors in their operations.

4. The US is still bound by the United Nations Climate Treaty (which it ratified in 1992). 

Low inflation/ Low rates

Increasing wariness about the Trump administration’s ability to deliver on their promised pro-growth agenda is suppressing the expected rise of long-term interest rates. 

In fact, long rates have declined yet again, this year and are, in fact, the same at the same levels as summer, 2011.

The consistent predictions about rising inflation and rising rates are failing again this year.

The Rise of (continental) Europe

After several years of underperformance, the economies and markets of continental Europe (Eurozone countries such as  Germany, France, Spain, etc.) are now reviving and becoming another reasonable locus for intelligent portfolio diversification.

The below chart indicates the strong and rising leading indicators of economic growth.  The PMI (Purchasing Managers Index) is a composite of several factors (e.g. future purchase orders) which have accurately forecast future growth. A score of over 50 illustrates rising growth.

Several factors underpin this revival:

  • Reports of solid economic growth (at levels higher than North America)
  • Significant earnings growth in major companies (also higher than North America)
  • A new political commitment to Eurozone cooperation and to economic reform (e.g. new French President, Emmanuel Macron)
  • A flow of investment funds away from Britain (fearing the Brexit impact) and the US (concerns about slowing growth)
  • Continued major stimulus from the European Central Bank (very low short-term and long term interest rates, quantitative easing)
  • Still attractive equity valuations. 

Further, the major European companies are heavily focused on international exports (especially to the emerging markets) and the strength of these markets bodes well for the European exporters.

The combined European economy is about the same size as that of the US and it offers significant opportunities.

May 26, 2017

MARKET ENVIRONMENT

Short term interest rates

Recently released minutes of the previous US Federal Reserve meeting signal another 0.25% increase at their next meeting in mid-June. (They are also expected to raise an additional 0.25% in September).

On the other hand, the Bank of Canada met this week and announced no change in rates – but did indicate improving economic conditions. Economists do not anticipate a rate increase in Canada until mid-2018.

The brighter Canadian economic picture (and anticipation that short rates will eventually rise in line with the US) is leading to a stabilization/ mild recovery of the Canadian dollar relative to that of the US.

Long term interest rates

Central banks can dictate the level of short term interest rates (which determine pricing for variable rate mortgages and consumer loans), but the bond markets dictate long term rates.

The below one year chart, of US 10-year Treasury Bonds, indicates both the sharp rate rise related to the post-election optimism about President Trump (middle of chart) followed by continuing decline since last December (right hand section) as the earlier optimism faded.

As hopes fade that the new administration will actually be able to execute on their pro-growth economic agenda, the secular forces which have been driving down inflation and long rates for the  past 30 years reassert themselves.

These disinflationary forces include aging demographics (less consumer spending), lower economic productivity (cautious businesses not spending on enhancements), as well as the deflationary impacts of technology and globalization (loss of many high wage industrial jobs,  cheaper products and services).

For almost 20 years, there have been high profile, dire warnings about the certain return of inflation and sharply higher rates. 

However, the broad pattern of rate decline continues in 2017 as it has for the past three decades.

Pockets of Secular Growth

As per the below chart, the technology sector (blue line) continues to do very well under these conditions.

The global expansion of several technology-trends (i.e. social media, ecommerce, messaging, virtual marketplaces, search and internet advertising)  continues to increase corporate revenues and profits independent of political rhetoric or interest rate levels.

Note that less than 10% of retail sales are conducted through ecommerce.  This trend, among many others, has much further to progress. 


May 12, 2017
MARKET ENVIRONMENT

End of the Trump Trade?

After a lengthy quiet period, the stock markets have become a little more volatile.

This more defensive market repositioning is reflected in somewhat lower interest rates, and broad equity indices.

This reflects traders’ concern about the apparent weakening of the anticipated effectiveness of the Trump Administration.

The market is not interested with moral themes or leadership talents but rather if the Trump Administration will have the momentum to achieve its pro-business economic agenda items e.g. major tax cuts, deregulation and infrastructure spending.

The “Trump trade” (high confidence that these pro-business items would certainly be approved by a Republican dominated Congress and Presidency) has been gradually fading in 2017.

Recent events, including increased scrutiny of the Administration’s possible ties to Russia, are now causing traders to rethink their earlier optimism.

We did not share the strong optimism which dominated trader thinking in the immediate post-election period.  As a result, our conservatively oriented portfolios under performed the aggressive markets in November and December.  

However our more defensive positioning is proving helpful as events unfold.

Behavioral Finance: Loss Aversion

University researchers studying the psychology of economic decision-making, have learned that people, typically, are not entirely the rational decision-makers anticipated by economic theory.

In fact, intelligent people may be subject to “cognitive biases” which lead them to make poor economic decisions.

It is important for investors (and investment managers) to be aware of such biases and to work to control them.

Perhaps the most important cognitive bias is “loss aversion”.

Most people are about three times more sensitive to the pain of loss than to the joy of success.

Risk aversion is clearly an evolutionary benefit to our hunter-gatherer ancestors, and to us now, but extreme risk aversion can be detrimental in economic decision-making.

Among older people (especially those in retirement and dependent on the management of a finite amount of life savings to provide lifetime income) risk sensitivity is even higher.

Women, especially older single women, seem, on average, to have an even higher risk aversion.

Often, one’s evaluation of risk is dependent upon how it is presented.

For example, surgery candidates will probably accept doing the procedure if the risk is presented as “patients typically have a 98.5% survival rate”. 

However, if informed that “1.5% of these patients die”, they are more likely to decline.

An extreme desire for safety can lead to unproductivity can lead to negative consequences for investors:

  • Over concentration in very low yielding but “safe” investments;
  • Quick sale of high quality assets on any price decline;
  • Upset at realization of capital gains (i.e. since the focus is on the tax pain and not the larger increase in wealth);
  • Unwillingness to sell depreciating investments which have permanently lost their quality (i.e. reluctance to accept the capital “loss” and preference to remain hopeful of some possible future event).

The business media is highly aware of the major loss aversion focus of their readership.

For example, by highlighting people who espouse dramatic, and often excessively negative market scenarios, the media can attract interested viewership.

Decades of research on business reporting indicates that writers would prefer to take a negative (or, at minimum, skeptical) view of the market environment.

The rationale is that readers will forgive a pessimistic future projection in a rising market.  But they would not forgive a writer who did not warn them properly if the markets subsequently declined.

An important role of the advisor is then to understand, educate and provide proper perspective to their clients on the realistic investment risks of current and recommended positions.


A personal example of the presentation and understanding of risk: A photo taken on a bright sunny day on a beach in Southern California during a recent business trip. 

The nice weather and calm waters are juxtaposed with warning signs suggesting the ever possible arrival of a tsunami. 

While technically possible, the last tsunami to impact the area was on December 21st, 1871 (and before that, January 26th, 1700) according to the California Department of Conservation.


May 12, 2017

MARKET ENVIRONMENT

Canadian Banks: The View from Abroad

The Canadian banking system has been the envy of the world since the Great Financial Crisis (2008 -09).

Before then, US banks had been growing profits by aggressively lending to sub-prime borrowers (while Canadian banks were more conservative and avoided such high risk activities).

The subprime crisis created great difficulty for most of US (and many European) banks.  Some disappeared entirely while others were forced into mergers.  All required government intervention, and considerable taxpayer funds, to avoid collapse.

However, the more stodgy Canadian banks were not directly involved and experienced no direct effect. (Their share prices, however, declined since they were caught in the global financial slip stream).

As a result of its innate conservatism, the Canadian banking system has been ranked as the best in the world consistently since 2009.

The Governor of the Bank of Canada, at that time (Mark Carney), was highly lauded for his prudent leadership and was subsequently named head of the Bank of International Settlement, the Zurich based coordination body for the global banking system.  He subsequently appointed as Governor of the Bank of England, a position which he still holds.

Many US investors have remained rankled by the Canada’s success vis-à-vis their own disaster and have been eagerly awaiting a similar collapse in Canada.

Several US hedge funds have specialized in betting on the failure of the Canadian banks by short-selling their shares.  This selling has created significant under performance for the Canadian banks.

As evidence for their negativism they cite:

  • High levels of Canadian consumer debt (including mortgage debt);
  • Rapid housing increases (which they consider unsustainable) i.e. greater Vancouver and Toronto areas;
  • Cutbacks in Canada’s energy industry (which is thought to create mortgage and credit defaults in Alberta and elsewhere).

Recent problems in Home Capital (an alternative lender which they consider equivalent to their own sub-prime lenders) has strengthened their belief in the likely (and imminent) downfall of Canada’s housing market (and of the entire banking system). (For more detail on the Home Capital situation, please read the final section of this report).

Most Canadians, given their understanding of the domestic market, (since the Canadian mortgage industry is not like that in the US) do not share their fears

  • CMHC, a government sponsored agency, provides full protection to the banks for over 50% of bank mortgages.  Further, CMHC has been tightening its own risk management rules and processes in insuring new mortgages;
  • About 80% of Canadian mortgages are both originated and stay with the bank.  Because there is no significant aftermarket to bundle and sell off high risk mortgages, the banks tend to be more conservative;
  • Canadian banks generally finance their mortgages by buying GOC bonds of equivalent duration; they do not depend on the short term financing used by US banks;
  • Even Canada’s alternative lenders are far more conservative than the former US subprime lenders; their rates of arrears are even lower than that of the banks;
  • Canadian homeowners intrinsically feel a greater moral obligation to meet their mortgage obligations.

Of the 50% of the mortgage market which is not non-insured, the average home equity is more than 35%.  For a bank like RBC, housing values would have to fall at least 35% before there would be any default risk.

Despite the speculative fears, there is no evidence of their validity:

  • The total of all mortgages in (3-month) arrears is only 0.28%
  • This small amount has held steady over the past three years (i.e. despite growing fears and a previous bank debt downgrade); and
  • The current arrears rate is only about one-half of the rate of 20 years ago.

Moody’s Debt Downgrade

Moody’s, a major international debt rating agency, recently downgraded Canadian banks one notch based on perceived risks of rising consumer (including mortgage) debt. They still retain a very high overall rating.

Note that Moody’s was severely criticized for providing high quality ratings on US bank debt prior to the financial crisis and, as a result, they seem to have become much more sensitive to any whiff of risk.

The real world impact of the Moody’s statement was to raise rates on Canadian bank debt by a mere .05%.

By the way, Moody’s cut the Canadian banks, citing the same concerns, four years ago – and there has been no impact.

Home Capital

Home Capital is the largest “alternative mortgage” lender in Canada – providing mortgages to those rejected by the banks i.e. people new to Canada, business owners (whose income is kept in the business) etc.

The specific issue to Home Capital was that certain mortgage brokers, who sourced mortgages for the company, did falsify mortgage documents to facilitate sales (as was common in the US). 

The company investigated this internally and removed these people from their intake network.  However, some questionable mortgages had already been accepted by the company (about 10% of all of their mortgages).  Also, the regulators were concerned that company management did not make sufficiently quick and full public disclosure of this problem.

Although the core problem was identified and contained, nervous watchers considered this as proof that the much awaited sub-prime collapse had finally come to Canada. 

Banks and independent GIC brokers started rejecting further investment in Home Capital’s GICs and High Interest Savings Accounts.  This lack of confidence, in turn, greatly constrained the company’s ability to raise capital to finance further mortgages.  This lack of confidence has imperiled the future existence of the company, and perhaps of the sector in Canada.

A major structuring plan is underway to support Home Capital. The bigger issue is, not rescue of this particular company but, rather restoring the functional capacity of Canada’s alternative mortgage lending industry (which supplies about 10% of Canadian mortgages).  Restrictions of credit to this population is considered unfair and unreasonable.

Please note, that we have always been sensitive to risk in the alternative lending sector and have never recommended that clients buy equity, GICs or fixed income from any company in this group.

Conclusion

The Canadian banks continue to post rising revenues, rising profits and rising dividends.

Despite their strong operational performance, the trading price of Canadian banks have been underperforming recently due to speculative fears.

We continue to monitor the situation closely.


May 05, 2017

MARKET ENVIRONMENT

Secular trends in retail…

The rapid growth of e-commerce (internet retailing) is an accelerating (and unstoppable) secular trend.

Already 10% of all shopping is done online (10% of a $17 trillion industry) and this is expected to expand rapidly over the next several years.

One key factor is consumer convenience.  The ability to shop from home is highly valued in a time pressured world.  Also, product selection greatly outpaces conventional “bricks and mortar” stores.  Amazon offers about 300 million items on its virtual shelves while Walmart offers a mere 150,000.

Also, Amazon through its Prime membership program offer free 2-day delivery (1-day in some places in the US and even 1-hour service in certain cities).

To achieve this, Amazon currently operates 300 fulfillment warehouses (they bought a major robotics company to increase productivity as well as leasing 40 cargo aircraft and operating thousands of tractor trailer units to quickly expedite the delivery of customer orders).

Further, Amazon adds to the value of Prime memberships by offering (in the US) unlimited streaming of music, movies and TV shows (which they produce in their own Hollywood studios much like Netflix).

The below chart illustrates the continuing growth of this service.

Of course, the success of AMZN has come at a heavy cost to traditional brick and mortar retailers, in particular those that have not adapted to these secular changes in e-commerce.

During the first quarter of this year, US retail bankruptcies have nearly matched the total number of retail bankruptcies in all of 2016.

In addition to bankruptcies of smaller retailers, national retailers such as Macy’s, JC Penney, Kmart and Sears are in the process of closing nearly 400 stores.


April 28, 2017

MARKET ENVIRONMENT

A potpourri of political news

This was a heavy week for news – largely based on the Trump administration’s efforts to add some successes to its “First 100-Day”scorecard.

Some examples:

1. The US finally translated its tough anti-trade rhetoric into action by placing 20% tariffs on Canadian softwood (lumber producers) claiming unfair trade practices.

The political calculus seems to be that smallish, trade dependent Canada is a more conducive target than China or Mexico.

Note that this is the fifth time that the US has introduced similar tariffs on Canadian lumber.  In all previous episodes, international trade tribunals reversed the US claims (after years of legal process) and the collected tariffs were eventually quietly returned. 

2. The US did affirm its commitment to NAFTA renegotiations (and not a unilateral withdrawal). 

Ironically, NAFTA itself, has not been a major net benefit to Canada.  Canada already had a successful bilateral trade agreement with the US (the FTA) and adding Mexico simply added a new, lower cost competitor for the US business and consumer markets.

3. A broad (1-page) policy framework for personal and corporate taxes was prominently announced.

This was coolly received by the markets since there was (1) no concept of how this multi-trillion cost would be financed; and (2) little expectation that Congress would provide the necessary approvals.  

In the real world

 The broad economy, and markets, continue to do moderately well – with secular growth industries (like technology) taking a leadership position.  The below chart shows the 5-year uptrend in the NASDAQ which is home to many such companies. 

Over the past year, both US and Canadian real GDP averaged about 2% growth.

However, over the same period, revenues at major tech companies such as Amazon, Facebook and Google (Alphabet) increased over 20% each. 

The continuing pattern of revenue and profit increases (which clearly exceed that of the broad economy) indicate the “secular growth” which is highly valued by the markets.

April 21, 2017

MARKET ENVIRONMENT

Paths for Post-Recession Recovery

The post-2009 gradual economic recovery continues.

This chart compares cumulative real GDP growth (y-axis) to the time after the previous GDP peak (x-axis).

Compared to other post-World War II recoveries, our current path which started in Q4 2007 (light blue line at bottom of chart “Strength of Economic Expansions”) shows:

  • The recent recession was the deepest and longest;
  • The subsequent recovery has been the slowest and weakest.

This gradualist path (sometimes considered as “the new normal”) supports a favourable market environment which combines steady profit growth but which are sufficiently moderate to avoid evoking sharp inflation or sharp rate rises.

Path of Expected Profit Growth

As show by the upward trend in graph “S&P 500 Earnings per Share”, S&P companies generally have steadily rising profits. 

Some other observations:

  • Recessions (e.g. 2008-09) create sharp but short-term interruptions but have a minor lasting impact on long term trends.
  • The expected medium-term future trend (as per the green bars) is a moderate continuation of this trend.
  • Even at the depths of the recession, there was no actual drop in profits – just no growth. 

Moderate growth, supported by moderate interest rates, favours investment in defensive and secular (long term) growth equities. 


April 13, 2017

MARKET ENVIRONMENT

The Trump Rally is fading away …

The great (market) excitement over the election of President Trump has continued on its slow fade.

Initial high expectations over his proposed economic agenda (lower taxes, deregulation, more infrastructure spending) led to market speculation about a very fast growing economy.

This then led to a further market speculation that this assumed high velocity growth would create higher inflation and higher interest rates.

The chart below shows the sharp jump in inflation expectations in November i.e. immediately after the Trump election. 

However, these hopes have been decreasing since the promised economic agenda items have proved very difficult to implement. 

This has resulted in falling inflation expectations (as above) and falling long term interest rates in the US and Canada.

This trend change is broadly supportive of the “interest-sensitive” investments (bonds, REITs, utilities, select consumer and technology).

Interest Rates in Canada …

Long-term rates in Canada generally trade closely with those in the US.

For example, current 10-year government bond rates, which are determined by market trading, are down to 2.24% in the US and 1.49% in Canada.  (Canada’s rates are lower due to a higher credit rating).

Short-term rates, specifically the overnight rate, are decided by each country’s central bank (i.e. the Federal Reserve in the US and the Bank of Canada here) based on domestic conditions.

The Fed has been actively raising rates (three times in the latest cycle with more planned) in view of the improving US economy.

However, the Bank of Canada has not raised rates at all.  It is concerned about the slowdown in Alberta’s energy based economy, about a protectionist Trump trade agenda, about not wanting to increase the trading value of the Canadian dollar, etc.

That said, oil prices (and the Canadian oil industry) have been recovering and the rest of the economy has been progressing well.

So, while Canada’s domestic short-term rates will not be rising at the US pace, it is likely that the Canadian overnight rate will start increasing early in 2018.

As a reminder, increases in the overnight rate lead quickly to increases in the prime rate.

This, in turn, leads to increasing costs for common consumer debt expenses such as floating rate mortgage rates and home equity lines of credit. 

Canadian consumers, in aggregate, have built up very high debt levels based upon the relative ease of financing loans at ultralow rates. 

There is early indications that these rates may start to increase in the foreseeable future.

April 07, 2017

MARKET ENVIRONMENT: THE VERY BIG PICTURE 

It’s essential to consider the “big picture” when viewing the economy and markets – and not be overly attentive to the daily or weekly news cycle.

The below charts illustrate the key multi-decade trends in consumers spending.

Measuring the growth of consumer spending is essential since this is the engine of the economy providing about three-quarters of GDP.  As consumers spend more, producers produce more, transportation companies transport more, etc.

In the below charts, the blue lines show annual increases in real (after inflation) US consumer spending.  The grey bars cross-reference periods of economic recession.

Chart A – The last 20 years 

Consumers have grown increasingly cautious about spending growth over the past years (i.e. decrease from over 5% in the late 90s to under 2% in recent years).  The numerous retail store closures is concrete evidence of this trend.

One factor is that the post-war generation, having earlier established their households and raised their families, are now more focused on saving for retirement. 

Also, note that, after each recession, the ongoing level of spending growth declines.  It seems that the risk (or fact) of unemployment produces both immediate and long lasting cautiousness.

Young adults, entering the workforce during recessions, experience especially tough times at the crucial formative stages of their careers and new families. Often, these tough experiences colours their lifetime spending attitudes.

From a market perspective …

Slower consumer spending implies slower economic growth, slower profit growth, lower inflation and lower interest rates.

(Note that, except for the severe US recession , during the 2008 – 09 recession, consumer spending growth has consistently been positive).

The broad implication is that the current moderate growth and low rate environment will likely be a long term trend.

This is very positive for conservative and retirement-oriented investors (but not attractive for “hot money” since there are fewer opportunities to speculate).

Chart B – The last 100 years 

Interesting patterns emerge here.

As per the left hand circle, in the post- World War II period (an era of rapid post-war construction and “baby boom” oriented families), consumer spending grew at a strong rate.

However, this rapid spending/economic/inflationary growth also led to overheated markets and frequent recessions.  Boom-Bust cycles were frequent and sharp.

  • Between 1948 – 1961              average spending growth was about 5% and recessions occurred every three years on average.  
  • Between  1987 – 2017             average spending growth was about 3% but recessions occurred less than once a decade.

In the current era, as spending growth has moderated, so has the frequency of recession (and associated bear market).