As we continue to be bombarded with ever-increasing negative headlines over these past 6 weeks, with words and phrases such as, “Crisis, Invasion, State of Emergency, Convoy Protests, Covid, Death and Mass Shootings”, it’s a wonder we’re all not hiding under our beds. If you’re familiar with the movie Groundhog Day, you’ll understand when I say I feel like I’m in a loop, writing again about the slippery slope of succumbing to fear.
For those that know me well, I have little tolerance for any type of fear-based language, but this does not mean I am blind to the fact that many are feeling fed-up, despondent and yes, worried.
Therefore, in an attempt to alleviate some of your concerns, I’d like to provide some data that can hopefully shine a light on past stock market performances during previous times of war or hostilities. This is all laid out in the report entitled, “Spheres of Influence”, published by our Global Portfolio Advisory Committee (found here), but for brevity’s sake, I’m narrowing it down to what I feel are the more salient points as they relate to the structure of most of my client portfolios.
Markets tend to bounce back even in the face of serious hostilities and wars
Before looking at one of the specific military risks in Ukraine surrounding this complex geopolitical situation and related sanctions risks, it’s important to consider the market’s past performance during previous wars and high-stakes confrontations.
Historically, military clashes have had limited impact on equity markets both in magnitude and duration—even when the U.S. and Soviet Union were embroiled in the Cuban Missile Crisis.
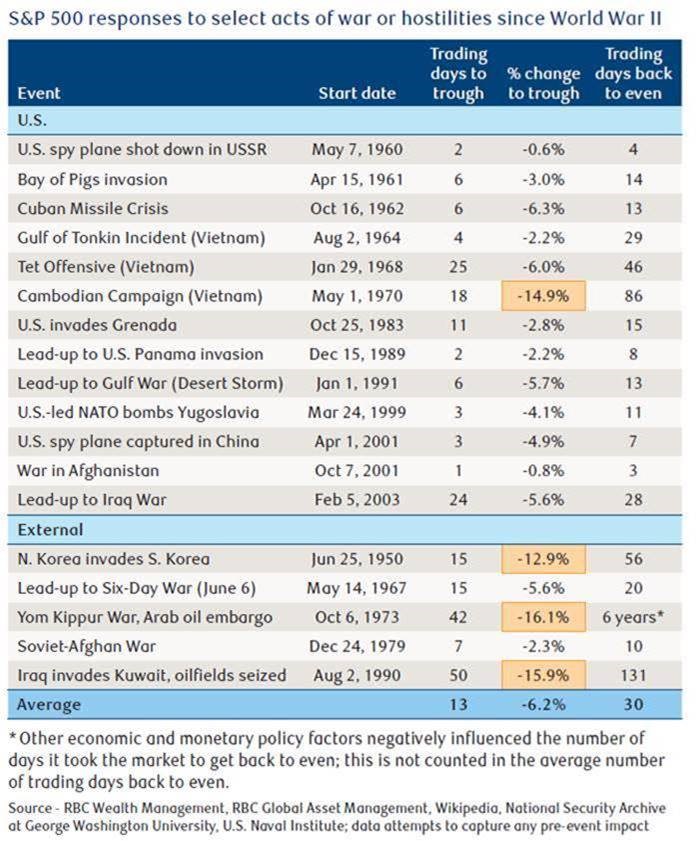
The S&P 500 fell 6.2 percent, on average, in 18 major post-WWII military conflicts or hostilities that we evaluated. That nearly matches the decline the market suffered when U.S. President John Kennedy and Soviet Premier Nikita Khrushchev were at the brink of war.
While that level of decline is nothing to dismiss, it’s well within the bounds of a typical, modest pullback in many scenarios that often confront markets, including those that have nothing to do with military risks.
This chart lays out the data:

Our study of previous geopolitical conflicts indicates the market’s reaction lasted an average of only 30 days before it was able to climb back to even. This occurred despite the fact that many of the actual events lasted longer—sometimes much, much longer.
At times equities weakened during the run-up to a geopolitical conflict.
Equity market vulnerability is typically limited and short-lived
The risks in Eastern Europe, and those associated with Ukraine more specifically, become more understandable when viewed through the wider lens of the ongoing geopolitical dispute between the U.S./NATO and Russia.
This is not a conflict that developed just recently or even in the past few years. It began decades ago, while NATO expanded eastward and became more involved in the post-Soviet space. Things are now coming to a head.
At this stage, we do not recommend adjusting long-term portfolio allocations due to these geopolitical risks, which seem to be shorter-term in nature and could be resolved in coming weeks or months, one way or another.
If you have specific questions as they relate to your portfolio or would like further clarification on anything written here, please do not hesitate to contact me.
Libby
The information contained herein has been obtained from sources believed to be reliable at the time obtained but neither RBC Dominion Securities Inc.* nor its employees, agents, or information suppliers can guarantee its accuracy or completeness. This report is not and under no circumstances is to be construed as an offer to sell or the solicitation of an offer to buy any securities. This report is furnished on the basis and understanding that neither RBC Dominion Securities Inc. nor its employees, agents, or information suppliers is to be under any responsibility or liability whatsoever in respect thereof. The inventories of RBC Dominion Securities Inc. may from time to time include securities mentioned herein. RBC Dominion Securities Inc. and Royal Bank of Canada are separate corporate entities which are affiliated. *Member CIPF. ®Registered trademark of Royal Bank of Canada. Used under licence. ©Copyright 2004. All rights reserved.
* All rates, yields and prices are subject to change

