
The S&P 500’s rally since late October 2023 ranks up there with some of the biggest moves within a short time frame in market history, and the index continues to rack up new all-time highs.
The dominance of the so-called Magnificent 7 technology-oriented stocks (Apple, Microsoft, Alphabet, Amazon.com, NVIDIA, Tesla, and Meta Platforms) that are leveraged to artificial intelligence (AI)—especially in the past year—can’t help but harken back to the Tech Bubble about a quarter century ago.
The Magnificent 7 stocks as a group have surged over 80 percent in the past year, whereas the S&P 500 has climbed around 27 percent through Mar. 4, 2024. When the Magnificent 7 and other technology-oriented stocks are excluded from the S&P 500, the gain is a much more modest 10.8 percent.
With such stark differences between tech and non-tech, it’s no wonder we’re starting to get questions about whether tech stocks are getting bubbly again.
Magnificent 7 stocks surged over the past year
One-year U.S. large-capitalization equity returns
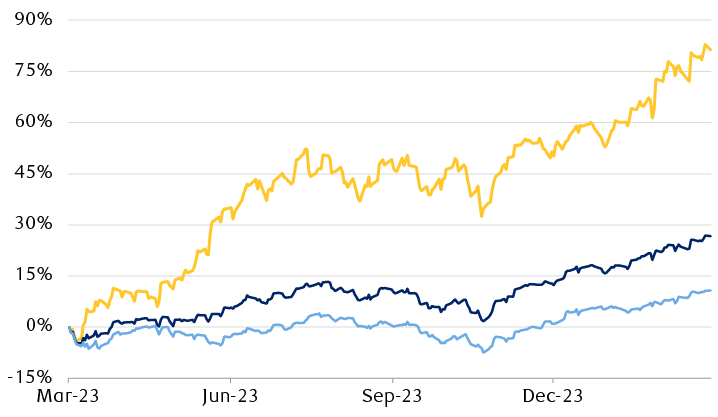
The line chart shows the return performance of three U.S. large-capitalization indexes from 3/6/23 through 3/4/24: The Bloomberg Magnificent 7 Index, S&P 500 Index, and UBS S&P 500 Ex-Tech basket. All three have risen in the past year, but the performance varies widely with Bloomberg Magnificent 7 up 81.3%, the S&P 500 up 26.7%, and the UBS S&P 500 Ex-Tech up 10.8%.
* The Bloomberg Magnificent 7 Index tracks Apple, Microsoft, Alphabet, Amazon.com, NVIDIA, Tesla, and Meta Platforms.
** The UBS S&P 500 Ex-Tech basket tracks the performance of the S&P 500 excluding the Information Technology and Communication Services sectors, plus Tesla and Amazon. Effectively, this excludes technology-related stocks in the S&P 500.
Source - Bloomberg, RBC Wealth Management; data range 3/6/23–3/4/24; price returns (not including dividends)
Broad-minded
First, we think it’s important to distinguish between market trends of the past year and the rally that began following the low in late October.
The Magnificent 7 stocks and technology-oriented stocks in general have dominated both periods. But market performance has broadened out since late October.
Financials, Industrials, and Real Estate—diverse economically sensitive sectors—have risen over 20 percent. Their gains are up there with the three sectors boosted by Magnificent 7 stocks: Information Technology, Communication Services, and Consumer Discretionary. Market performance has gone beyond just the Magnificent 7, and we view this as a healthy sign.
A broad group of sectors has delivered 20%+ returns
S&P 500 Index & sector returns since the 10/27/23 market low
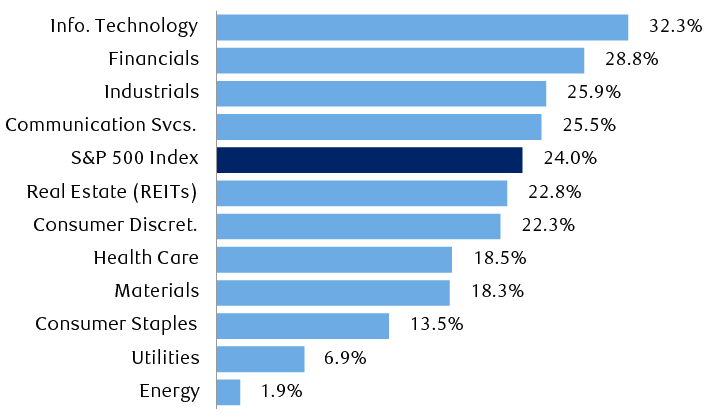
The bar chart shows S&P 500 Index and sector returns from the low on 10/27/23 through 3/6/24. The returns from best to worst: Information Technology 32.2%, Financials 28.8%, Industrials 25.9%, Communication Services 25.5%, S&P 500 Index 24.0%, Consumer Discretionary 22.3%, Health Care 18.5%, Materials 18.3%, Consumer Staples 13.5%, Utilities 6.9%, Energy 1.9%.
Source - RBC Wealth Management, Bloomberg; data through 3/6/24; price returns (not including dividends)
Since late October, in addition to AI enthusiasm, the market has been driven by solid Q4 earnings results combined with optimism about 2024 profit growth. It also has been supported by sturdy economic data and declining inflation, along with investor anticipation that the U.S. Federal Reserve will start cutting interest rates at some point this year.
That was then, this is now
Second, we think it’s important to consider the key differences between the Tech Bubble peak in March 2000 and conditions today.
The combined price-to-earnings (P/E) ratio of the Magnificent 7 is much lower than that of the so-called “Four Horsemen” stocks (Intel, Microsoft, Cisco Systems, and Dell), the group that powered the Tech sector higher back in the bubble days.
Today, the Magnificent 7 trailing 12-month P/E is 38.3x, whereas 24 years ago the Four Horsemen P/E was an extremely pricey 82.7x, according to Bloomberg.
Beyond the Four Horsemen, part of the rally during the Tech Bubble era was fueled by companies with no earnings and some that barely had operational track records. These were dot-com firms that went public practically overnight—and collapsed almost as rapidly.
That’s not the case this go-around. The AI move and rally in other Tech stocks has been fueled by established firms with years of profits in the books, long operational track records, and experienced management teams.
Furthermore, there are valuation disparities between then and now. The S&P 500 as a whole, the S&P 500 excluding the Tech sector, and the five largest stocks by market capitalization are all less expensive today than they were 24 years ago, as the lower chart shows.
U.S. large-cap valuations during the Tech Bubble peak in 2000 versus now
Trailing 12-month price-to-earnings ratios
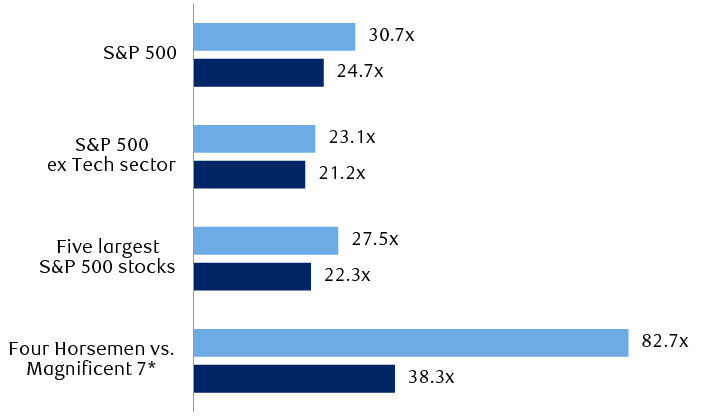
The bar chart shows U.S. large-cap trailing 12-month price-to-earnings ratios in March 2000 when the Tech Bubble peaked versus today (then versus now). The S&P 500 was 30.7x then vs. 24.7x now. The S&P 500 excluding the Tech sector was 23.1 then vs. 21.2 now. The largest five S&P 500 stocks were 27.5 then versus 22.3 now. In 2003, there was a group of four large tech stocks with the nickname of the "Four Housemen" (Intel, Microsoft, Cisco Systems, Dell) which had a P/E ratio of 82.7. Today, the "Magnificent 7," the seven largest technology-oriented stocks (Apple, Microsoft, Alphabet, Amazon.com, NVIDIA, Tesla, and Meta Platforms) trade at a valuation of 38.3x price to earnings.
* “Four Horsemen” was the nickname for four large leading technology stocks from 1996–2002: Intel, Microsoft, Cisco Systems, and Dell. “Magnificent 7” is today’s nickname for seven large leading technology-related stocks: Apple, Microsoft, Alphabet, Amazon.com, NVIDIA, Tesla, and Meta Platforms.
Source - Bloomberg Intelligence, RBC Wealth Management, Bloomberg; March 2024 data as of 3/4/24
Staying invested and vigilant
At this stage, we don’t think this is Tech Bubble 2.0. But this is no reason to throw caution to the wind.
The S&P 500’s surge since late October ranks with some of the biggest moves within a short time frame in market history. We think the market is bound to take a breather at some point and a pullback can’t be ruled out. But precursors of bear markets—lofty investor sentiment and declining market breadth—are not yet in evidence.
Even though valuations are below where they were during the Tech Bubble peak in March 2000, the market is not inexpensive today. Valuations are above average and stretched, in our assessment, and typically don’t stay at such levels for long periods of time.
RBC Global Asset Management Inc. Chief Economist Eric Lascelles estimates that the risk of a U.S. recession is about 40 percent. While this is down from about 70 percent last year, the risk is elevated compared to periods of economic calm. Some leading indicators are still signaling that an economic contraction can’t be ruled out, especially if employment deteriorates and/or inflation becomes sticky or increases.
We think these factors should be reflected by maintaining Market Weight positioning in U.S. equities with a watchful eye on market trends.