...the unofficial end of summer seems to be a special and almost universal demarcation point this year. Most schools and universities across North America and Europe are resuming in-person, and many employers are now requiring office staff to return at least semi-regularly. In addition, emergency unemployment benefits in the US effectively ended yesterday, hopefully thrusting millions more Americans back into the labour pool (more on this in a moment). As the lyrics to the 1990’s hit-song go: “Back to life, back to reality…”.
Even the virus is arguably beginning to show some signs of normalcy, subject to the usual caveat of me having no professional background to say so. For example, while the UK, US and Israel are all experiencing new cases levels in the ballpark of last winter’s surge (left-hand chart below), only the US is seeing a proportional uptick in hospitalizations (right-hand chart below).
New COVID cases and hospital patients, as a percentage of population (per 100,000) UK, US and Israel: Oct 2020 – Present
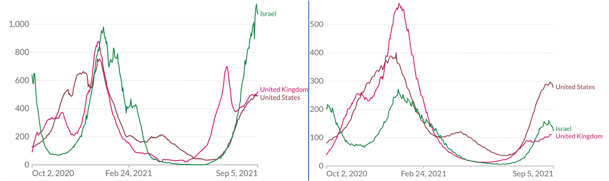
Source: Our World in Data
This is notable, given that:
a) among the most vulnerable age group of 65+, almost 20% of Americans remain unvaccinated, versus only about 10% in Israel and 5% in the UK; and,
b) the CDC has reported studies from major regions (ex. LA, New York) showing the majority of new cases and more than 90% of recent hospitalizations are among unvaccinated people.
So, the country with the highest percentage of vulnerable people still unvaccinated is also experiencing the highest percentage of severe outcomes…seems intuitive. It also suggests that political noise aside, “back to reality” is likely to be the continued modus operandi in regions where vulnerable groups are highly vaccinated, since hospital systems appear able to cope.
Meanwhile, most major economies are still living in a somewhat suspended reality, albeit in a very pleasant one. The Federal Reserve indicated this past month that rock-bottom interest rates will continue indefinitely, even if they do begin to taper QE near the end of this year (which is now a non-event). Credit markets remain wide open, both for high-grade and lower-quality issuers, with investment grade and junk bond yields hovering around all-time lows. Governments globally continue to advance broad new stimulus measures, even as targeted legacy programs roll off. Moreover, and very importantly, the US consumer remains cashed-up and willing to spend. For example, high frequency credit card data shows that despite the virus surge this summer, spending remains well above 2019 levels in all major categories except those directly related to travel (see chart below).
JPM Chase card data – spending by category vs. same period in 2019
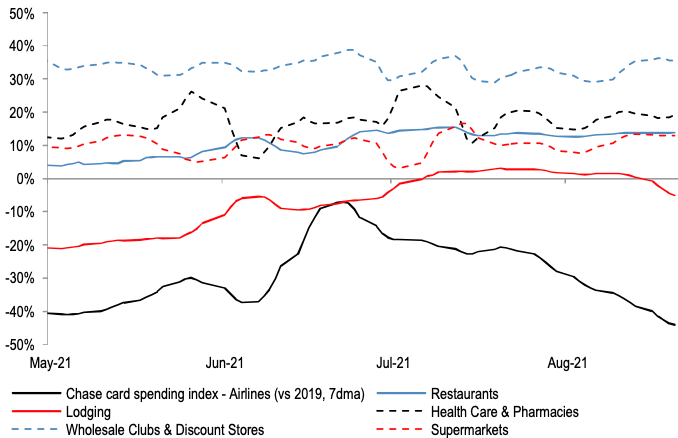 Source: JPM Economics Research, as of Aug 20
To be fair, one can make the case that two meaningful negatives crept into this rosy economic reality during the summer: supply chain constraints and rapidly slowing employment gains. The former, though, is a short-term pain for medium-term gain story. Not only is it more about demand deferral than demand destruction, but it also sets the base for extending strong economic growth well into 2022-23.
As for employment figures – well sure, there were “only” a quarter million jobs added in the US last month, but is that a function of supply or demand? Not enough jobs, or not enough workers? You can see that the answer suggested in the 70-year chart below is about as unambiguous as it gets. To that end, the termination of emergency unemployment benefits in the US – and eventually in Canada – have the potential to actually be very helpful for economic growth in the coming quarters.
US job vacancies rate (1951 – Present)
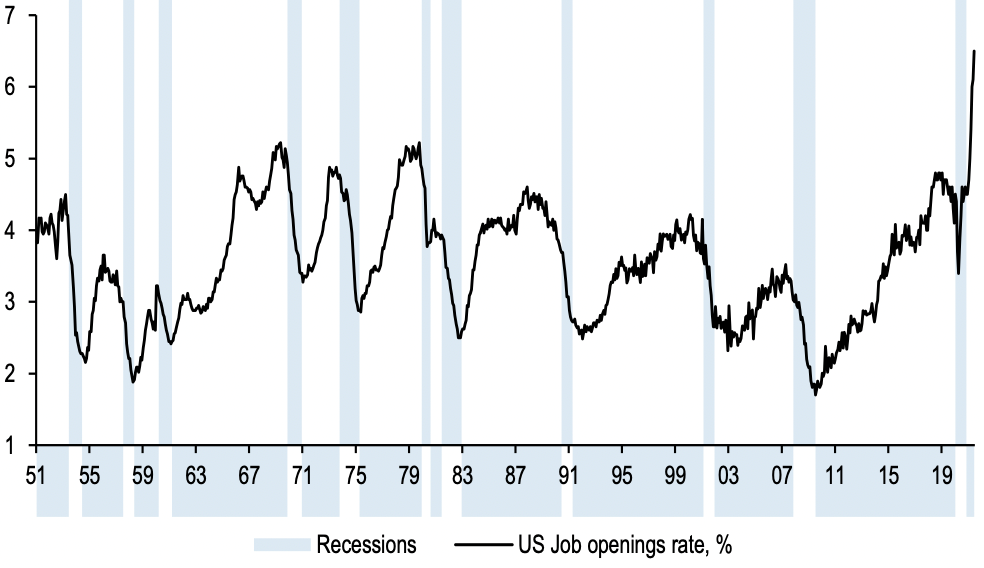
Source: JP Morgan, San Francisco Fed
Of course, corporate earnings are reflecting this environment. As mentioned last month, the quantity and magnitude of positive earnings surprises in Q2 were record-breaking. What has become obvious since then is that the same set-up remains in place for the rest of this year and next. Take the chart below, for example. It shows the progression of consensus estimates for S&P 500 quarterly earnings per share (“EPS”) through 2021. You can see how first-quarter estimates, represented by the solid black line, drifted upward early this year, before bursting higher in April and May as companies reported their actual results, which were stellar (note: the line then goes flat, reflecting that Q1 earnings have become a fact rather than an estimate). The second quarter has followed the same pattern and will now flatline since reporting season has ended. But look at the dashed lines for Q3 and Q4: they are both below that of Q2 (red circle).
S&P 500 blended quarterly EPS estimates: year-to-date progression
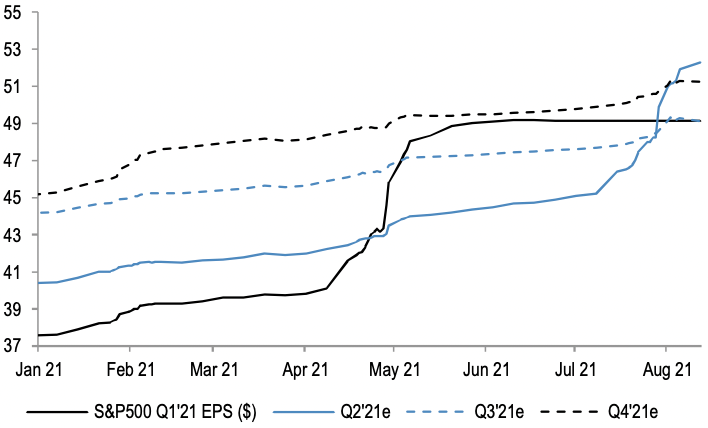
Source: Thomson Reuters, JP Morgan
A sequential earnings decline from quarter to quarter like that is virtually unheard of outside of a recession. It very clearly exposes the fact that Wall St. estimates have not yet increased enough to reflect – well, to reflect reality, which is a bit ironic given the theme of this update.
A strong, historical correlation exists between rising earnings estimates and share price performance, and the former appears to be structurally set to continue rising. In addition, it also implies that stock market valuation multiples are likely lower than they seem at first glance. As the world continues its march back to reality, these factors combined with the others mentioned above suggest that the reality for equity markets continues to appear very rosy indeed.