1. Do you think that the stock market’s valuation (using the S&P 500) is currently cheap, expensive or just right?
2. If the market were to drop during the next 6-12 months, what are the two most likely reasons that you think would catalyze the drop?
Admittedly this is not everyone’s version of “interesting”. However, in a survey of institutional money managers just conducted by RBC, the uniformity of answers to these questions is certainly informative. Only 15% of respondents consider current market valuations to be cheap; and not surprisingly then, more than 80% predict a market correction before the end of this year. The two most likely catalysts for this near-unanimous belief in a coming market drop? Over 70% selected a second wave of coronavirus infections or the outcome of the US Presidential elections.
Any chance those responses aligned with your answers? It sure seems that if you and I are not also predicting a market sell-off for one of these two reasons, then we are just not paying attention. But the important thing here of course is that neither of these two catalysts are predictable events. It isn’t like institutional money managers have definitive data on the virus or the election to which the rest of us are not privy.
As a result, the key observation from an investing perspective is that there is no secret here: everybody knows there is a real risk of a second wave, and everybody knows that there might be election fireworks. That means that in the deep and well-functioning US stock market, the collective opinion on the odds of those outcomes is already in the price. Funny enough, if you and I are predicting that the odds of a market sell-off are far lower than that of the average portfolio manager cited above (and almost certainly below that of the average media outlet), it actually means we’re paying quite close attention to what other investors are saying with their money rather than their words.
Of course, one can take the view that “well, everyone has the odds wrong”. As food for thought however, here are a handful of the most high-profile data points and events that we’ll get to digest during the next month:
• Unemployment data: to be reported this Friday. Likely to be a historically large, positive number;
• Expiration of the generous $600/wk US unemployment benefit: appears likely to be extended by the end of July at a reduced rate or replaced with a back-to-work bonus;
• An additional stimulus package: consistently messaged for later July, if it is to occur. Perhaps $1T+ of spending conveniently approved just months before an election, potentially including infrastructure, travel credits and/or a second round of direct cheques sent to citizens;
• Corporate earnings updates: starting in later July. Likely to be a generally neutral event, with Q2 viewed as “throw-away” and management teams almost certainly continuing to provide very limited outlooks;
• The infection surge in southern US states converting to hospitalizations and deaths – or not.
Of the above, only the last point appears to be a clear potential negative for markets. While it seems intuitive that the southern surge will lead to higher hospitalizations (as is now being reported in Houston) and deaths therefore requiring new lock-downs, that is not the only possible outcome. New infections in the south are rising fastest among lower-risk cohorts. The chart of Sweden’s new cases to new deaths for the month of June provides an interesting possible analog for this; while deaths obviously lag new infections, the two data sets have moved in opposite directions for a full month as that country continues its controversial “no lock-down” approach.
Sweden: Daily new COVID-19 cases and deaths – Feb 15 to-date
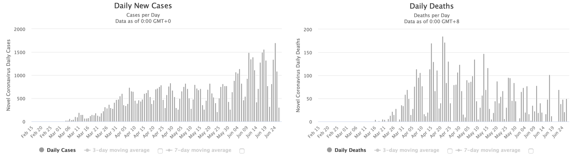
Source: Worldometer
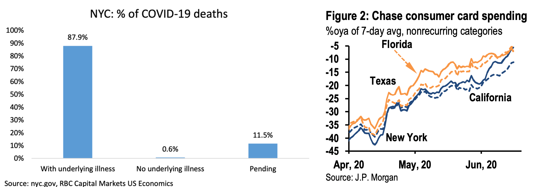
At the same time, it is worthwhile recalling the importance of who precisely gets infected from NYC’s data, as well as just how robust the recovery in consumer spending has been following the lockdowns:
If you were to very simplistically say that the outcome of this new southern surge is coin flip, and also say that the S&P’s decline back in March of around 30% from its highs was appropriate for a very negative COVID outcome, you could argue that the S&P 500 should be therefore currently be around 50% x 30% = 15% below its highs. As it turns out, that’s almost spot-on: it is down 11% from its highs as of Friday. While it is certainly reasonable to suggest the southern surge odds are worse than 50-50, it is also much clearer today than it was in the depths of March that governments globally are willing to pull out all the stops to support the economy, suggesting 30% might have been excessive.
All of this being said, the stock market is not the economy having a view on the market now is perhaps a red herring. After a period like March where correlations on most stocks go to 1, it is natural to feel like equity markets are going to stay that way…but they don’t. Winners and losers emerge, as has been evidenced across the Tech sector – and stocks that would be nice to buy if they go on sale again never really do. This was perhaps best evidenced during the Financial Crisis, when far more stocks made new lows in October & November of 2008 than in March of 2009 when the index price actually bottomed.
Stocks at new 52-week lows (white) versus S&P 500 price (yellow) – Jun 2008-09
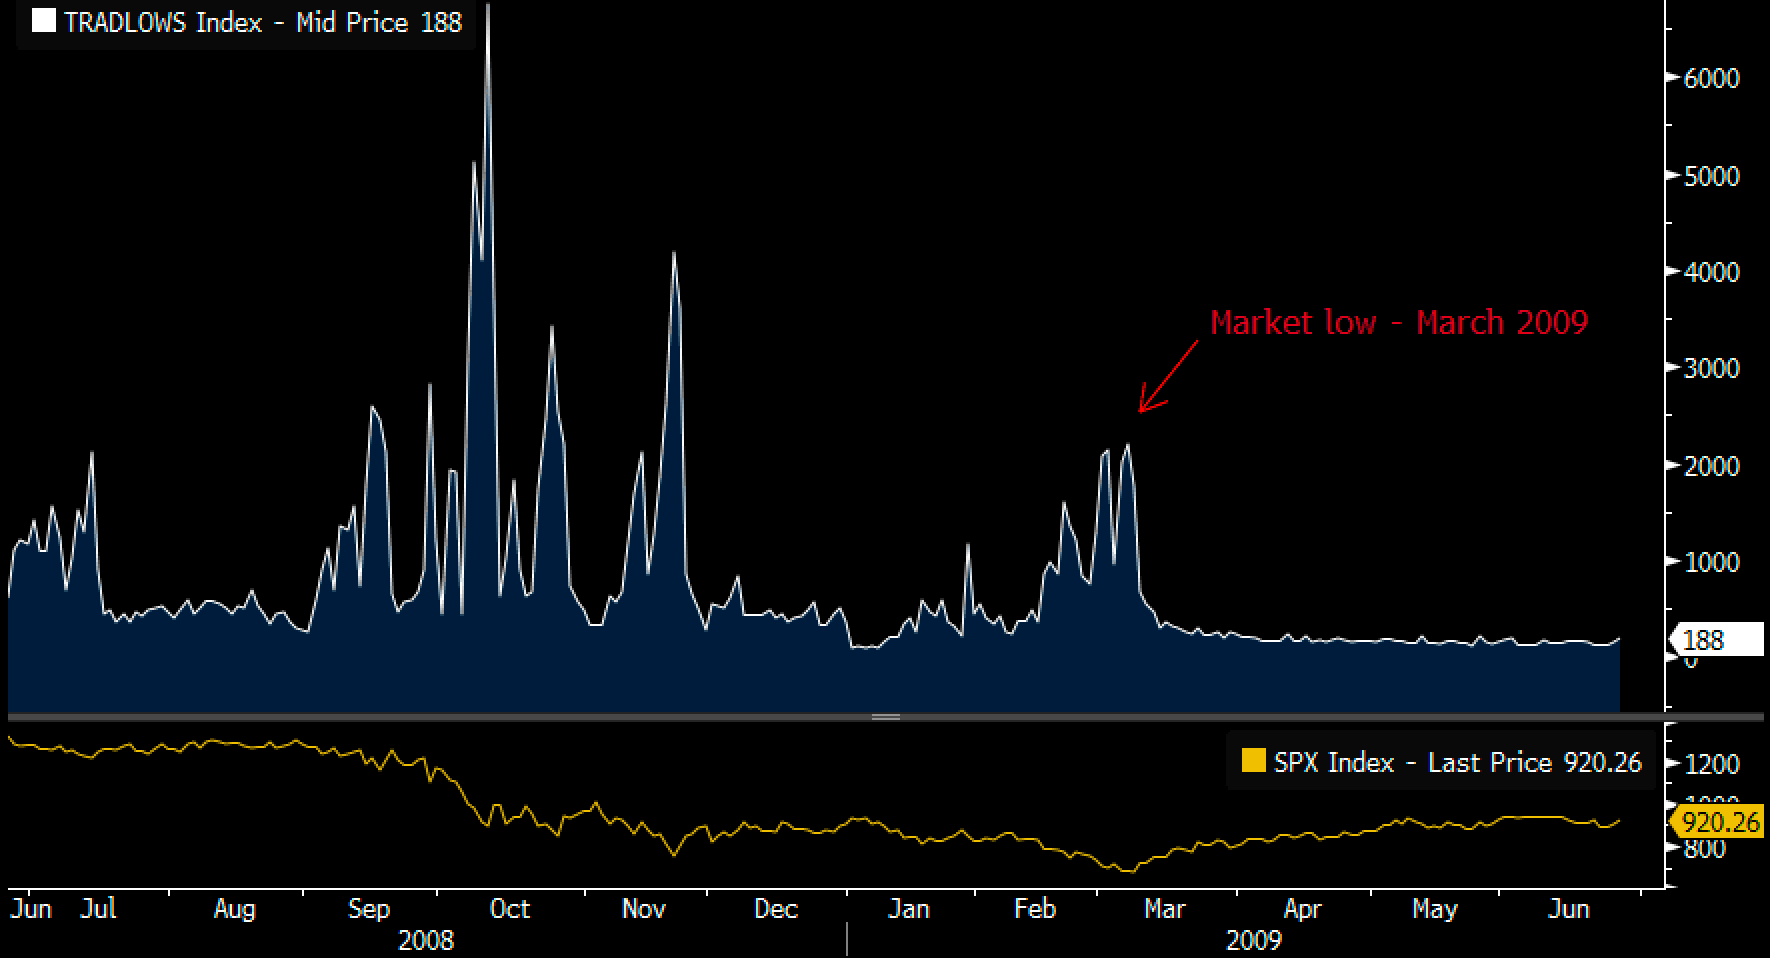
Source: Bloomberg
A rally earlier this month among the secular losers like airlines and travel destinations has now faded. Leadership continues to come from companies with exposure to themes like outsourcing to the cloud, omni-channel commerce and synthesizing data (AI). The market risks that exist right now are no secret, and while they could derail the recovery, at this point the odds appear to be in favour of these trends specifically and the recovery in general continuing.