...correction ever for the US stock market. With a history that includes the Great Depression, Black Monday and the Financial Crisis, achieving a new downside record is no small feat.
There is not much genuinely new territory in finance though, so looking for analogues in extreme moments can be helpful. The sharpest upward moves in share prices generally occur when a cohort of investors must buy a stock for reasons that are real (ex. short squeeze / margin call) or perceived (ex. FOMO), while only a limited pool of sellers exists. Looking at that in reverse, it is easy to understand why there might have been a limited pool of buyers recently: markets have been at all-time highs on above average valuations, and COVID-19 has started to spread outside of China with an impact that is impossible to accurately predict.
But who was forced to sell? Money outflows from mutual funds and ETFs were not exceedingly high this week, and pension funds tend to take a long-term approach that makes them more likely to buy than sell in such moments.
The most obvious remaining cohort is quantitative investment strategies. In fact, one group of these is easy to identify as forced sellers: “vol targeting” strategies are effectively required to sell equities when market volatility spikes, a situation that not just occurred but also accelerated last week. Separately, a quiet debate had emerged among investment strategists over the past few months about whether a “factor bubble” had developed. Algorithmic investment strategies that target specific investment factors – for example Momentum, Quality, ESG, etc. – had been identifying uncommonly overlapping pools of stocks to buy in recent months. Factor models generally evolve and make changes over months rather than days, but when one is in a crowded investment and the market turns sharply lower, the rush to the exits is always fierce.
The takeaway is that the historic speed of this 13% market correction seems to simply be the new reality of operating stock markets that now include a sizable number of semi-automated participants.
With the algorithmic spasm of selling arguably behind us, in the very near-term it is reasonable to expect bigger price swings including a second wave of selling as markets become driven by emotions rather than by economic fundamentals. One of the other new realities of financial markets is that ETFs permit very rapid position changes, facilitating the easy transmission of emotions like fear into market prices. Sales of ETFs and mutual funds in the coming days driven primarily by fearful individual investors could conceivably push market prices down by another 5% - 15%.
Why 5% - 15%? Like adrenaline, fear runs hot but cannot be sustained indefinitely. At some point economic reality takes over. In equity markets, that reality is an aggregate of $163 per share of profit in 2019 by S&P 500 companies. That number was expected to grow by 10% this year and by a similar amount in 2021. While those estimates will no doubt now drop, there are two mitigating factors:
1. A substantial amount of spending is non-discretionary. For example, 70% of North American GDP comes from consumer spending, and using the US inflation measure (CPI) as a gauge, almost 2/3rds of that is spent on sticky items: shelter, food, education and communications. Add in healthcare – where spending could arguably rise – and the total is around 75%. Government spending is a further 20% of GDP, which again could arguably rise if a stimulus package is introduced as a response to the virus.
2. Investors generally determine share prices based on estimates of future earnings rather than present or past earnings. If the consensus view evolves such that the economic impact of the virus is considered a large-but-temporary event, any near-term hit to earnings will be overlooked and prices will be set based on a recovery. This is what we experienced in the rallies that emerged after the growth scares of 2011, 2015 and 2018.
To make this a little more precise, let’s assume that despite the mitigating factors above, estimates of earnings growth contract from a combined +20% in 2020 and 2021 down to zero. Applying the post-Financial Crisis average P/E ratio of 17x would result in the S&P 500 falling to 2,770 ($163 x 17), or a 6% decline from Friday’s close. In an extreme case where estimates predict to a full 10% contraction in earnings or where the P/E ratio drops to 15x (roughly the trough in prior growth scares), the index would fall to 2,500 or 15% from Friday’s close.
These goalposts suggest that the current sell-off is between halfway and two-thirds complete. If emotional selling does indeed take over from mechanical selling in the coming days, a drop of that magnitude would result in a cumulative 20% - 30% decline for the S&P from its peak. That amount encompasses the full historical range of declines experienced in prior recessions short of those including a full-blown liquidity crisis. To that end, some points for context:
• Recessions typically result from tighter lending conditions that are meant to combat inflation. In contrast, both unemployment and interest rates are currently at historic lows and central banks are actively trying to encourage inflation;
• The North American banking system is currently better capitalized than at almost any point in the past century;
• Private Equity funds have an estimated $1 trillion of “dry powder” available to allocate to acquisitions if asset prices sustainably dip; and,
• We have not yet seen any market-supportive news since the outbreak, but very likely will – such as a coordinated stimulus from central banks and OPEC+ production cuts.
In addition, it is worth noting some points of context on the coronavirus (COVID-19) itself:
• The mortality rate is 15% for patients over age 80 but less than 1% for those under age 40 (source: CDC China). While that does not reduce the human impact, it does meaningfully affect the potential economic impact;
• China appears to have been quite successful in halting the spread of COVID-19 (chart below);
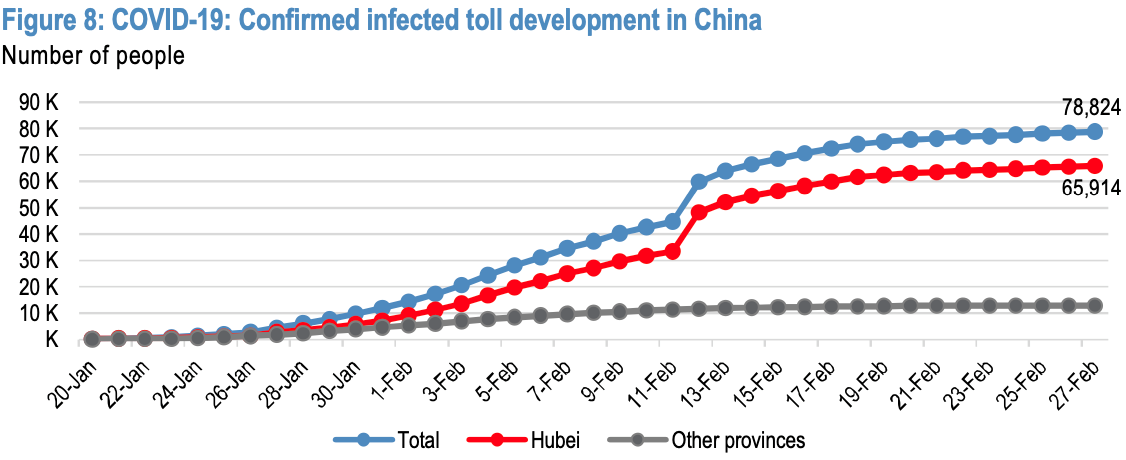
Source: JP Morgan, National Health Commission of PRC
• Given that many cases have presumably gone undiagnosed due to widely reported facility and testing limitations, the overall mortality rate is arguably much lower than reported; and,
• Should COVID-19 prove to share seasonal traits with other viruses…springtime is coming.
In summary then, we have just witnessed a historically fast market correction due in part to a “factor bubble” and quantitative investment strategies. We can now reasonably expect to see some further selling pressure in the coming days stemming from outright fear. However, underlying economic conditions and some of the medical data point to further market weakness being an investment opportunity rather than a moment to hide, particularly given the severity of the equity market correction to-date.
With this backdrop, we have started to reallocate excess fixed income holdings into equities and will continue to do so at an increasingly aggressive pace should equity prices continue to drop. In terms of ways to profit, virus-specific investment themes like buying shares of in-home entertainment companies (ex. Netflix) or disinfectant companies (ex. Clorox) seem superficially appealing, as does buying shares of heavily sold airline companies. However, we view the safest means of profiting from any panic to be accumulating more shares of high-quality, generally cash-rich companies that can weather the storm and grow their market share as their competition struggles.
One final point: an entire field of academia called Behavioural Finance is dedicated to identifying ways in which humans are poorly suited to making investment decisions. One such shortcomings is called Recency Bias, in which humans consistently weight too strongly events that have happened recently relative to those that have occurred in the past.
There are a number of reasons why we have committed ourselves to the (sometimes formidable) task of sending twice-per-month market updates. One of those is to overcome our own Recency Bias. In moments like the present one, it is very difficult to recall why things seemed so positive for equities only a few weeks prior – yet those reasons remain valid and reviewing them is highly useful for maintaining context as novel events like COVID-19 unfold. Taking a few moments to review some of the prior Street Savvy updates on our website together with the points made above can help to provide a sense of mental calm during the current financial media storm.