
Do you find it puzzling when a bleak economic report emerges from the press, only to be accompanied by a positive surge in the stock market? You’re not alone. The last few weeks have produced many examples of a stark contrast between stock market performance and economic indicators. So why the apparent disconnect?
Markets are forward-looking, meaning current asset prices reflect market participants’ aggregate expectations. Those expectations include whatever future economic developments are anticipated and their potential impact on cash flows, which are key to a stock’s value. For example, if the market expects the economic environment to weaken company cash flows, stock markets may react well in advance of when we observe the impact on cash flows, as expectations are embedded in prices. And the eventual direction of the stock market will depend on how the economic outcome compares to expectations. If things aren’t as bad as expected, poor economic news can be greeted with a positive stock reaction.
Looking Ahead
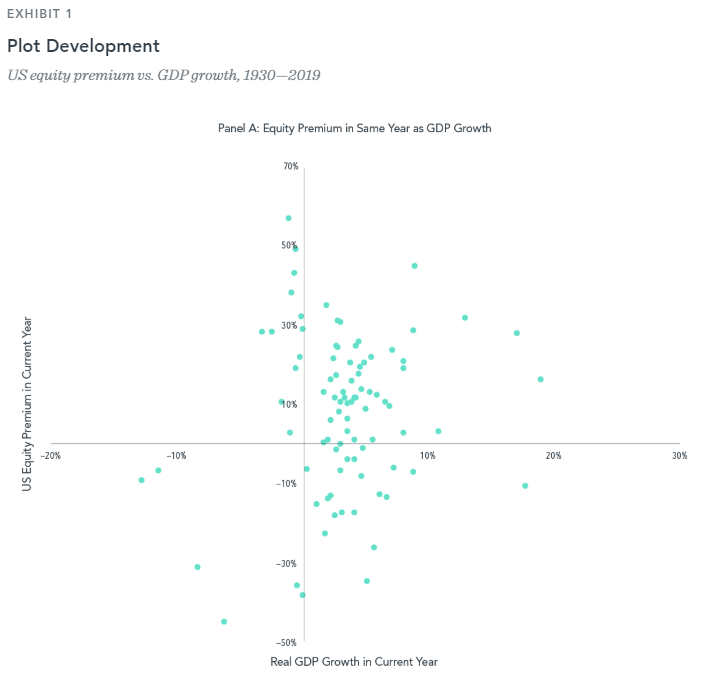
We can see this anticipatory nature of markets in action by looking at the relation between US gross domestic product (GDP) growth and equity premiums, or stock market returns in excess of one-month US Treasury bills. When annual US equity premiums are plotted against GDP growth for the same year (top panel of Exhibit 1), there is no discernable relation between the two. Changes in GDP have not been strongly related to simultaneous stock market returns.
It’s important to note that this result does not imply financial markets ignore macroeconomic data. After all, GDP encompasses several measures of the economy, not just corporate profits. However, while GDP may be an imprecise representation of the activities that ultimately drive stock prices, further analysis shows that is not the sole cause for the lack of relation between GDP growth and simultaneous equity premiums.
Plotting GDP growth against the previous year’s equity premium (bottom panel of Exhibit 1) reveals a noticeable relation. The positive trend in the data suggests market prices have in fact reacted to changes in GDP but have done so in advance of these economic developments coming to fruition. This result is consistent with markets pricing in their expectation of economic growth.

That brings us to the latest news headline worrying some investors: the eventual fallout from increasingly large US government expenditures designed to ease the economic burden of the COVID-19 pandemic. Will these efforts ultimately create a financial burden for the US government that affects future stock returns?
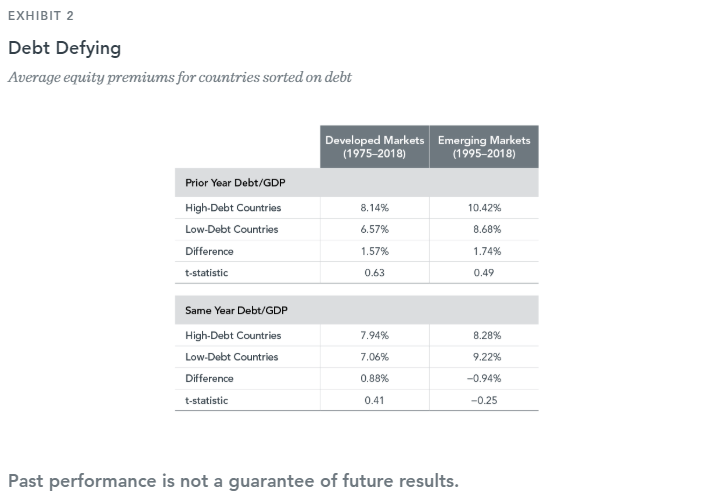
The results in Exhibit 2 should help allay concerns over the debt level impacting equity market performance. When we sort countries each year on their debt-to-GDP for the prior year (top panel), average annual equity premiums have been slightly higher for high-debt countries than low-debt countries in both developed and emerging markets. However, the return differences’ small t-statistics—a measure of the precision of a value’s estimate – suggest these averages are not reliably different from one another.1
The top panel uses prior year debt-to-GDP data to sort countries into the high/low groups. But investors may be more focused on where they expect the debt to end up, rather than on where it’s been. In the bottom panel of Exhibit 2, we rank countries on debt-to-GDP at the end of the current year, assuming perfect foresight of end-of-year debt levels. Again, average equity premiums have been similar for high- and low-debt countries. Like the results for GDP growth, these results imply that markets have generally priced in expectations for future government debt.
Markets at Work
Macroeconomic variables and investment decisions are like frozen turkeys and deep fryers—caution should be exercised when combining the two. The results presented here are consistent with markets aggregating and processing vast sets of macroeconomic indicators and expectations for those indicators. By incorporating this information into market prices, we believe public capital markets effectively become the best available leading macroeconomic indicator.
FOOTNOTES
1) Researchers often cite a t-statistic value of 2.0 as the threshold for statistical reliability.
GLOSSARY
Macroeconomic data: Data used to measure the output of an economy, such as employment or production.
Gross domestic product: The total value of goods and services produced by, for example, a country over a set period of time.
Debt-to-GDP: The ratio of a company’s debt to its gross domestic product.
Fama/French Total US Market Research Index: The value-weighed US market index is constructed every month, using all issues listed on the NYSE, AMEX, or Nasdaq with available outstanding shares and valid prices for that month and the month before. Exclusions: American depositary receipts. Sources: CRSP for value-weighted US market return. Rebalancing: Monthly. Dividends: Reinvested in the paying company until the portfolio is rebalanced.
DISCLOSURES
The information in this document is provided in good faith without any warranty and is intended for the recipient’s background information only. It does not constitute investment advice, recommendation, or an offer of any services or products for sale and is not intended to provide a sufficient basis on which to make an investment decision. It is the responsibility of any persons wishing to make a purchase to inform themselves of and observe all applicable laws and regulations. Unauthorized copying, reproducing, duplicating, or transmitting of this document are strictly prohibited. Dimensional accepts no responsibility for loss arising from the use of the information contained herein.
“Dimensional” refers to the Dimensional separate but affiliated entities generally, rather than to one particular entity. These entities are Dimensional Fund Advisors LP, Dimensional Fund Advisors Ltd., Dimensional Ireland Limited, DFA Australia Limited, Dimensional Fund Advisors Canada ULC, Dimensional Fund Advisors Pte. Ltd, Dimensional Japan Ltd., and Dimensional Hong Kong Limited. Dimensional Hong Kong Limited is licensed by the Securities and Futures Commission to conduct Type 1 (dealing in securities) regulated activities only and does not provide asset management services.
UNITED STATES: Dimensional Fund Advisors LP is an investment advisor registered with the Securities and Exchange Commission.
CANADA: These materials have been prepared by Dimensional Fund Advisors Canada ULC. Commissions, trailing commissions, management fees, and expenses all may be associated with mutual fund investments. Unless otherwise noted, any indicated total rates of return reflect the historical annual compounded total returns, including changes in share or unit value and reinvestment of all dividends or other distributions, and do not take into account sales, redemption, distribution, or optional charges or income taxes payable by any security holder that would have reduced returns. Please read the prospectus before investing. Mutual funds are not guaranteed, their values change frequently, and past performance may not be repeated.