
Creating a Downside Protected Income Stream
The late Dow Theorist Richard Russell used to write in the 1990s and early 2000s about how the quest for the baby boomer generation was going to be the creation of a dependable income stream.
When I consider the themes of most of the financial planning meetings I have with clients and prospective clients, I’d have to say Richard was absolutely correct.
The solid pensions of an earlier generation gave way to pension structures that are much less lucrative at best, and non-existent at worst.
Boomers have assets due to their ownership of homes and stocks, but they also tend to carry debt and lack stable income.
The other challenge boomers presently struggle with is the high price tag on stocks, bonds and houses. Blog writers have coined the expression “The Everything Bubble” referring to these hefty price tags due to the long term central bank manipulation of interest rates.
The Everything Bubble makes the commitment to any long term income producing ASSET investment a concern because if the bubble bursts, the income stream being produced by the long term assets, will likely fall significantly more than the income stream being produced.
What are solutions an investor can consider when trying to protect themselves from downside in asset prices and create a solid income stream?
Let’s consider an example of how one might try to accomplish both of the goals of “protection of capital” and “income.” The following questions need to be answered to start the analysis of your long term income stream:
1. How much income do you need your investment portfolio to produce?
We will help you answer this question by tweaking your personal financial projection into the future to see how your assets “stress test” against different rates of return, inflation rates, life events, and anything else you want to stress test them against.
2. How much risk are you willing to accept in your investment portfolio?
Risk is controlled by asset mix. The more diversified and “tactical” your portfolio, the more risk we can control. One the questions I ask here is “What is the largest loss on your portfolio you are willing to accept on a 1 year timeframe and a 5 year timeframe?
3. What does your estate plan look like?
The reason this question is important is because it allows us to decide if a “burn rate” on you principle is reasonable for your personal plan. A burn rate refers to spending capital on present day living expenses.
If you have modest plans for your estate, then a burn rate of capital is OK to plan around. If you have lots of plans for family and legacy giving, then we may want to be more careful to keep our burn rate to a minimum if possible.
It is important to realize that none of these decisions are made in a vacuum in relationship to any other; each question must be considered on its own and then in concert with the other questions.
Now we are ready to set up the investment portfolio.
All the investments in the portfolio will be selected based on the answers to the questions above.
For example, a 3.5% rate of return is required the portfolio will have more latitude as to investment options than if a 4.5% rate of return is required; a 20% decline can be tolerated by the portfolio owner, then the portfolio will have more latitude than if a 10% tolerated decline is chosen, etc.
The reason I am writing about this right now is that the past two months have created one of the best opportunities we have had in the past 4 years to create income-producing stock based portfolios.
Last week I spoke with many of you and we made some adjustments to your plans in these areas. I encourage you to call if you want to talk about these ideas and how they might apply to your financial planning requirements.
Failing to Keep Up
The weekly comment has looked at a pile of different statistics and charts over past years showing that incomes have failed miserably at keeping up with the cost of living in a rising asset price world.
Last week I happened upon a chart that is probably the most startling of all of the charts looking at the relationship between wage levels and cost of living.
The chart below takes the INCREASE in household debt in the United States and relates it to consumption or in economist lingo Personal Consumption Expenditures (PCE).
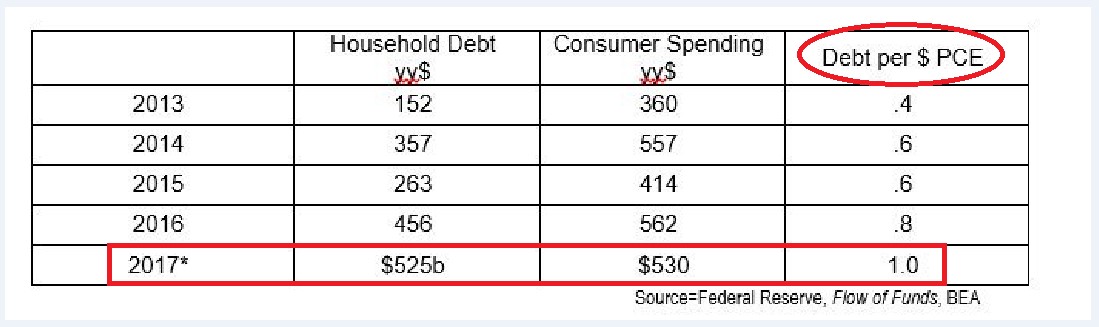
There is not much analysis required for the above graphic.
In 2013, debt grew at a rate of about $0.40 per dollar of consumer spending. In 2017, the entire rate of growth in consumer spending was financed by borrowed money.
I would be willing to stand on a street corner and state that these figures done for Canada would be worse.
Simply stated, if and when asset prices “flatten out”, the ability for consumers to borrow continuously higher amounts against their assets ceases to exist.
RRSP and Tax Free Savings Account Deposits
Just a quick reminder that the deadline for making 2017 RRSP contributions is the end of February. If you need to make your contribution please call me and set up an appointment to get this done either this week or next.
The majority of clients with TFSA accounts have done their 2018 contributions already. If you have not done your contribution or you are not sure, please give me a call and Megan and I will get you taken care of.
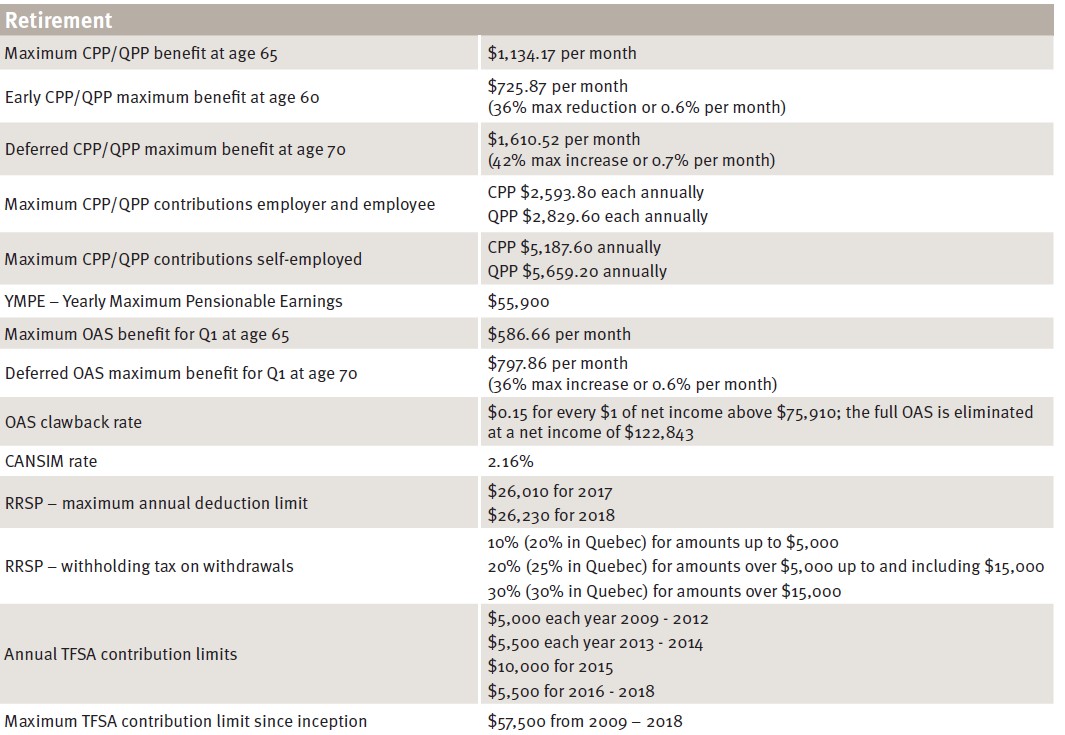
Below is a sheet with some important financial facts applied to the 2018 calendar year:
With the cold snap in the weather, this is a great time to take a closer look at your investment portfolio. Please feel free to ask any questions.