There are few factors more important for the economy and stock markets than
confidence. Without confidence, people wouldn’t invest for the future, expand a
business, buy a home or start a relationship with another person. While there are a
multitude of factors we can look at to provide a forecast for the future, I have
found that a major shift in confidence has been the most reliable tool for
forecasting how the economy and stock market will perform in the next 12
months.
A major shift in confidence occurs when the number of shares that are
advancing and declining on the New York Stock Exchange transition from many
more shares declining than advancing to many more shares advancing than
declining over a period of 10 trading days. This is called a breadth thrust buy
signal. The formula was based on what had happened in the past and was
developed by investor, trader and author Marty Zweig 40 years ago. He knew
that recurring patterns in human psychology often led to similar market
reactions. While our current situation is always unique, there is one factor that
has not changed in thousands of years. That factor is human nature. If we can
see specific human behaviour in the market place that has produced a similar
result over and over again, it becomes a most useful indicator. Most think
economic and corporate information is most useful. I disagree. I am not aware
of any combination of economic factors that has had a 100% accuracy rate.
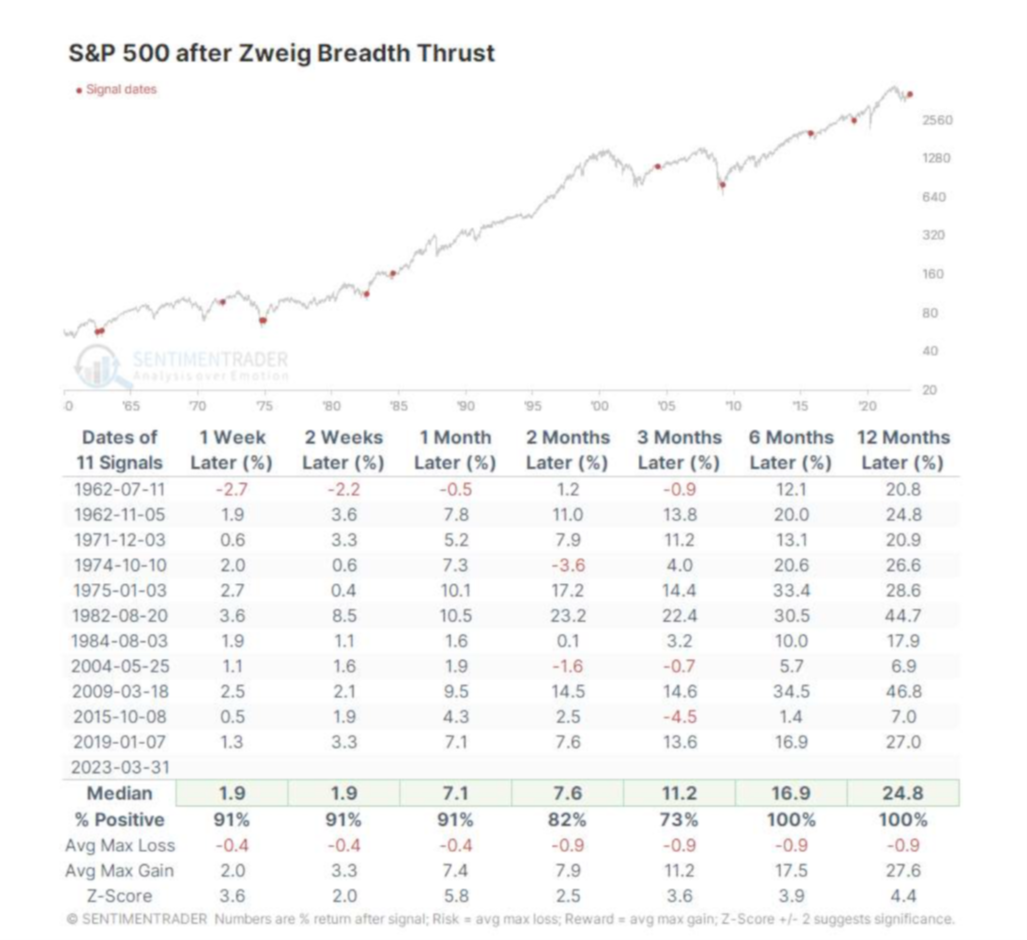
Since 1962, the S&P 500 has been higher 6 months and 12 months after a
breadth thrust buy signal every time with an average gain of 16.9% after 6
months and 24.8% after 12 months. Please see the table below.
Equally significant, Canadian and U.S. economic recessions have ended within
a few months of a breadth thrust signal every time since the 1950’s, no matter
how severe it was. This makes this tool very valuable for every business owner,
entrepreneur, investor, worker and employer. This shift in confidence, which is
captured by this indicator, enables us to recognize a rhyme in market
dynamics. This can help us to navigate the complexities of what is happening
around us with a much better understanding.
A breadth thrust buy signal was triggered by human behaviour on the NYSE
on March 31, 2023. A year ago, the United States was in another banking crisis,
as the Silicon Valley Bank failed on March 10th 2023, along with two other banks.
SVB was the largest bank to fail since the 2008-2009 Financial Crisis. Many
wondered if this was just the start of another major crisis. The unusually heavy
buying by investors in the last 2 weeks of March 2023 forecast that it should not
be the start of a crisis or a recession. This forecast that the crisis was ending. The
forecast was accurate and the crisis did end.
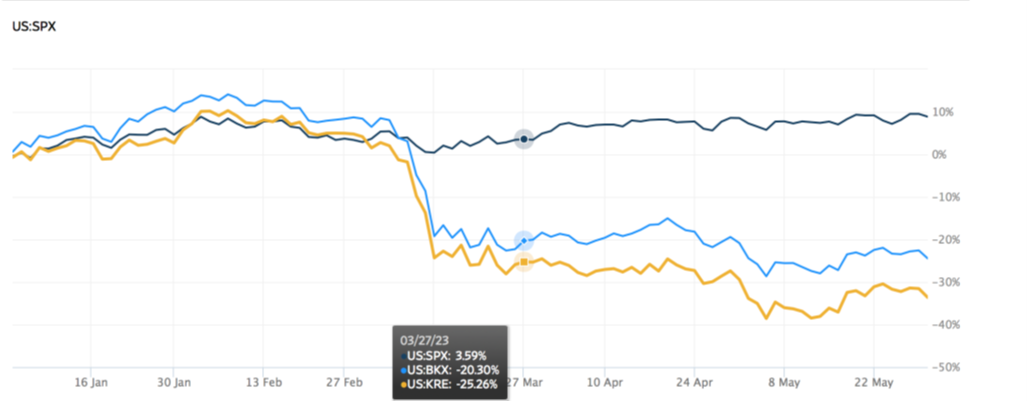
The S&P 500 fell 7% from the February 2023 high to the low on March 13th,
just three days after SVB failed. Then something very interesting happened! The
S&P 500 started rising while the value of financial stocks kept falling. The buying
was so strong that the breadth thrust was triggered just two weeks after the S&P
500 bottomed. The dots on the black line show where the S&P 500 was on the day
of the March 31, 2023 buy signal. It was up 3.59% for the year to date. The blue
line shows that the U.S. Banking Index ETF symbol BKX was down 20.30% for
the year and the yellow line shows that the U.S. Regional Banking Index ETF was
down 25.26% on March 31st.
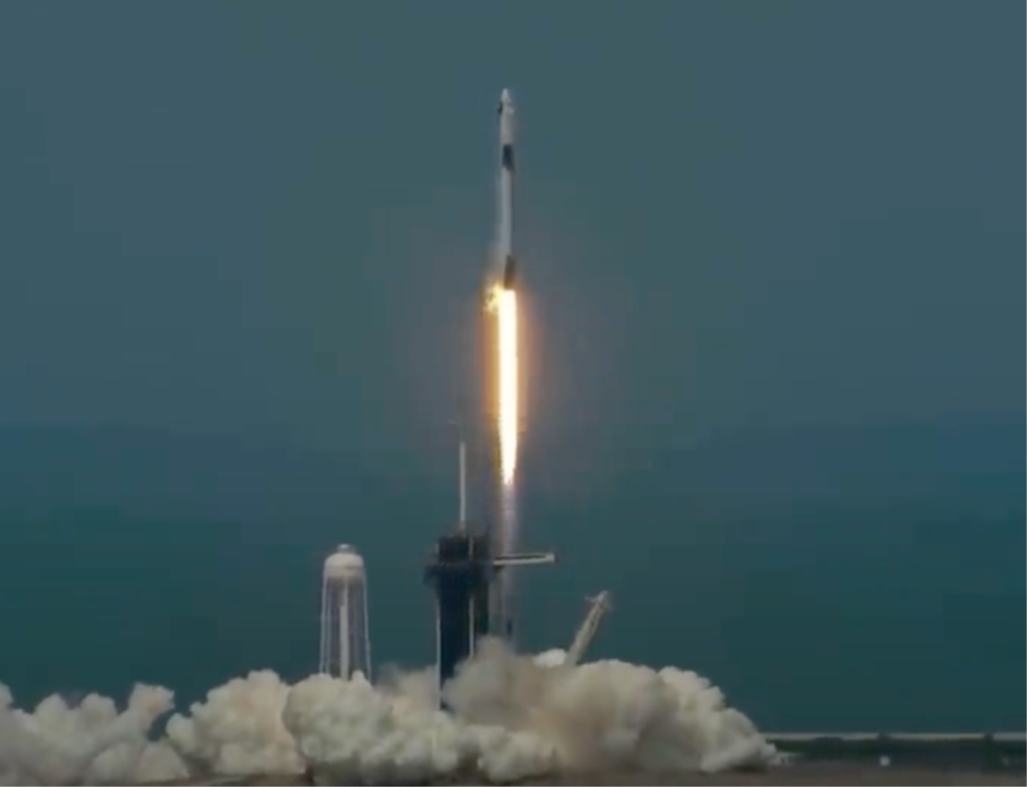
I placed the photo of a rocket taking off on the cover page of these Updates as
of March 31st last year as a weekly reminder of what this indicator forecast should
happen. Now, a year later we can once again look back to see how useful this
indicator was during another crisis when there was a lot of uncertainty and anxiety
about the future. (I include the disclaimer that past performance does not
guarantee future results.)
The S&P 500 was up 1.77% after one month, up 3.14% after 2 months, up
6.28% after 3 months, up 5.01% after 6 months and up 29.87% after 12 months.
Global stocks (MSCI World) were up 23.8% after 12 months, showing once again
that this signal not only affects North America but the entire world. The S&P 400
Mid Cap ETF IJH was up 23.29%, the DJIA was up 22.17% and the technology
laden NASDAQ was up 35.07%.
U.S. banking stocks performed well too, with the BKX up more than the S&P
500 and 400 while the regional banks were up 18.7%.
The Canadian TSX was up only 13.96% and the Canadian Bond Universe ETF
XBB was up a paltry 2.05% even after interest payments. Excluding almost all
Canadian stocks and bonds from your portfolio continues to make a profound
difference to your returns compared to the generally accepted practice of
diversifying into Canadian, U.S. and international stocks.
I will keep the rocket photo on the next page as another breadth thrust buy
signal was triggered 5 months ago on November 3, 2023. One month after
November 3rd 2023, the S&P 500 was up 4.42%. Three months after, the S&P 500
had gained 17.43% and 4 months later, the S&P 500 is up 19.5%. The S&P 400
Mid Cap ETF is now outperforming the S&P 500 by a small margin, rising 20.7%
since November 3rd.
This most recent signal has been accurate again since November, in spite of all
of the concerns about rising interest rates, rising inflation, the fighting in Israel,
the war in Ukraine, worsening relations with China and a forthcoming election
south of the border. If what has happened in the past continues, stocks should be
strong until at least November 2nd of this year.
There are 785 economists working at the Federal Reserve in the U.S. A
recession has been expected and forecast for more than a year now but the
economy seems to be defying all the odds by staying strong in spite of an inverted
yield curve for the longest time in many decades. This breadth thrust signal has
ended recessions in the past so it should be no surprise that a recession has not
started after the signal on March 31st and November 3rd of last year. It seems as
though many are not paying enough attention to how significant this indicator
actually is for the markets and economy.
It was a wonderful Easter weekend in the Fraser Valley! While driving down
the country roads there were many homes that had a lot of cars parked on the
yards as a sign of families and friends gathering together. It was a heart warming
sight.
Here is a photo I took of some of our grandchildren in the front yard looking
for Easter eggs I hid for them. Have a great week my friend!