 Indicators Give Buy Signals, Suggesting Risk is as Low as it Gets, and Potential Gain is as High as it Gets.
When talking about how to be a successful investor, Warren Buffett said,
“We don't have to be smarter than the rest. We have to be more disciplined than
the rest.” He also said, “The most important quality for an investor is
temperament, not intellect.” He is saying that it is critical not to have
unreasonable changes in mood and not to follow the mood of the crowd.
Have you noticed that the education of investment experts is rarely mentioned?
That is because it is not an important factor for investing. The years of experience
and assets under management are the factors that the investment industry respects.
It is similar for pilots. All that matters for pilots is hours of flying time or
experience. Pilots have to ignore their senses and rely on instruments to fly safely
when there is poor visibility.
There is always poor visibility for investors so we also have to rely on
“instruments” to make wise decisions for investments. Studies show that market
experts are only right close to 48% of the time, on average. This shows that
relying on our senses to produce an accurate forecast is just not enough.
This is why I have spent decades studying markets to develop a way to take the
emotions out of the decision-making process in order to make prudent, disciplined
decisions. I have found three tools to determine when a bear market has ended and
a new, longer-term advance has started. To be useful, there must not be any
opinions involved. Decisions like this must be based entirely on how investors are
behaving in the markets. The signals must be simple, clear and decisive.
The first buy signal I use is a system based in Calgary, Alberta that compares
the strength of the major asset classes of stocks, bonds, currencies and cash. This
is called relative strength analysis.
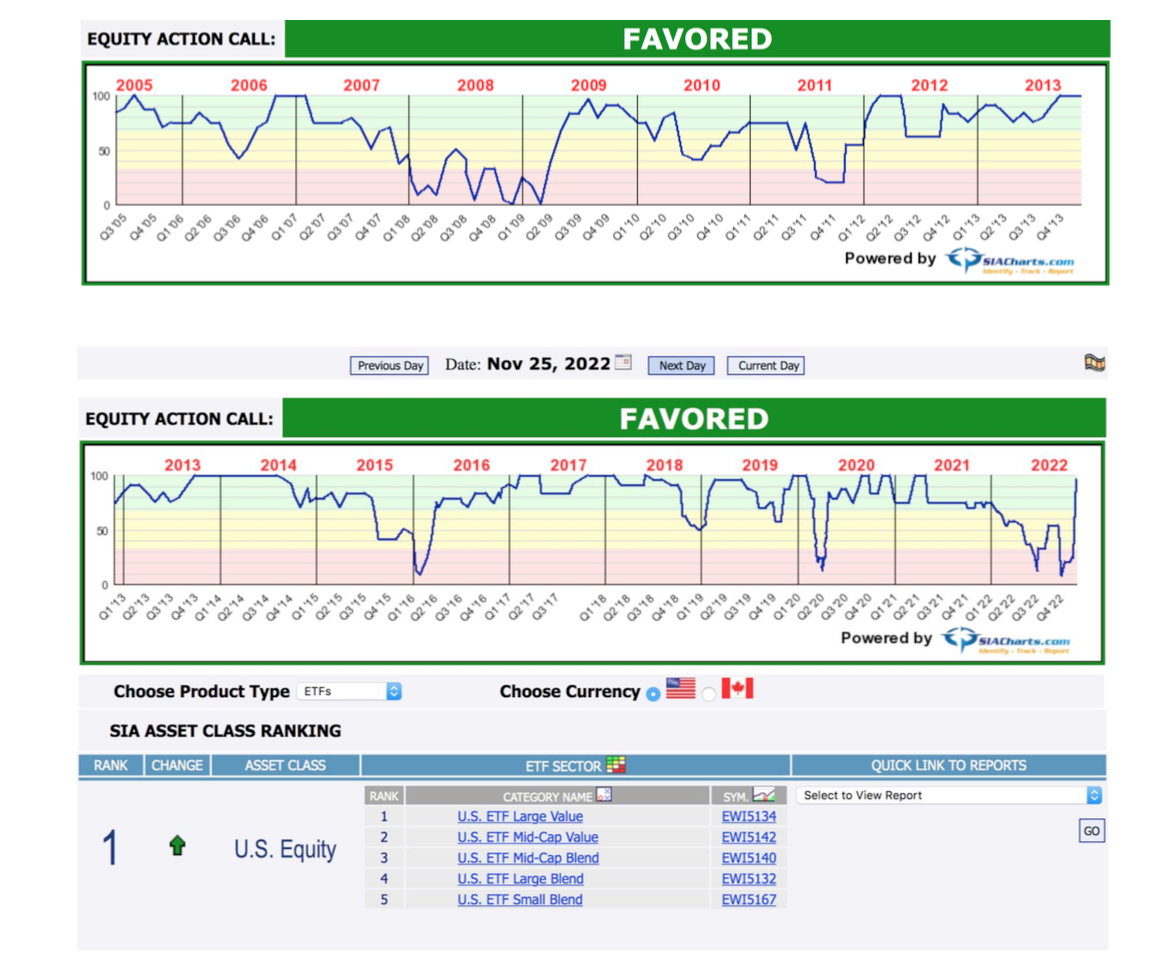
SIA Charts has developed the system below for selling and buying stocks.
There are 3 zones. The green zone is the positive or favoured zone. The yellow
zone is the neutral zone and the red zone is the negative zone. It is a sell signal
when the blue line falls from the green zone into the red zone. It is a buy signal
when the blue line rises back into the green zone after being in the red zone.
There have been 4 buy signals since the inception of this tool in 2005 up to
last month. These dates were May 4, 2009, January 10, 2012, March 29, 2016 and
April 29, 2020. The S&P 500 was up 4 out of 4 times one year later. The lowest
gain was 10.1% and the average increase was 16.8% after 12 months.
If you look at the chart on the bottom you will see that the blue line just rose
from the red zone into the green zone. This happened last Friday on November
25th. In response to this, SIA stated, “Increase equity exposure to the highest
limits of your portfolios, as high as 100% if possible.”

If you look at the bottom of the attachment on the previous page you will see
that US Equity is #1. This means it has exhibited the greatest relative strength
compared to Canadian stocks, international stocks, bonds, currencies and cash.
There can be no debate about the verdict of this indicator. The only decision is if
one is going to accept the verdict.
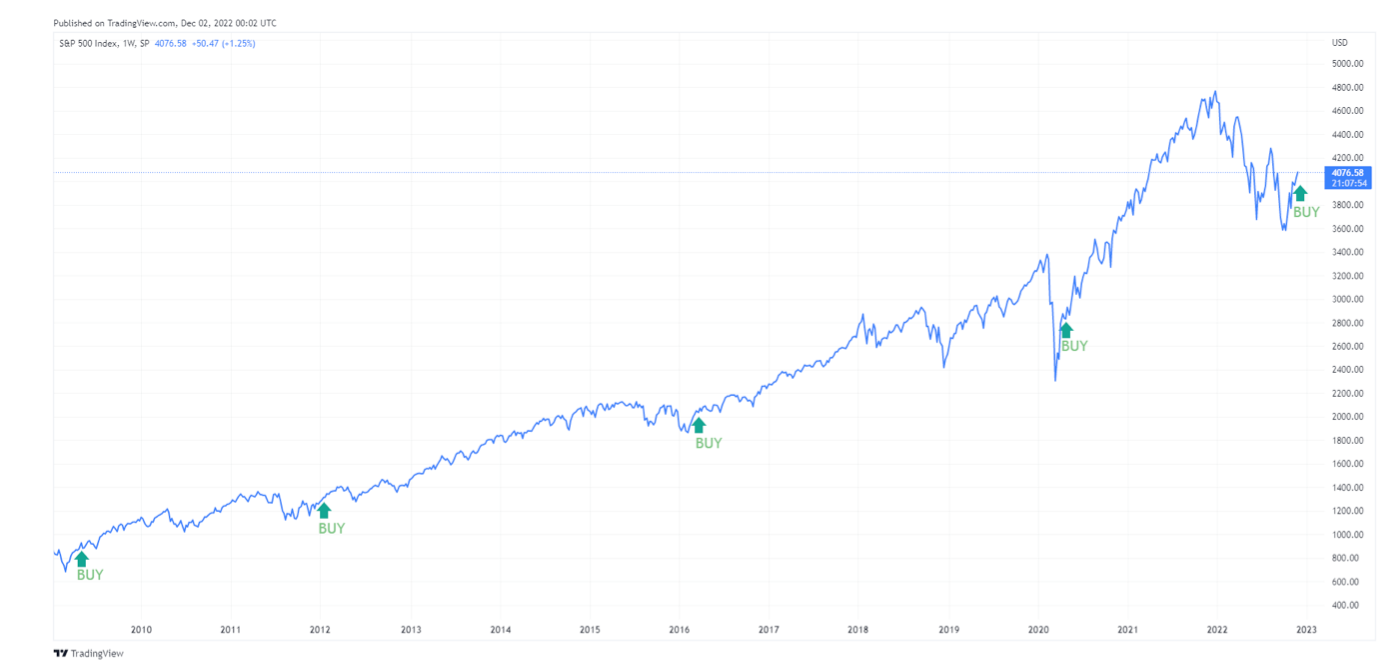
Please see a chart of the S&P 500 showing what has happened after these buy
signals below. (From TradingView) You can see that multi-year advances often
started just before these buy signals.

It is much, much more difficult to know when to sell than to know when to
buy. That is true with this indicator as well. After a sell signal, an investor would
be buying back at a higher price instead of a lower price 3 out of 5 times. The
S&P 500 was higher by 14.1% on average during these 3 times. In May 2009, the
S&P 500 was 25.2% lower than the sell signal, which was a fabulous call to miss
much of the losses during the Financial Crisis. In 2012, the S&P 500 was only 2%
lower at the buy signal than at the sell signal that preceded it. In essence, an
investor really only profited by using these sell signals one out of 5 times.
This is one of the three indicators I have found to be most reliable for buying.
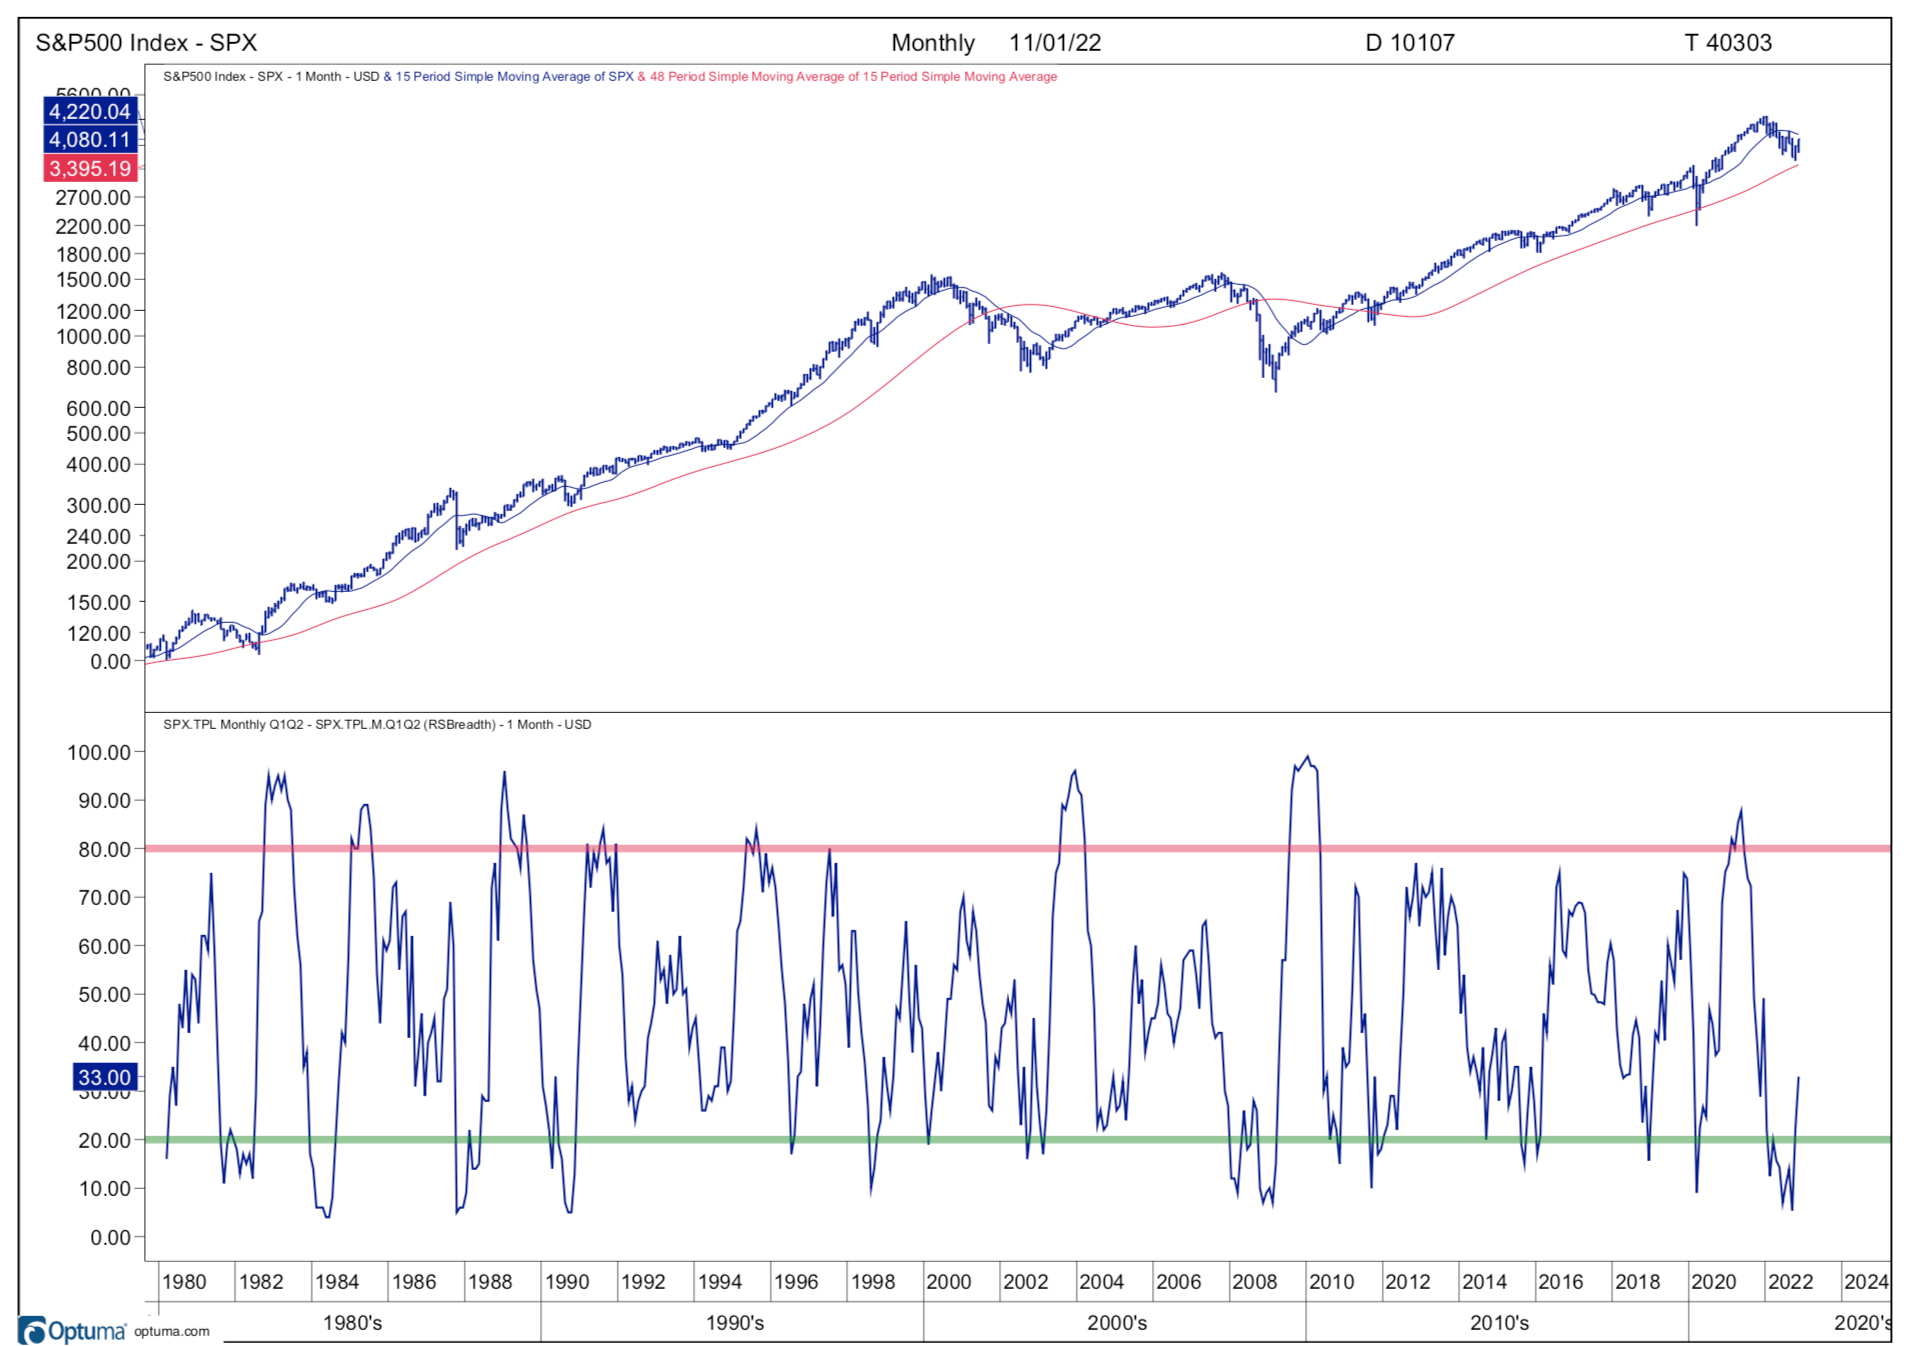
The second indicator I have found to be most reliable has recorded the percentage
of stocks in major market averages that are in an uptrend since early 1982. A buy
signal is triggered by investor behaviour when the percentage of stocks in an
uptrend falls below 20% and then rises above 20% again. I have found that US
stocks have produced attractive returns in the 12 months after 20% or more of the
stocks in the S&P 500 and the TSX have dropped below 20% and then rose above
20% again. The chart below, from Optuma, shows the S&P 500 since 1982 on the
top and the indicator on the bottom. If you look at the bottom right of the chart
you will see that the indicator fell below 20% and is at 33% as of today. The
indicator gave a buy signal for the S&P 500 on November 1st when it was just
above 20%. However, the indicator for the TSX had only risen to 17% as of
November 1st.

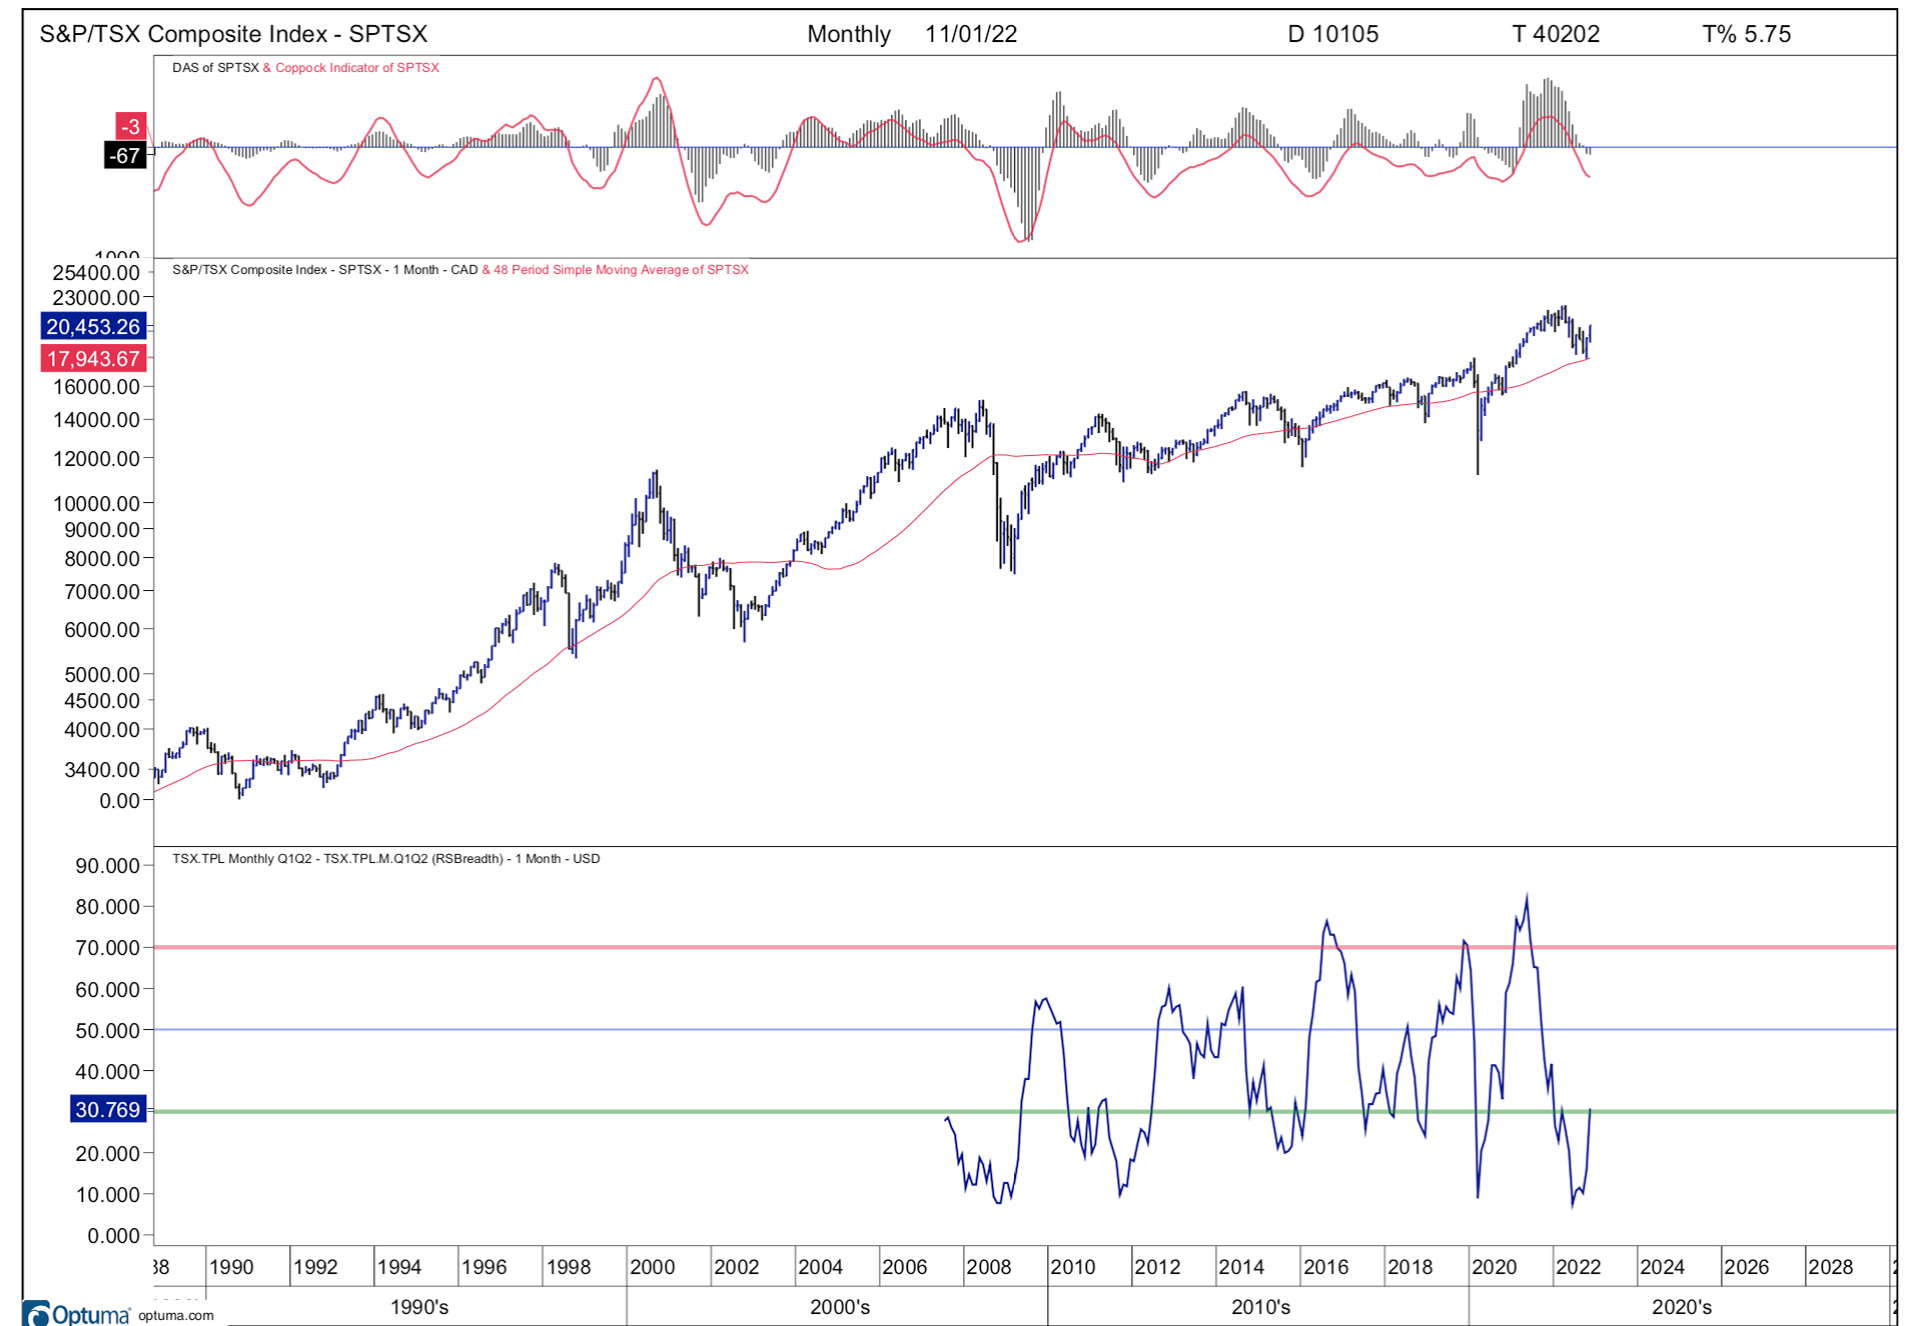
This is a monthly indicator that is calculated at the start of every month. The
next page displays the same indicator for the TSX showing that 30% percent of
the stocks in the TSX are in an uptrend as of today, December 1st. (See the left
hand scale of the charts for the exact level.)

This indicator has now issued a buy signal for investors. The S&P 500 and TSX
have issued 10 buy signals since 1982. This is a period of 40 years! The S&P 500
has been up 100% of the time one year after these signals. The lowest gain after 12
months was 13.35% with an average gain of 29.2%. Again, there can be no debate
about what this indicator is telling us. The only issue open for discussion is
whether you are going to accept the verdict or not.
These indicators show us when the minds of investors switch from looking at
the glass being half empty to being half full. They show us when confidence has
returned, not when all the problems in the world have been solved. If you strip
everything away, confidence is the most critical factor for consumers, business
owners and investors. Very little would happen without confidence. What has
happened in the past shows us that U.S. stock prices have produced very attractive
returns one-year later every time when this much confidence has returned after a
period of great fear and uncertainty. While past performance does not guarantee
future results, this is good as it gets. While it seems that there is still a lot of
uncertainty right now, these indicators are telling us something much
different. They are telling us that the risk is now as low as it gets and that the
opportunity for gains is now as great as it gets. This is why SIA Charts is
recommending that investors move to 100% invested. There are only certain times
(one out of every four years on average) that the outlook can be this clear 12
months into the future, so this is the time to take advantage of it.
The third indicator I use only happens when the rise off of a market low is
extremely strong. The 2-1 Advance/Decline Buy Signal occurs less frequently
than the buy signals mentioned in this Update. It has not issued a buy signal so
far. However, that does not mean that a new bull market has not started. It just
means that the move from the lows has not been extremely strong as it sometimes
can be.
The rebound off the Key Reversal Day on October 13th lows has been very
strong. This has confirmed that stocks have produced the classic double bottoming
pattern which signals that the selling has been exhausted. The DJIA has risen a
total of 19.7% for October and November. In second place is the S&P 400 with a
17.3% gain for the last two months. The S&P 500 is in third place with a gain of
13.5% with the NASDAQ bringing up the rear moving higher by 8.4% in the last
2 months. Now the relative strength tools from SIA Charts and the indicators
showing the percentage of stocks in an uptrend have risen above 20% for the S&P
500 and the TSX. This is the classic progression or sequence of events to show
investors that a bear market has ended and that a new bull market has started.
These are the instruments investors and professional money managers can rely on
at times when uncertainty is at its highest. These are the instruments that create
visibility for the year ahead when many have absolutely no idea what the future
holds. I look forward to giving you the returns generated by these signals a year
from now.
Fed Chairperson Jerome Powell made an important announcement on
November 30th, stating that the pace of raising interest rates could slow down as
early as the meeting on December 13th and 14th. U.S. stock prices jumped 2.5% on
the news. I believe there could be more announcements indicating that the Fed
will not raise rates as much as they expected to just a month or two ago. In the
meantime, thank you for your trust and confidence during this volatile year. The
buy signals that have just been issued in the last week imply that the next year
should be much better and could more than make up for the draw down that may
occur in 2022. A lot can happen in one month in the beginning of a bull market!

If you missed last week’s Update, my wife and I were finally able to take our
entire immediate family (including our 23-year old foster daughter) to the
Hawaiian island of Kauai after two cancelations due to Covid. There were 18 of
us in total. We returned on November 28th.
I am still amazed by air travel. Early in the day, my family and I was seeing
turtles, monk seals and playing in the Hawaiian surf. After watching a movie and
eating lunch while sitting in a comfortable plane for six hours, we have been
transported to a totally different climate, culture and animal life.
The first flights to Hawaii from North America only started 86 years ago in
1936. It carried seven people, took 21 hours and cost a fortune. We are so
fortunate to be alive today. This is an example of innovation that takes place over
time.
Please see the photo below of our two horses in our field of snow.
Clean snow, bright skies and brisk air are wonderful too. Have a great weekend
my friend!


