

 Mortgage Rates May Have Peaked
Central banks like the Bank of Canada, the Federal Reserve in the U.S. and
the European Central Bank only control very short-term interest rates. The
interest rate for mortgages and GICs for longer than 90 days are determined by
the bond markets. Of course, these rates are therefore determined by bond
investors.
Fed Chairperson Jerome Powell has said that they plan to keep raising interest
rates into 2023. However, as last week’s Investment Update pointed out, what Fed
officials have forecast and what they have actually done have been completely
different. For example, in May of 2022, Fed Chairperson Powell said that they
would not raise interest rates by as much as 0.75% at a time. Since May, the Fed
has not just raised interest rates by 0.75% once, or twice or even three times. They
have increased very short-term interest rates by ¾ of a percent four times in the
last six months! It is hard to believe.
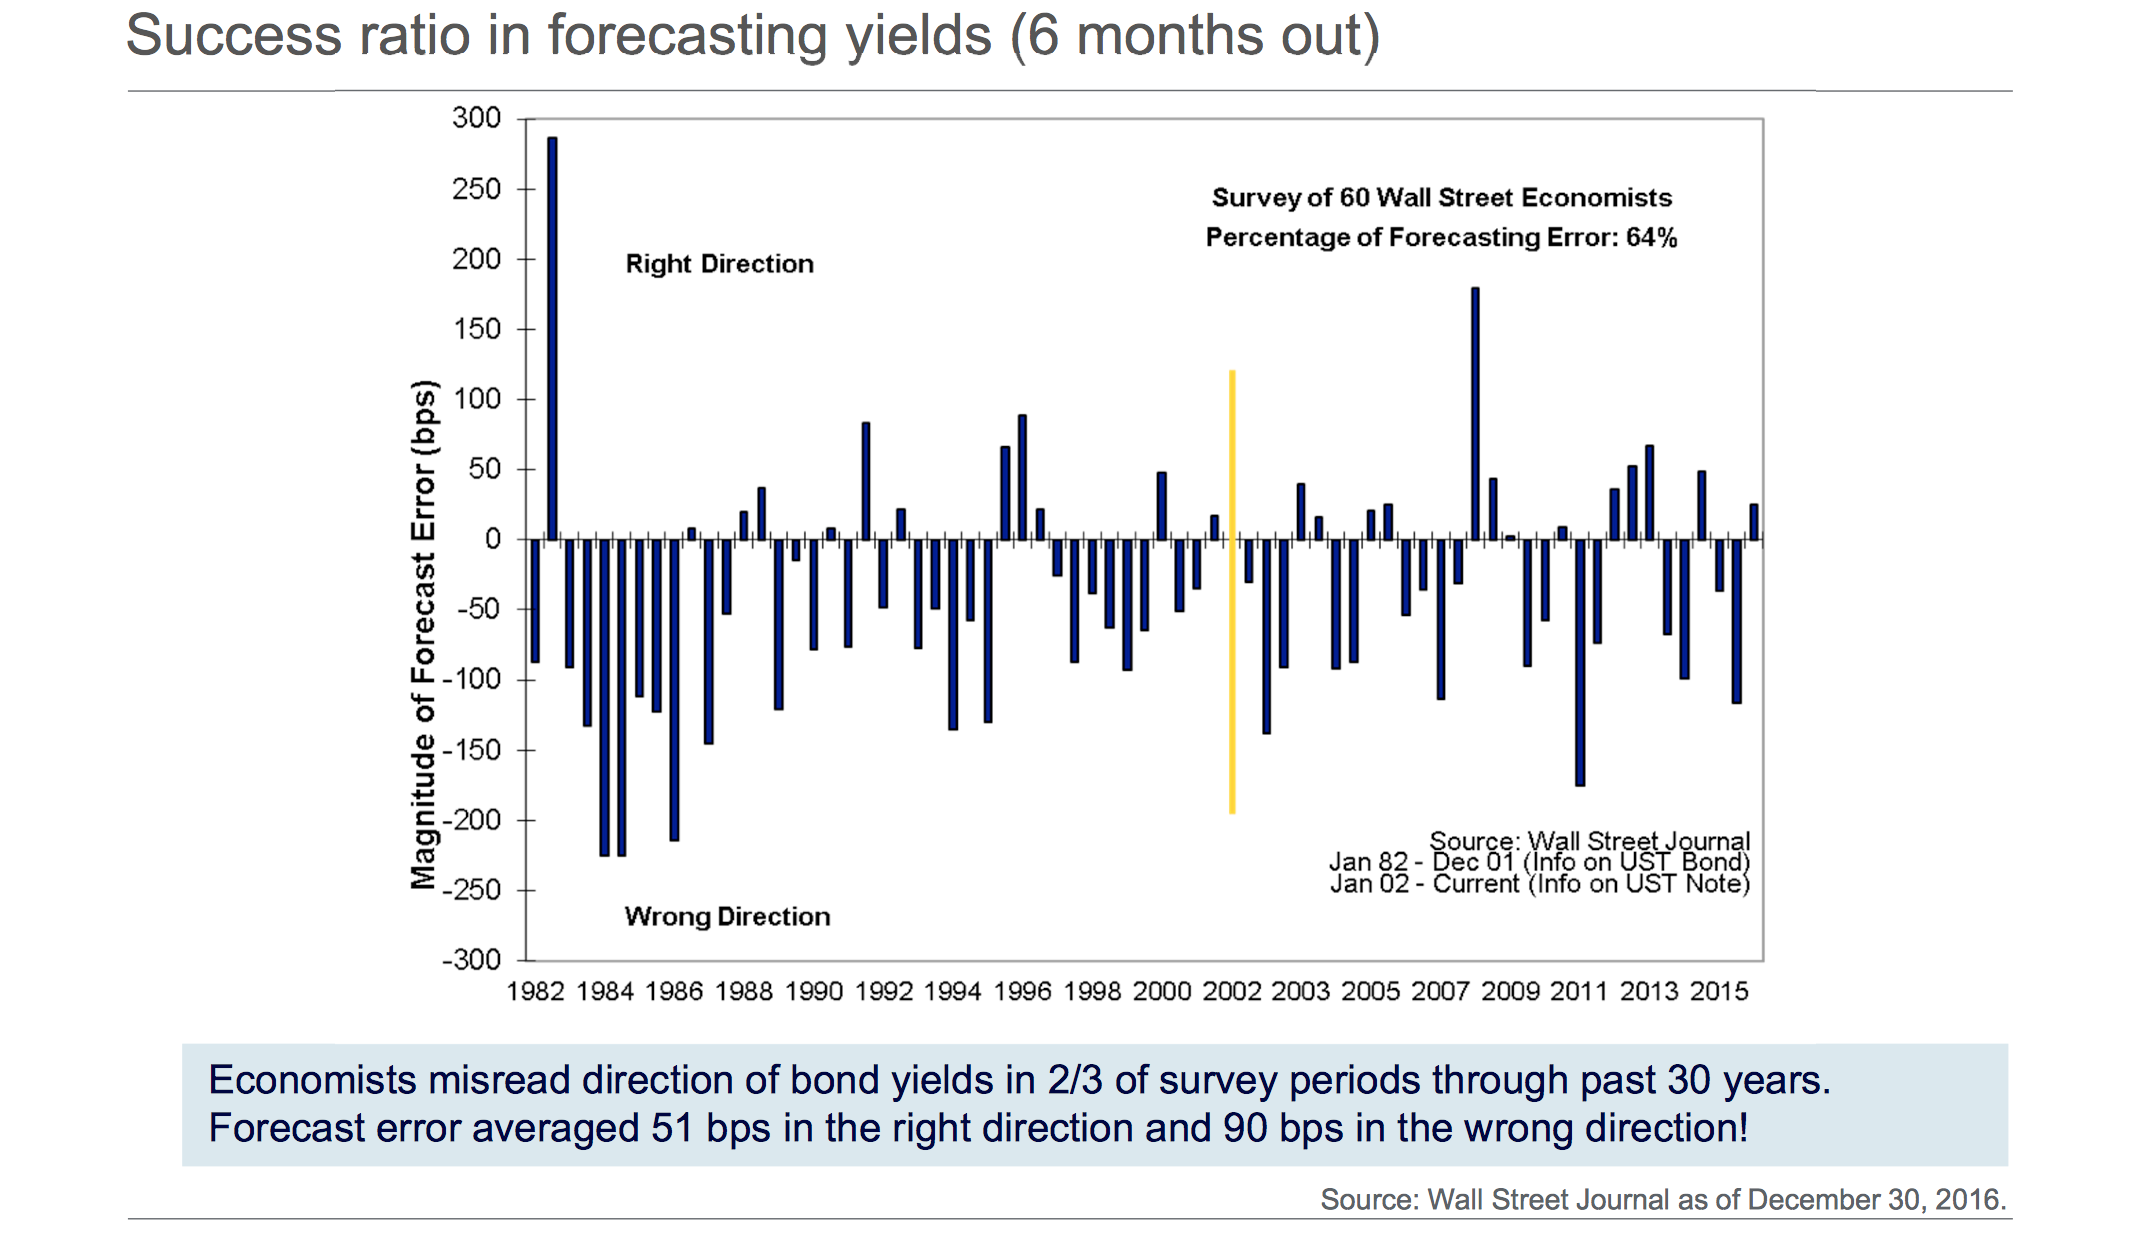
The 35-year study shown below, conducted by The Wall Street Journal in 2016,
showed that interest rate forecasts for six months into the future by economists
were wrong 2/3rds of the time, which means they were only accurate 1/3rd of the
time. Therefore, if we cannot rely on the guidance provided by Fed officials or
economic experts, what can we rely on?
 As mentioned last week, central bank officials do not have a monopoly on
wisdom. They are not superhuman. There are many bond investors and
professional money managers who have just as much wisdom and insight as
central bankers do. Some of them might even have better wisdom and insight.
Therefore, how bond investors are interpreting current data and reacting in the
bond markets can be a very useful guide at a time like this. What has happened in
2022 also shows us that what happens to interest rates has a huge impact on what
happens to stock prices. If this is the case, let us take a look at what has been
happening in the bond market this month.
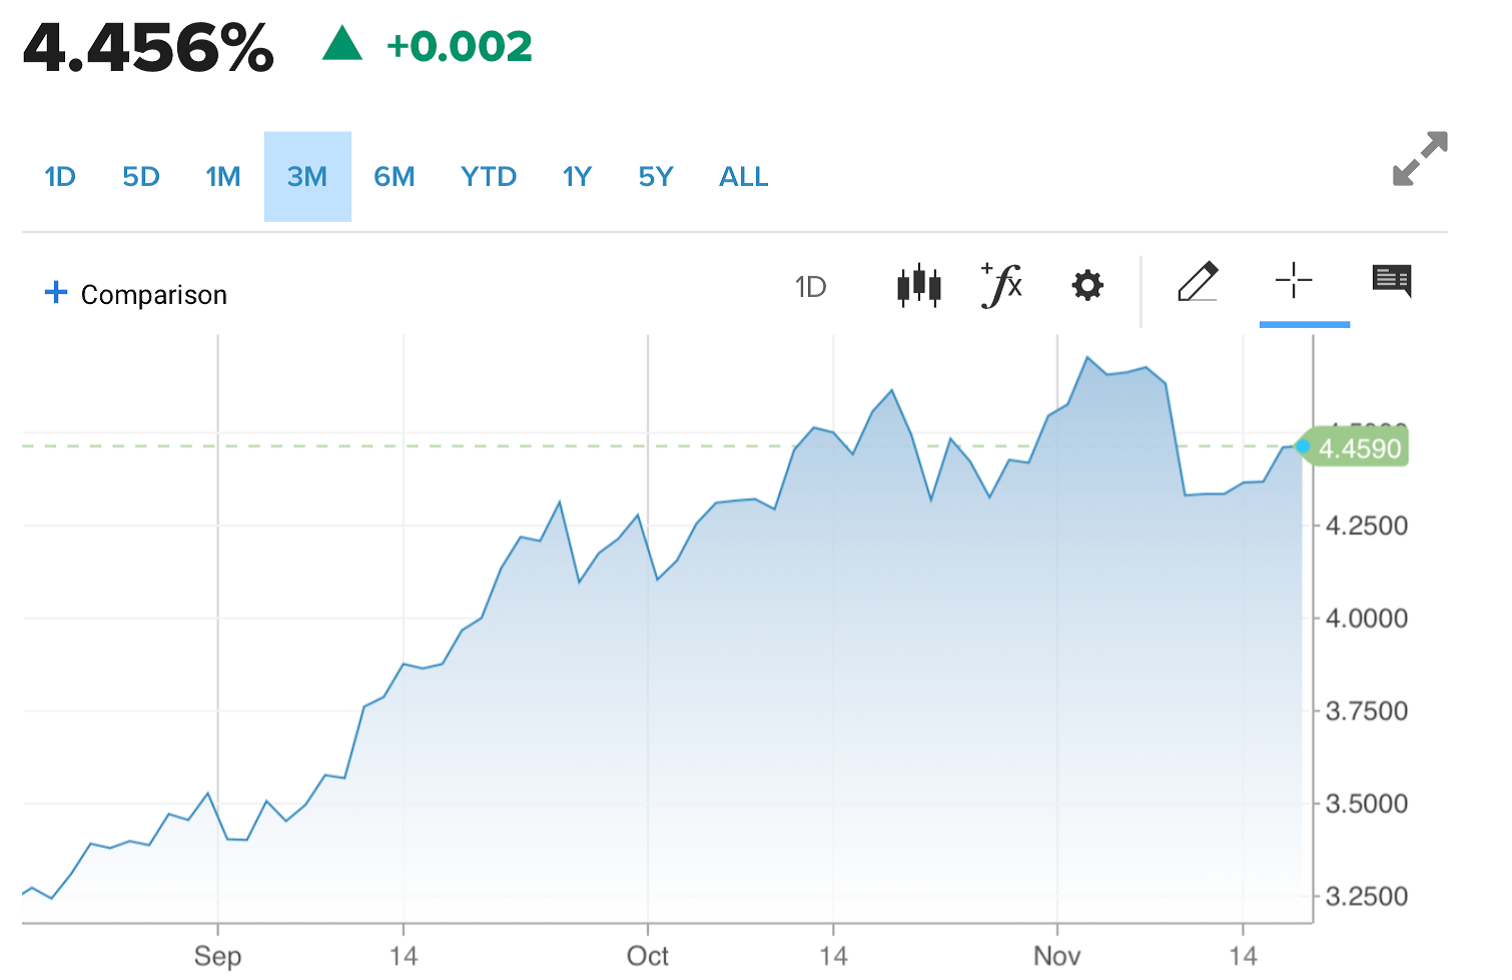
The chart of the 2-year US bond yield over the last 3 months shows that yields
peaked at 4.69% on November 2nd and now trade at a yield of 4.456%. That is a
decline very close to 0.25%. This means that the interest rate on 2-year mortgages
and GIC’s should be 0.25% lower now than they were earlier this month. (Chart
by CNBC.)
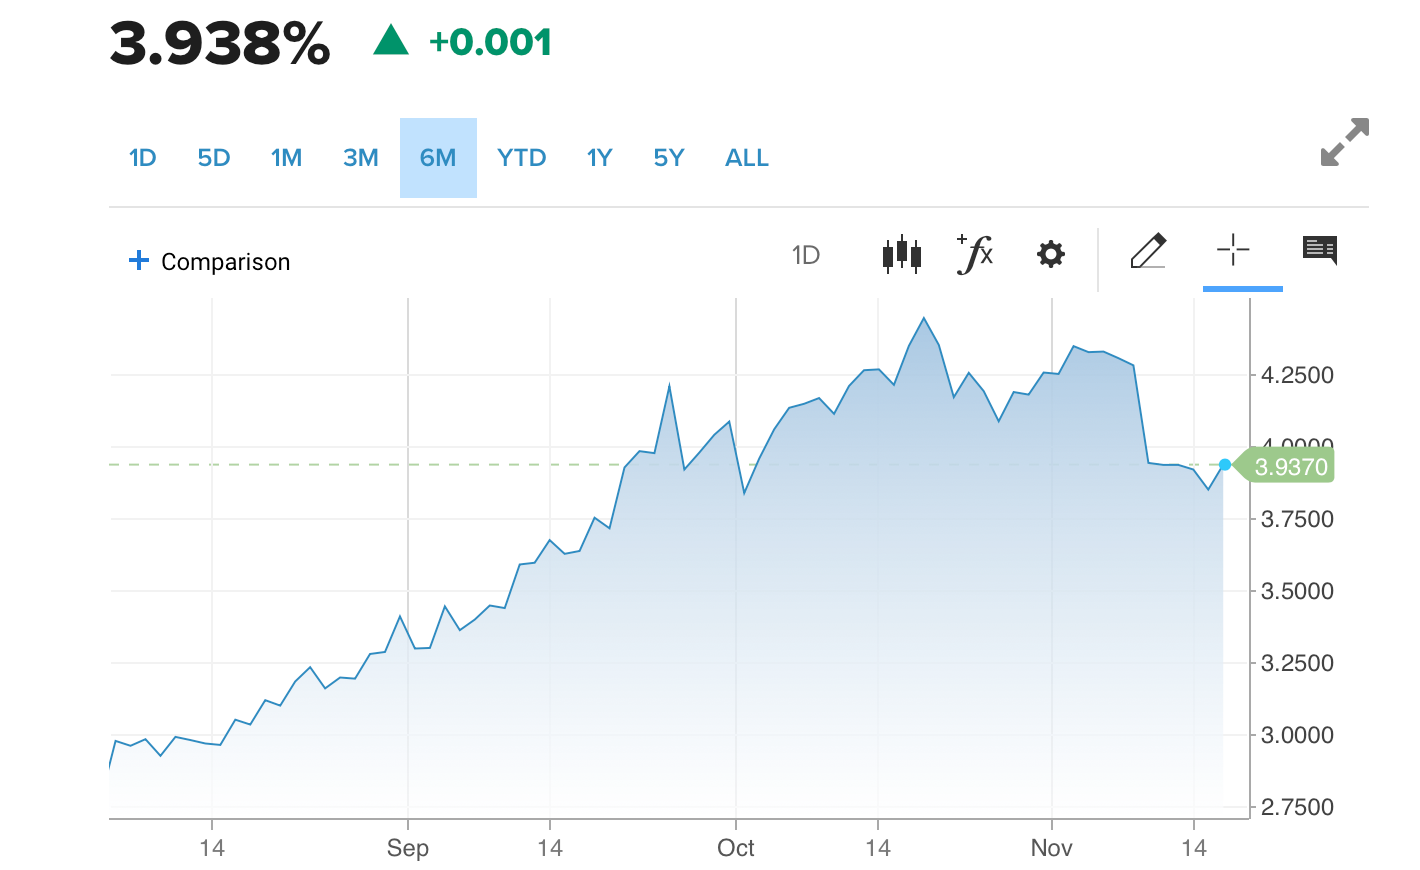
The yield on the U.S. 5-year bond has declined from 4.45% on October 19th to
3.94% today, a decline of 0.50%. This means that the interest rate on a 5-year GIC
and mortgage should also have declined by 0.50% in the last 3 weeks. Please see
the chart of the 5-year US bond yield below.
 Stock markets popped higher by 5.5% on Thursday November 10th when data
showed U.S. inflation fell more than expected. However, stock prices bottomed
on October 13th. As stated above, the 2-year bond price bottomed
on November 2nd and the 5-year bond price bottomed on October 19th. This was
well before the positive inflation news was released last week. This shows how
markets do not just react to the news. This is evidence that prices bottom when
the worst-case scenario is factored into current prices. They bottom when the
selling is exhausted. The news does not show us when this happens, but
oscillators do. More about that below.
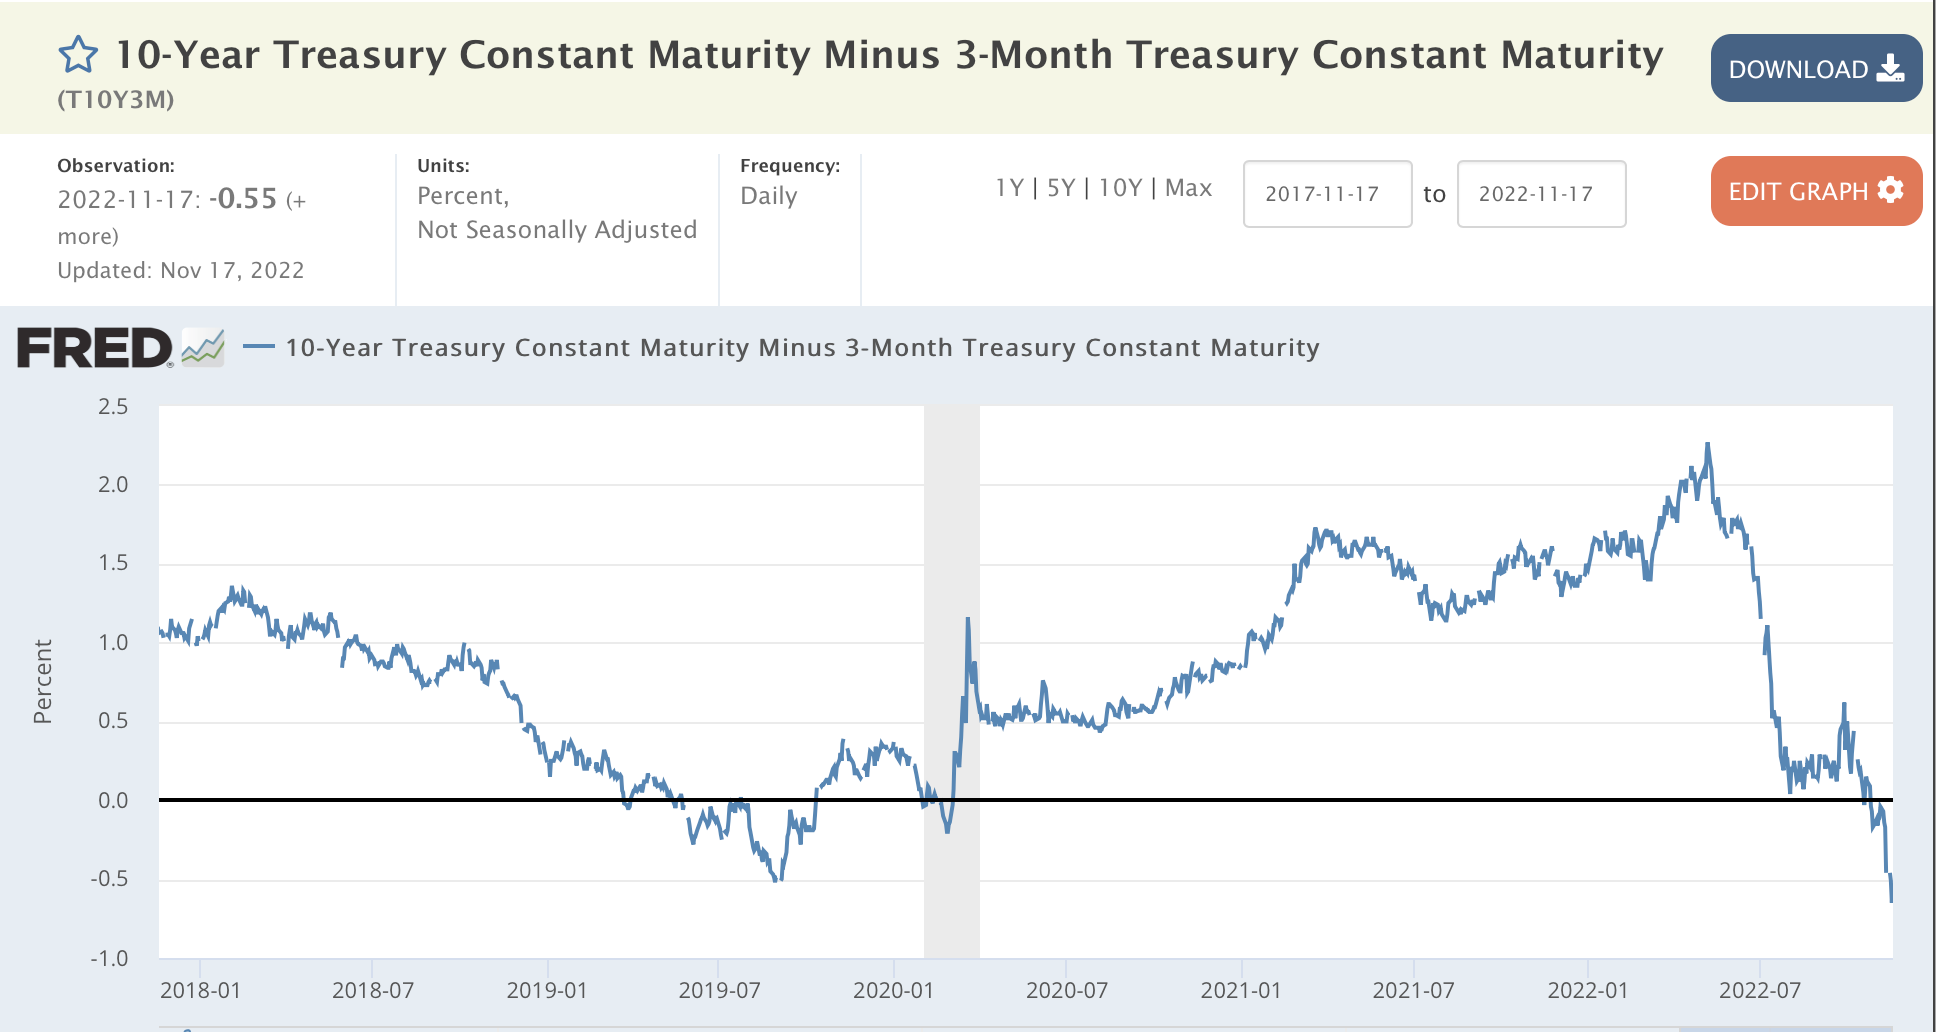
One of the most reliable indicators of an economic recession in the U.S.
occurs when the Fed raises interest rates to the point that short-term interest rates
are higher than longer-term rates. Usually, short-term interest rates are lower than
long-term rates so when short-term rates are higher, it is called an inverted yield
curve because the normal interest rate curve is upside down.
As of today, the yield on a U.S. 3-month Treasury Bill is 4.28%. The yield on
a 10-year U.S. bond is 3.78%. The yield on the three-month U.S. T Bill is now
0.50% higher than the yield on the U.S. 10-year U.S. bond, so the yield curve has
definitely been inverted since late October. This indicates that a U.S. recession is
very likely in the future. No one knows whether it will be a mild recession or a
serious one. At this point, it appears as though the slowdown is mild since
employment is still strong. Please see a chart showing the 3-month vs. 10-year
yield curve from FRED below.
These charts show us what bond investors are thinking today. They do not
suggest what might happen in the future. I have found that oscillators can be very
helpful for providing forward guidance at certain turning points, so please see the
monthly oscillator for the U.S. long-term bond ETF (symbol TLT) below.
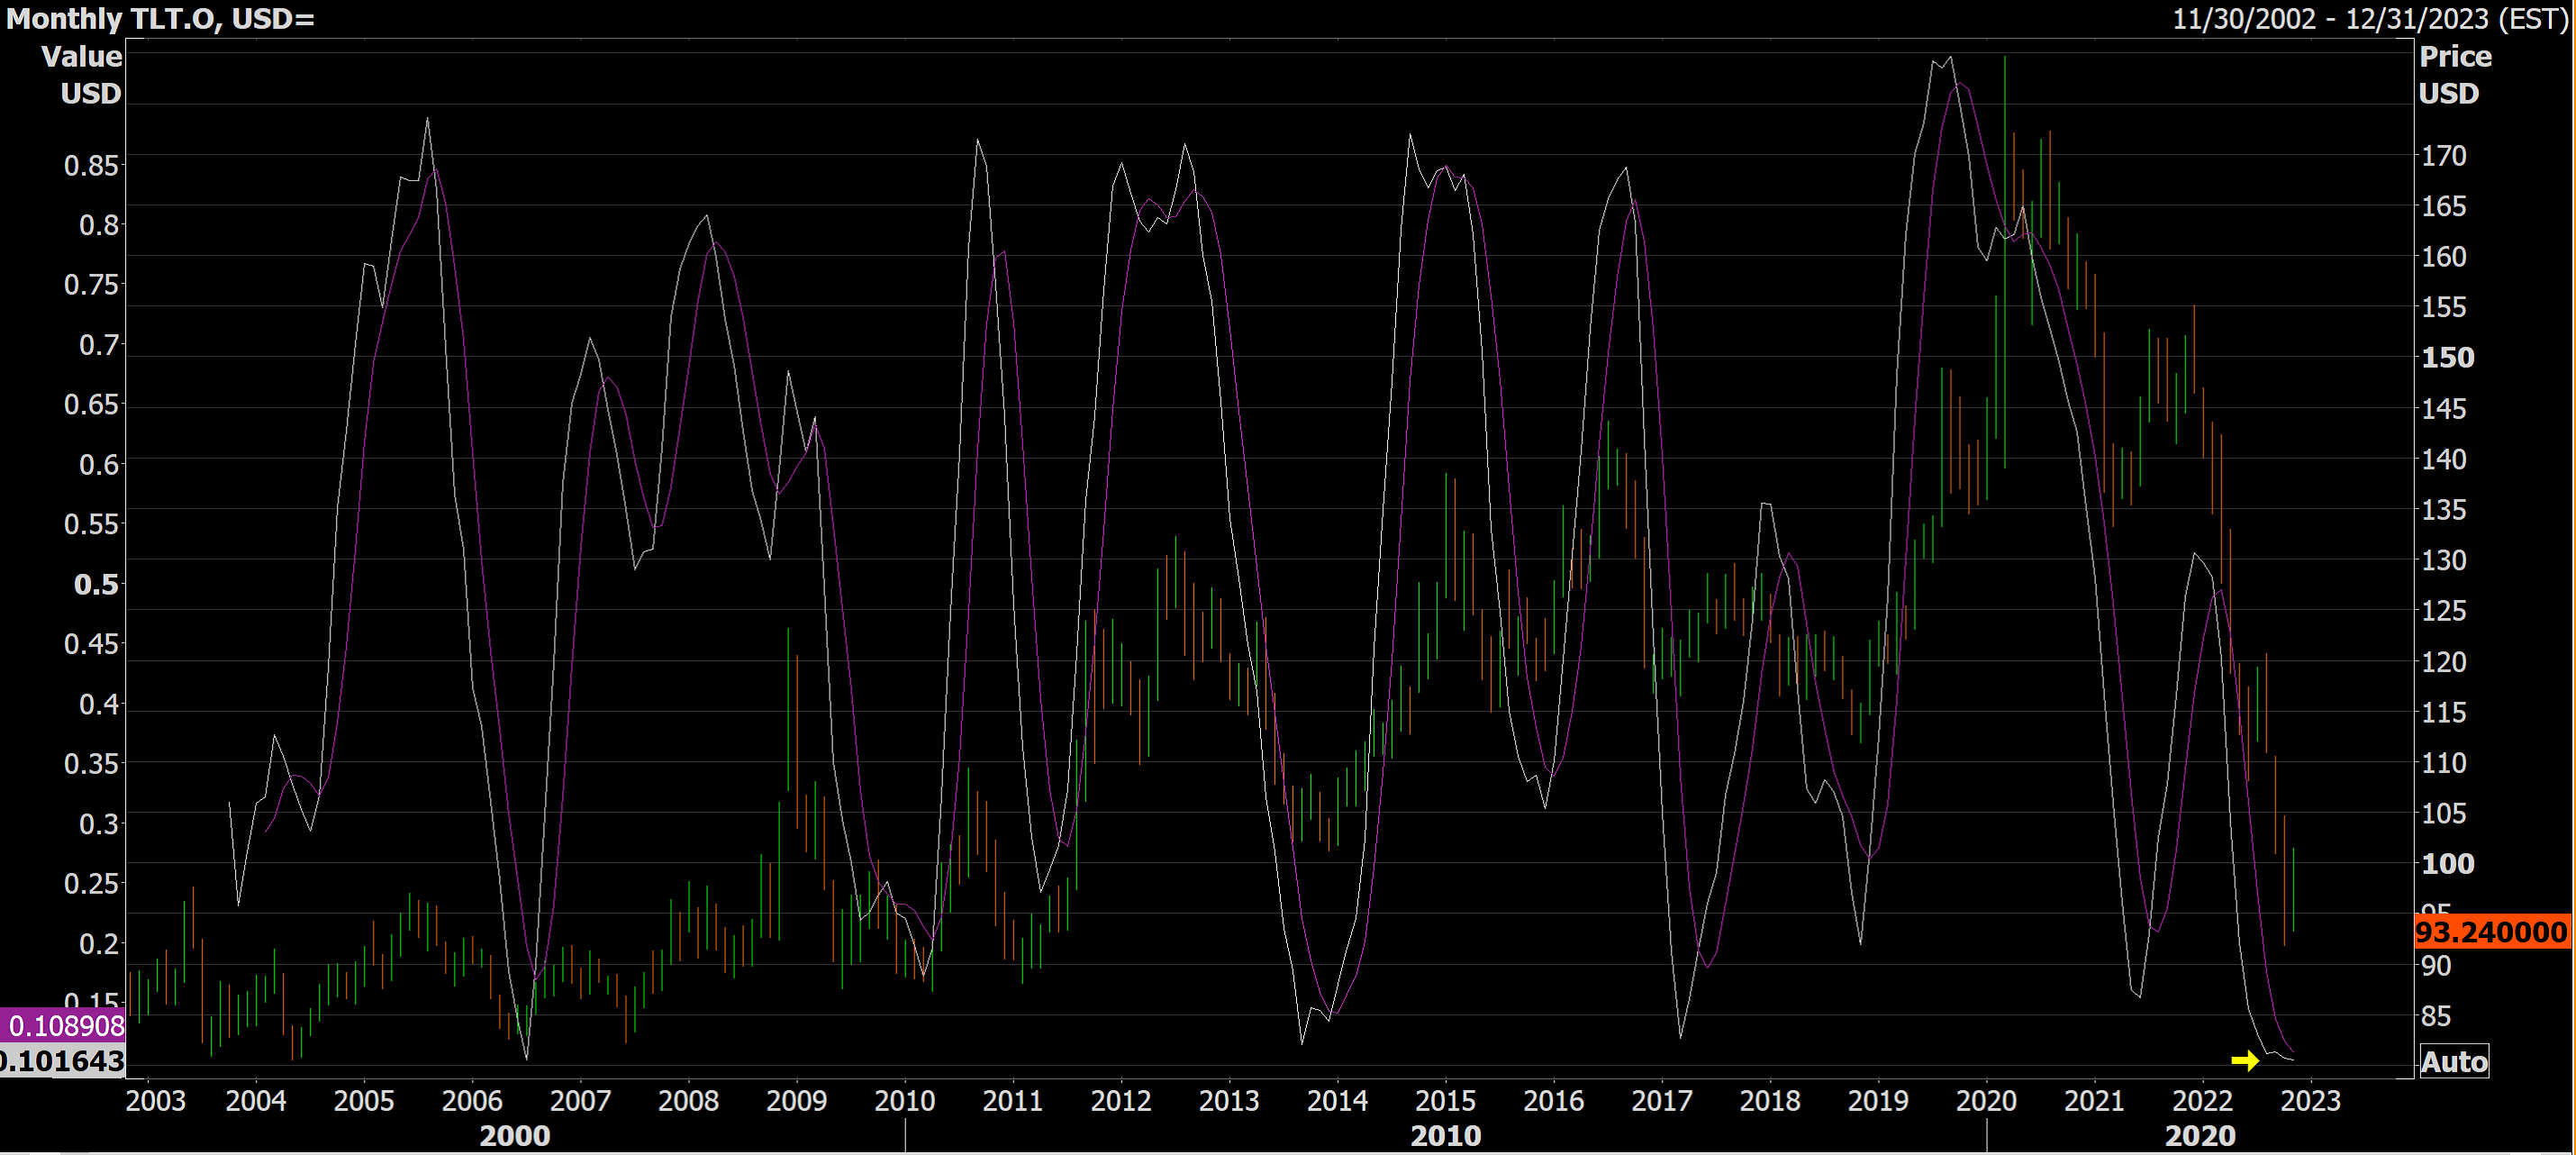
The white line on this 20-year chart is the very long-term or monthly oscillator
for TLT. When the white line falls down near the bottom of the chart, it indicates
that the worst-case scenario has been factored into current prices. When that
happens, it is a sign that prices cannot go down any more. Bond prices fall as
interest rates rise.
The small yellow arrow at the bottom right of the chart shows that the
oscillator has only been this low one other time in the last 20 years. In the past 20
years, the price of TLT has risen for at least six months every time the oscillator
has turned up from very low levels. This implies that interest rates should be in a
downward trend for at least six months once this oscillator turns up. The yellow
arrow points to the area showing that the oscillator appears to be on the verge of
turning up. It will be updated again on December 1st. The long-term or weekly
oscillator (as opposed to the very long-term or monthly oscillator shown above)
turned up three weeks ago and is already rising. Please see a chart of TLT from
WSJ below.
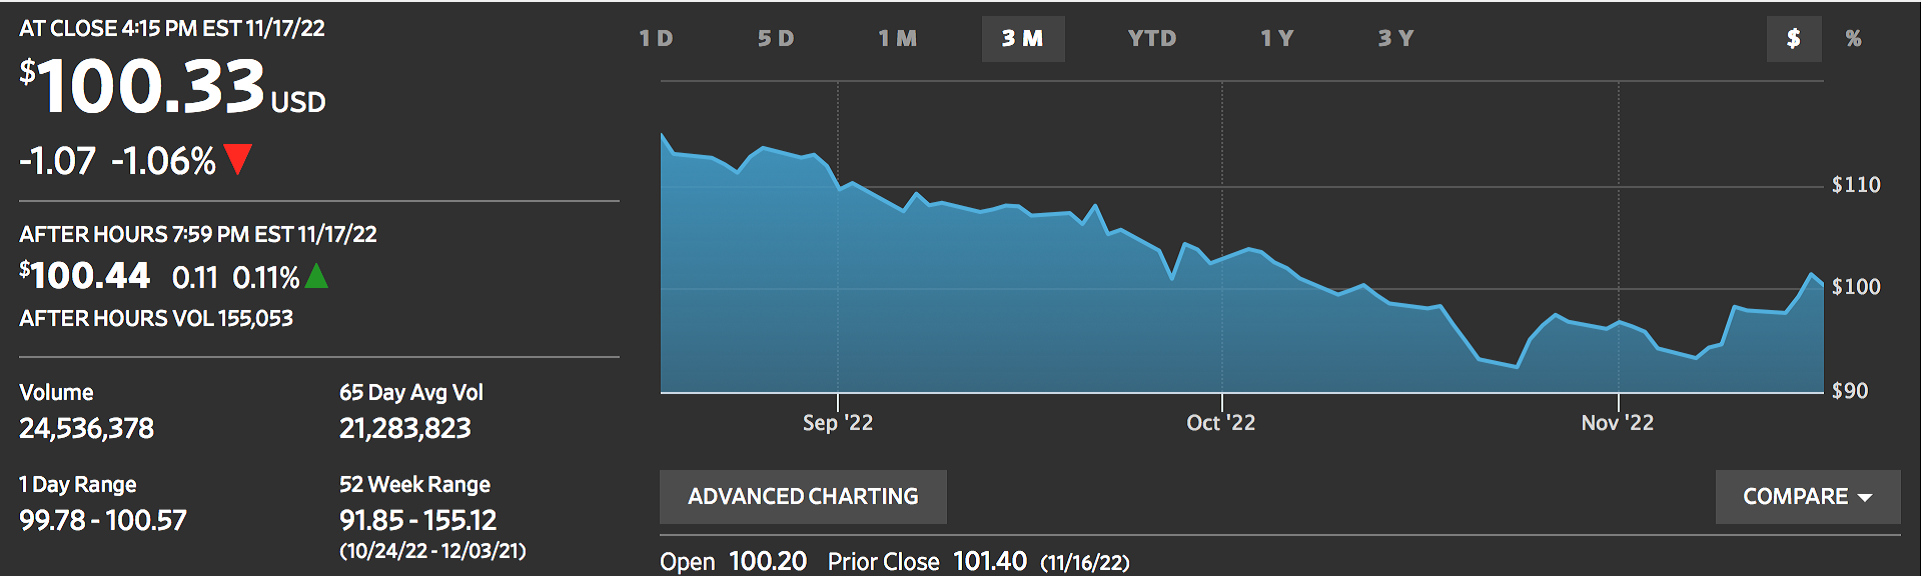
This bond ETF fell from a high of 155 in December 2021 to a low of $92 on
October 24th, a fall of 40.1%. Bonds have provided almost no return over the past
6 years, even after including interest payments. They did not help to reduce
volatility very much during this bear market either. You will notice that only a
miniscule amount of your portfolio, if any, has been invested in bonds for years
now. I have stayed away from bonds because we are six years into a 35-year
cycle of rising interest rates and inflation, which started in 2016.
This ETF has jumped from $92 to $100.33 in the last three weeks, a gain of $8
or 8.7%. The oversold condition of bonds and lower U.S. inflation data for four
months in a row is having a positive impact on the minds of bond investors.
Stock market investors have also indicated that the worst-case scenario has
already been factored into stock prices as of a month ago October 13, 2022. Since
then, the DJIA has produced the biggest monthly gain in October since January
1976. Last Thursday, U.S. stock markets had the biggest one-day gain since
prices started to recover from the Covid sell-off in April 2020. A rise of more
than 5% in one day, as was the case last Thursday, is very rare.
The bond market is ten times the size in dollar volume compared to the stock
markets. The behaviour of bond investors is confirming what stock investors have
been seeing over the last month. It is becoming clearer that a trend of lower U.S.
inflation is developing. This suggests that the need for higher interest rates is
diminishing. Almost every indicator, including the bond markets, are suggesting
that the worst of this bear market is behind us and that a new uptrend has started,
not only for stock prices, but bond prices as well. This suggests that we have
likely seen a peak in interest and mortgage rates even though the Fed may raise
interest rates once more in December.
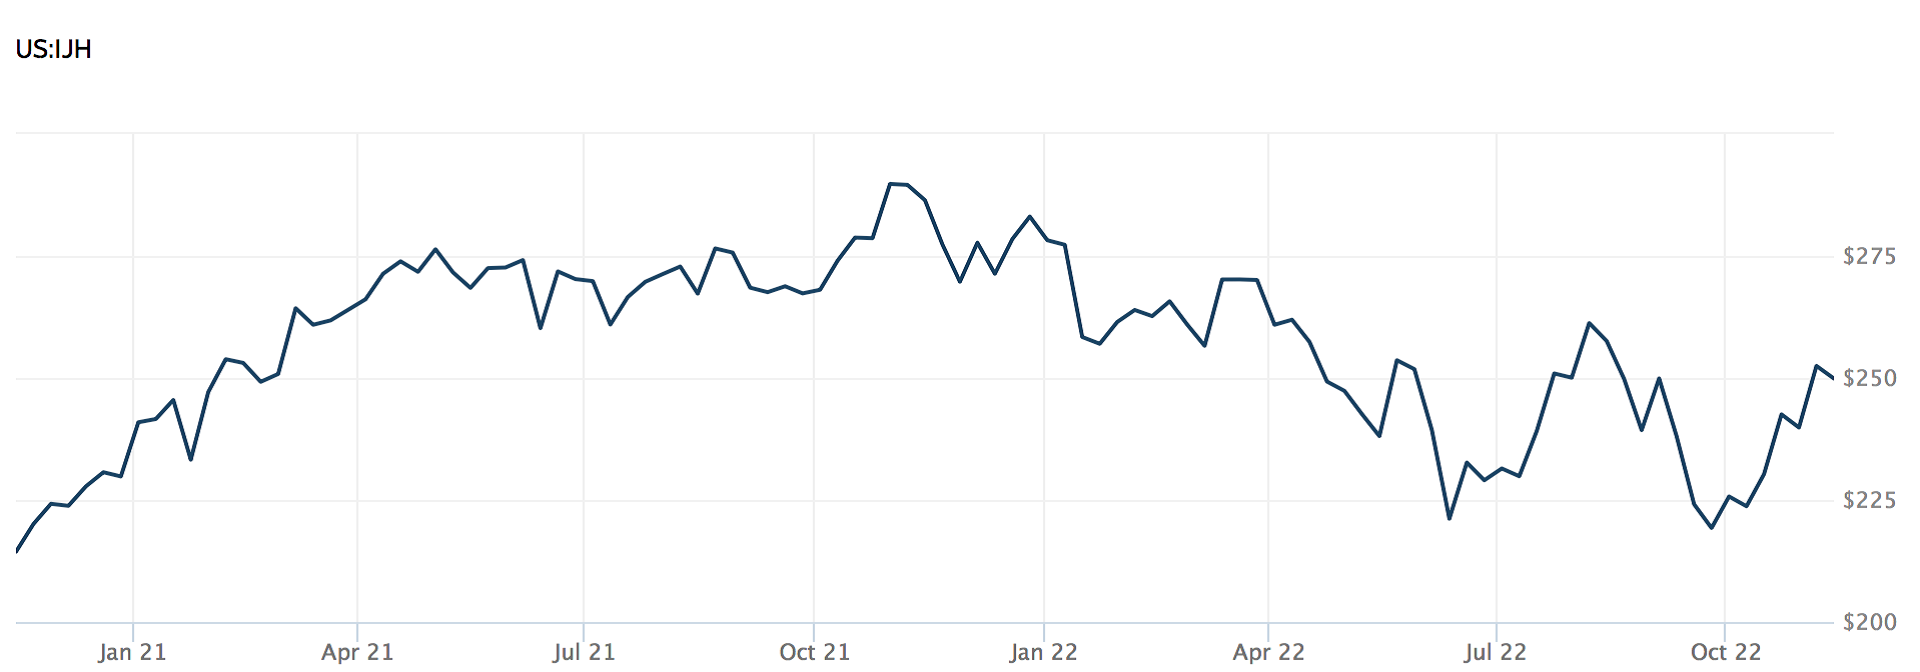
I have been recommending that investors have exposure to the relatively
unknown S&P 400 Index of U.S. mid-sized companies because they have
outperformed the S&P 500 by close to 3% per year since the inception of the S&P
400 in 1981. Mid-sized companies generally have more room to grow than large
companies. The S&P 400 has not been any more volatile than the S&P 500 on
average so there is no additional risk for higher returns.
The S&P 500 has been outperforming the S&P 400 in the last 2 years because
large technology companies have been doing very well since Covid. That has
changed this year as technology companies have sold off more than others.
The ETF that tracks the S&P 400 IJH is almost back to the price it traded at in
late January 2022. It is now down 13.8% from the peak in November 2021.
However, the US dollar has increased in value by 7.4% as well. Canadian
investors who own IJH are now down only 6.4% from the all-time highs.
The S&P 500 is down 17.8% from the peak in January 2022, down 4% more
than the S&P 400. The US dollar has risen 5.3% since the S&P 500 peaked which
means that the S&P 500 is down 12.5% from the high for a Canadian investor.
The S&P 500 is now down 4% more from the highs than the S&P 400. The S&P
400 is showing its value once again. The Dow Jones Industrial Average (DJIA) is
down 8.7% from the peak in early January and down a paltry 3.4% in Canadian
dollars. A lot of progress has been made in the last month. Thank you for your
patience, trust and confidence during this volatile year!

Aloha! I am writing this from Kauai, which is known as the garden island of
Hawaii. It is our favourite place to go to relax and decompress in the winter. I
don’t like to leave home much from April to October since I feel what I have near
me at home is hard to beat during those months.
The natural beauty is stunning along with a quieter lifestyle. No building is
allowed to be higher than a palm tree. There are good medical facilities and we
can trust the authorities. There are numerous empty beaches were we can swim,
paddleboard and snorkel with fish and sea turtles.
It is so nice to be able to travel like we used to before Covid. My wife and I
had this trip planned with our entire family in 2021 and in early 2022. It is finally
happening now with the rest of our immediate family and foster daughter hoping
to arrive tonight. Have a great weekend my friend!