

 Dow Has the Best Month Since 1976
The month of September is the only month of the year where stocks are
down, on average. The average loss is only a fraction of 1%. However, the
month of October is known as the bear killer. There have been some steep
declines in October. However, if stock prices have already experienced a
serious decline by the time October comes along, bear markets often
end in the last three weeks of October. Markets have been the strongest from
November 1st to May 1st. While we cannot create a forecast based only on
seasonal influences, most of the circumstances typically seen at the end of a bull
market were already appearing in late September. One major factor that was
missing was the second low of a double bottoming pattern.
This is why the title of the September 30, 2022 Update was: “Forget The
News. Investor Behaviour Will Likely Signal The End Of This Bear Market.” The
title of the October 8, 2022 Update was: “A Surprise Can Happen At Any
Moment.” The title of the October 14, 2022 Update was: “Stock Markets Are Like
A Coiled Spring.” It seemed to be the perfect setup for a key reversal day that
would enable stocks to put the second low into place.
Sure enough, just like clockwork, most stock prices hit the low point of this
bear market early on October 13th and then spiked much higher by the end of the
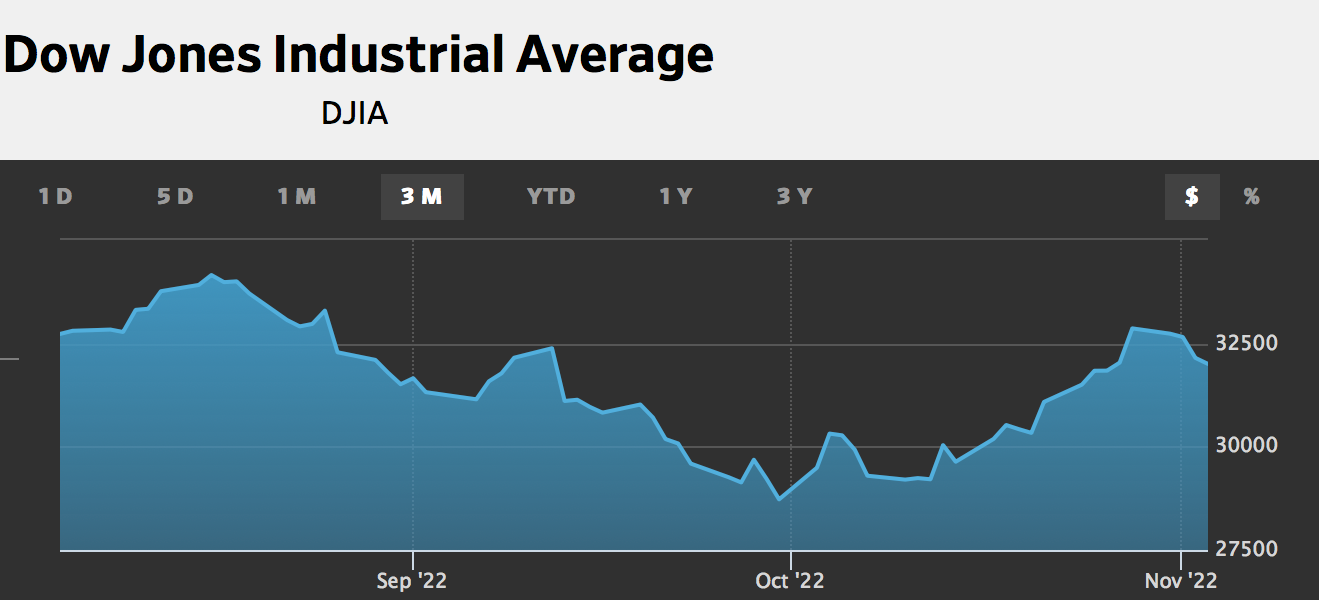
day, producing a key reversal day. The Dow Jones Industrial Average led the way
up after this day by rising 14% for the month of October, the largest monthly gain
since 1976. That was 46 years ago. (The DJIA is comprised of 30 of the largest
companies in the US.) Large companies are usually the first companies to advance
as they are regarded as the safest. The S&P 500 Index of 500 large U.S.
companies rose 8.0%, held back by weak technology companies. The S&P 400
Index, representing 400 U.S. mid-sized companies, rose 10.6% for the month. The
NASDAQ Index of U.S. technology companies rose by only 3.9%. Please see a 3-
month chart of the DJIA below. (From WSJ)
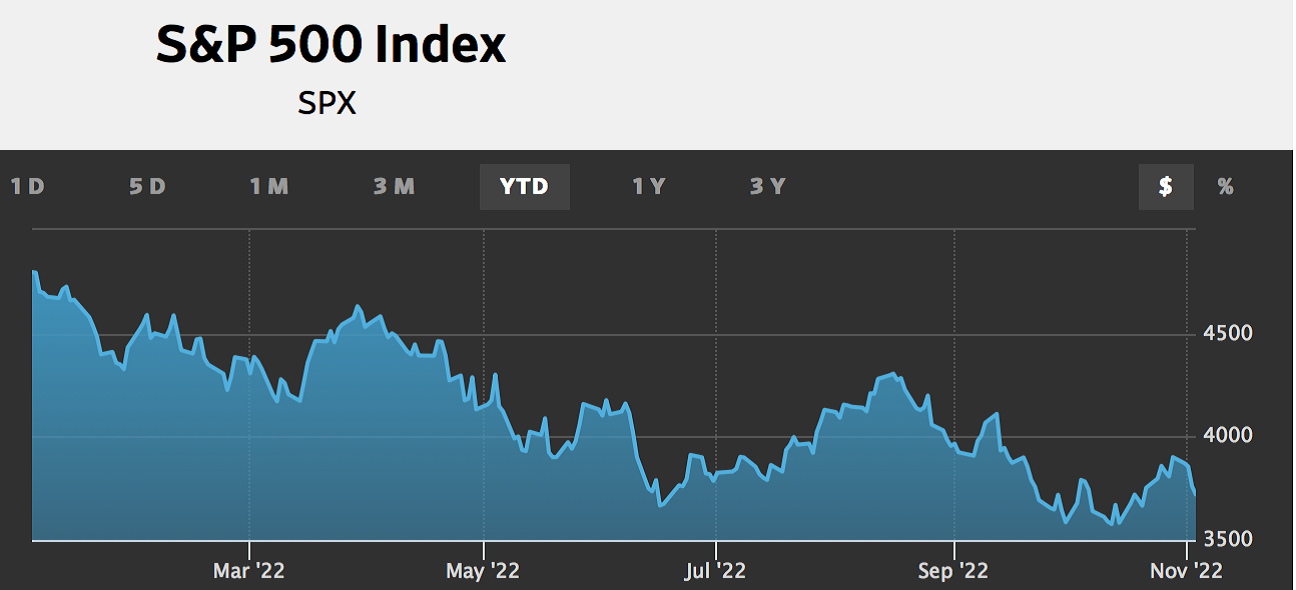
Please see the YTD chart of the S&P 500, which shows the double bottoming
pattern that investors typically create when a bear market ends. The first low was
in mid-June and the second and final low likely occurred on October 13th. The
double bottoming pattern shows the emotional process investors go through that
exhausts the selling pressure. This flushes out the stocks that is in weak hand,
thereby creating a solid foundation for prices to rise again. Never forget that stock
prices become more attractive to disciplined investors as they decline.
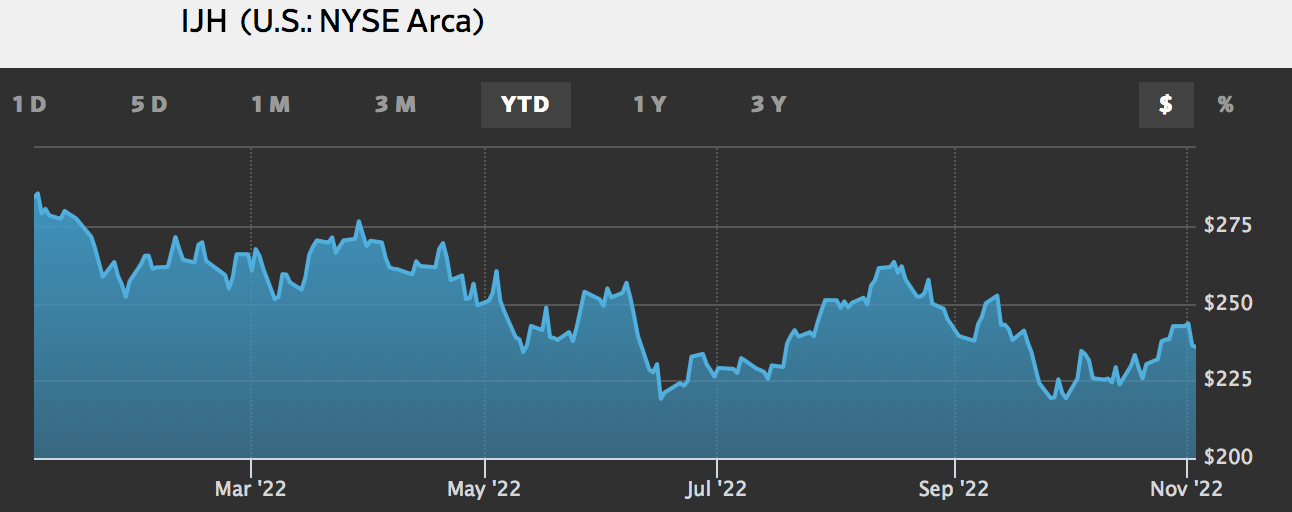
See the same pattern for this ETF representing the S&P 400 Index in the YTD
chart below.
See the YTD chart of the NASDAQ below. A double bottom also formed in
this Index once again, although the path is slightly different from the other market
averages.

I have observed that there are two levels of understanding the markets. The
basic level is thinking that whatever happens is random and that the reaction of
stock prices is based on day-to-day events. This is what I believed was the case in
the early years of my career with one exception. I watched one of the few
investing television programs in the later 1970’s, called Wall Street Week on PBS
every Friday evening. That program provided information from Investors
Intelligence showing that markets tended to peak when there was a great amount
of optimism and bottom when the level of pessimism was very high. Therefore,
right from the start, it was clear that what was going on in the minds of investors
and professional money managers was a consistent, critical factor for the trend of
stock prices.
We reach the second or advanced level of understanding when we realize that
the news is not as important as it seems. What is more important is how investors
are reacting to the news.
As the years rolled by, I observed that investors reacted in a similar way to
events even though the events were very different. This is because human nature
has not changed in thousands of years. Of course, I was not the first to realize this.
The study of these patterns of human behaviour is called technical analysis.
Technical analysis has been going on for many decades but it is not very popular.
That is because reading the news is more interesting to most than looking at a
chart. Looking at a chart is more interesting to me since that is what is most useful
for me to understand what is really happening in the markets. It is the best way for
me to create a forecast and a strategy for your portfolio.
As a case in point, the unusually strong gains last month did not happen
because of a major improvement in the circumstances of the economy or world
events. Stock prices jumped because the selling was exhausted. Last week’s
Update had a quote from an experienced market expert who could not understand
how stock prices could jump so much on October 13th because nothing had
changed. However, everyone who wanted to sell had sold. It was the most recent
example of when the worst-case scenario was being factored into current prices.
We arrive at the second level of understanding when we comprehend how markets
function.
I hear investors say that there is still too much uncertainty to invest in stocks.
The high level of uncertainty is why stock prices are down close to 20% from
their highs earlier this year. Prices usually rise as uncertainty wanes. Therefore,
the option is either to purchase when there is uncertainty and prices are cheap, or
wait for more positive developments to occur and buy at higher prices. We all
have to decide if our goal is to maximize gains or to be comfortable. These are the
options investors have to grapple with. Warren Buffett said, “Be fearful when
others are greedy and be greedy when others are fearful.” Well folks, this could
very well be a time to be greedy.
While almost all of the conditions have been met to end a bear market, I am
still watching for one more indicator to signal that the coast should be clear for a
new long-term uptrend to begin. What investors do with their money is much
more important than what I think investors should do or will do with their money.
This is just like how people vote in an election is more accurate than the opinion
of a political expert. This is why I try to only focus on indicators that give me
unbiased evidence of how investors are reacting in the marketplace.
There are indicators that have been extremely reliable in determining when a
new bull market that will last for at least a year has begun. These indicators show
us when the percentage of stocks in an uptrend drops to less than 20% and then
rises up above 20%. When this happens for the S&P 500 AND the Canadian TSX
Index, it has signalled the beginning of a new bull market almost every time since
the inception of these tools in early 1982. This indicator has now given a buy
signal for the S&P 500 as the percentage of stocks in an uptrend fell all the way to
5.4% on October 1st and has now risen to 22.31% as of November 1st. (This is
calculated at the start of every month.) This shows how vicious the selloff has
been.
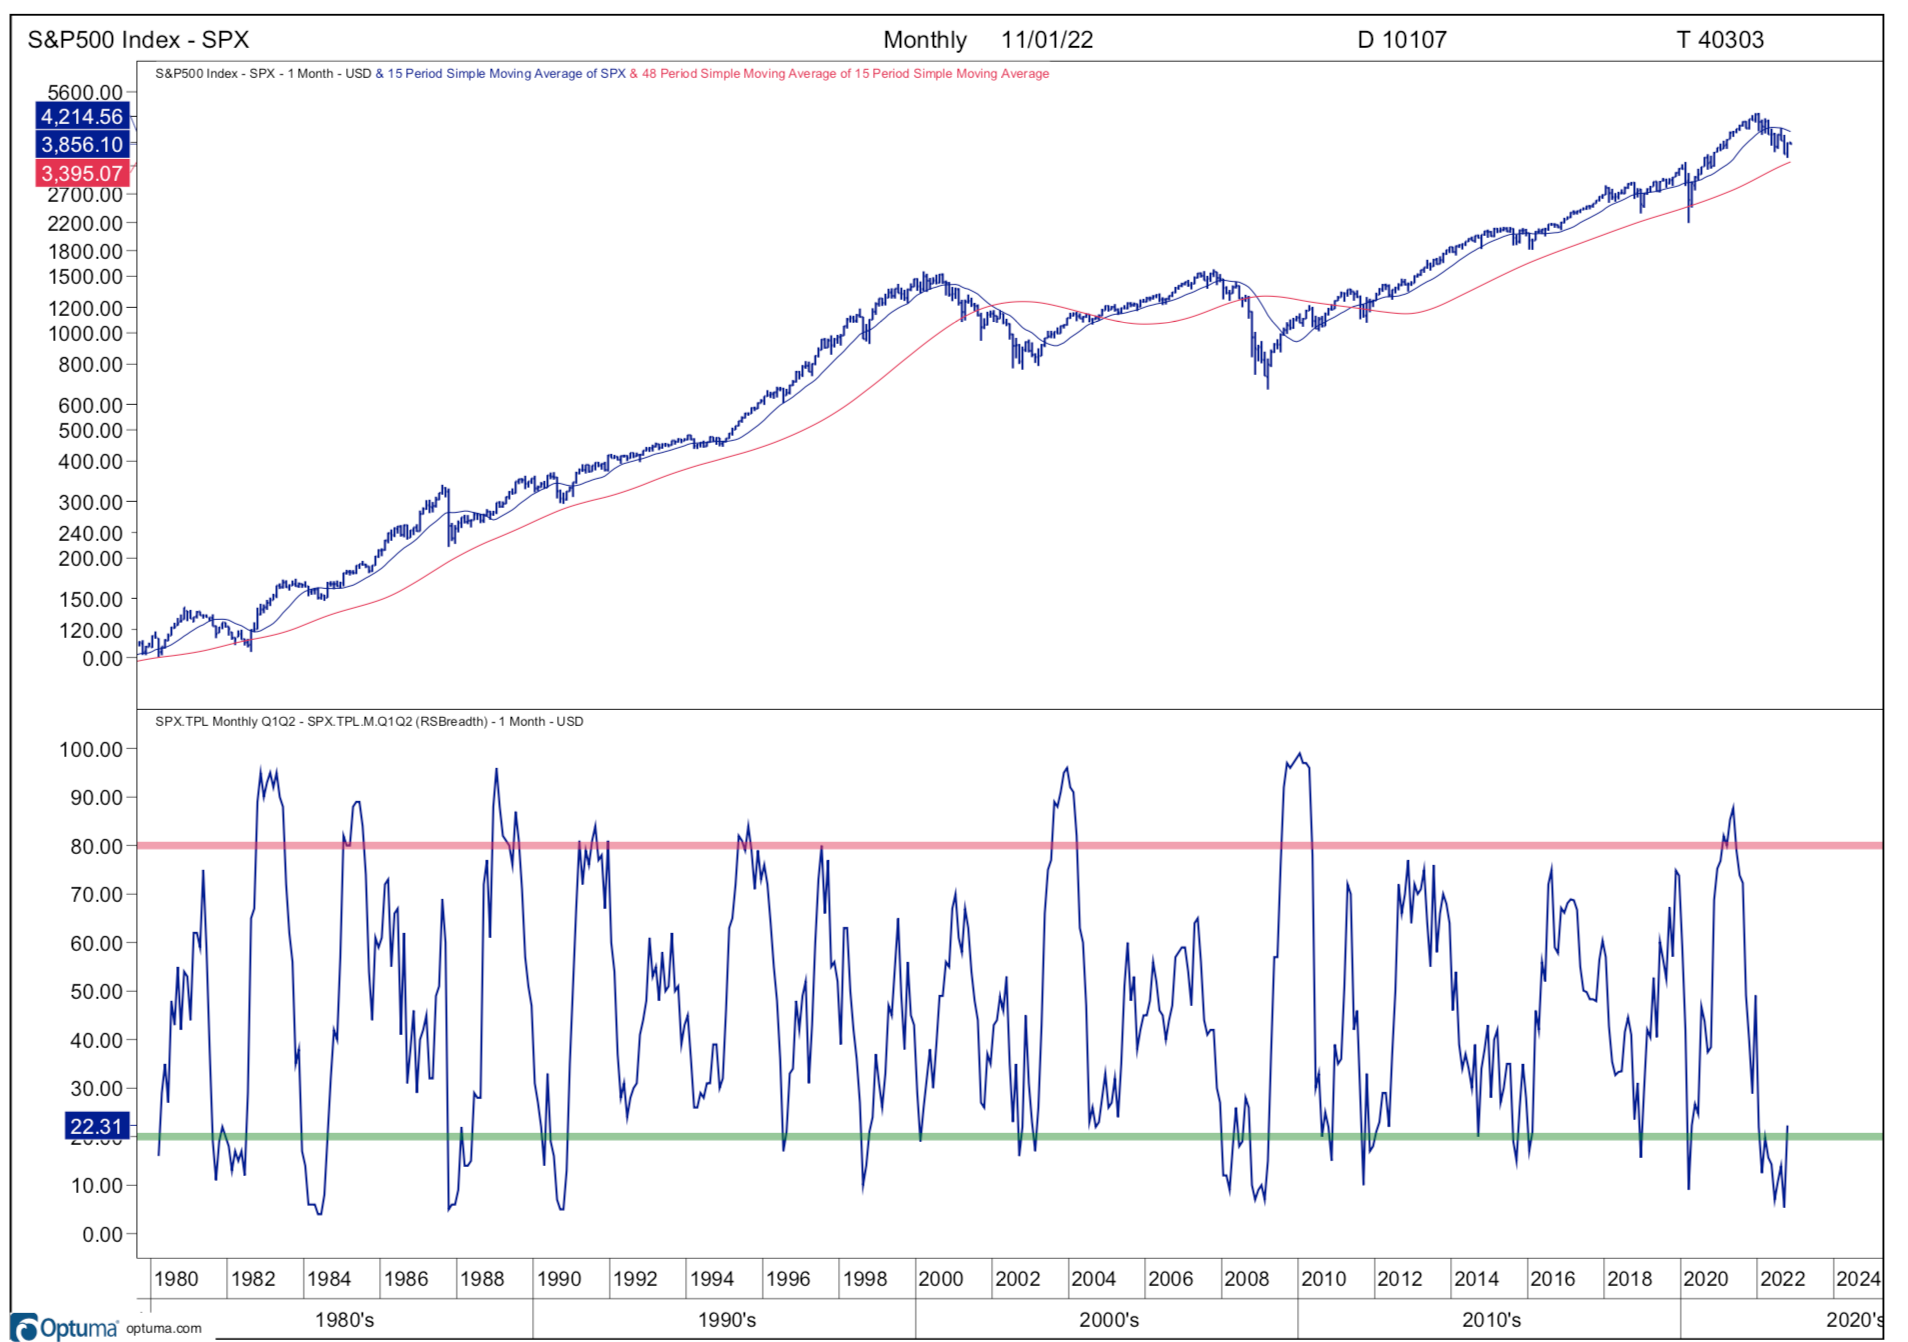
Please see when the blue line has fallen below the green line down to 5% and
then risen back above it to the 22.31 level, as shown on the left side. The green line
is the 20% level in this chart. Please see the chart of the same indicator for the TSX
below.
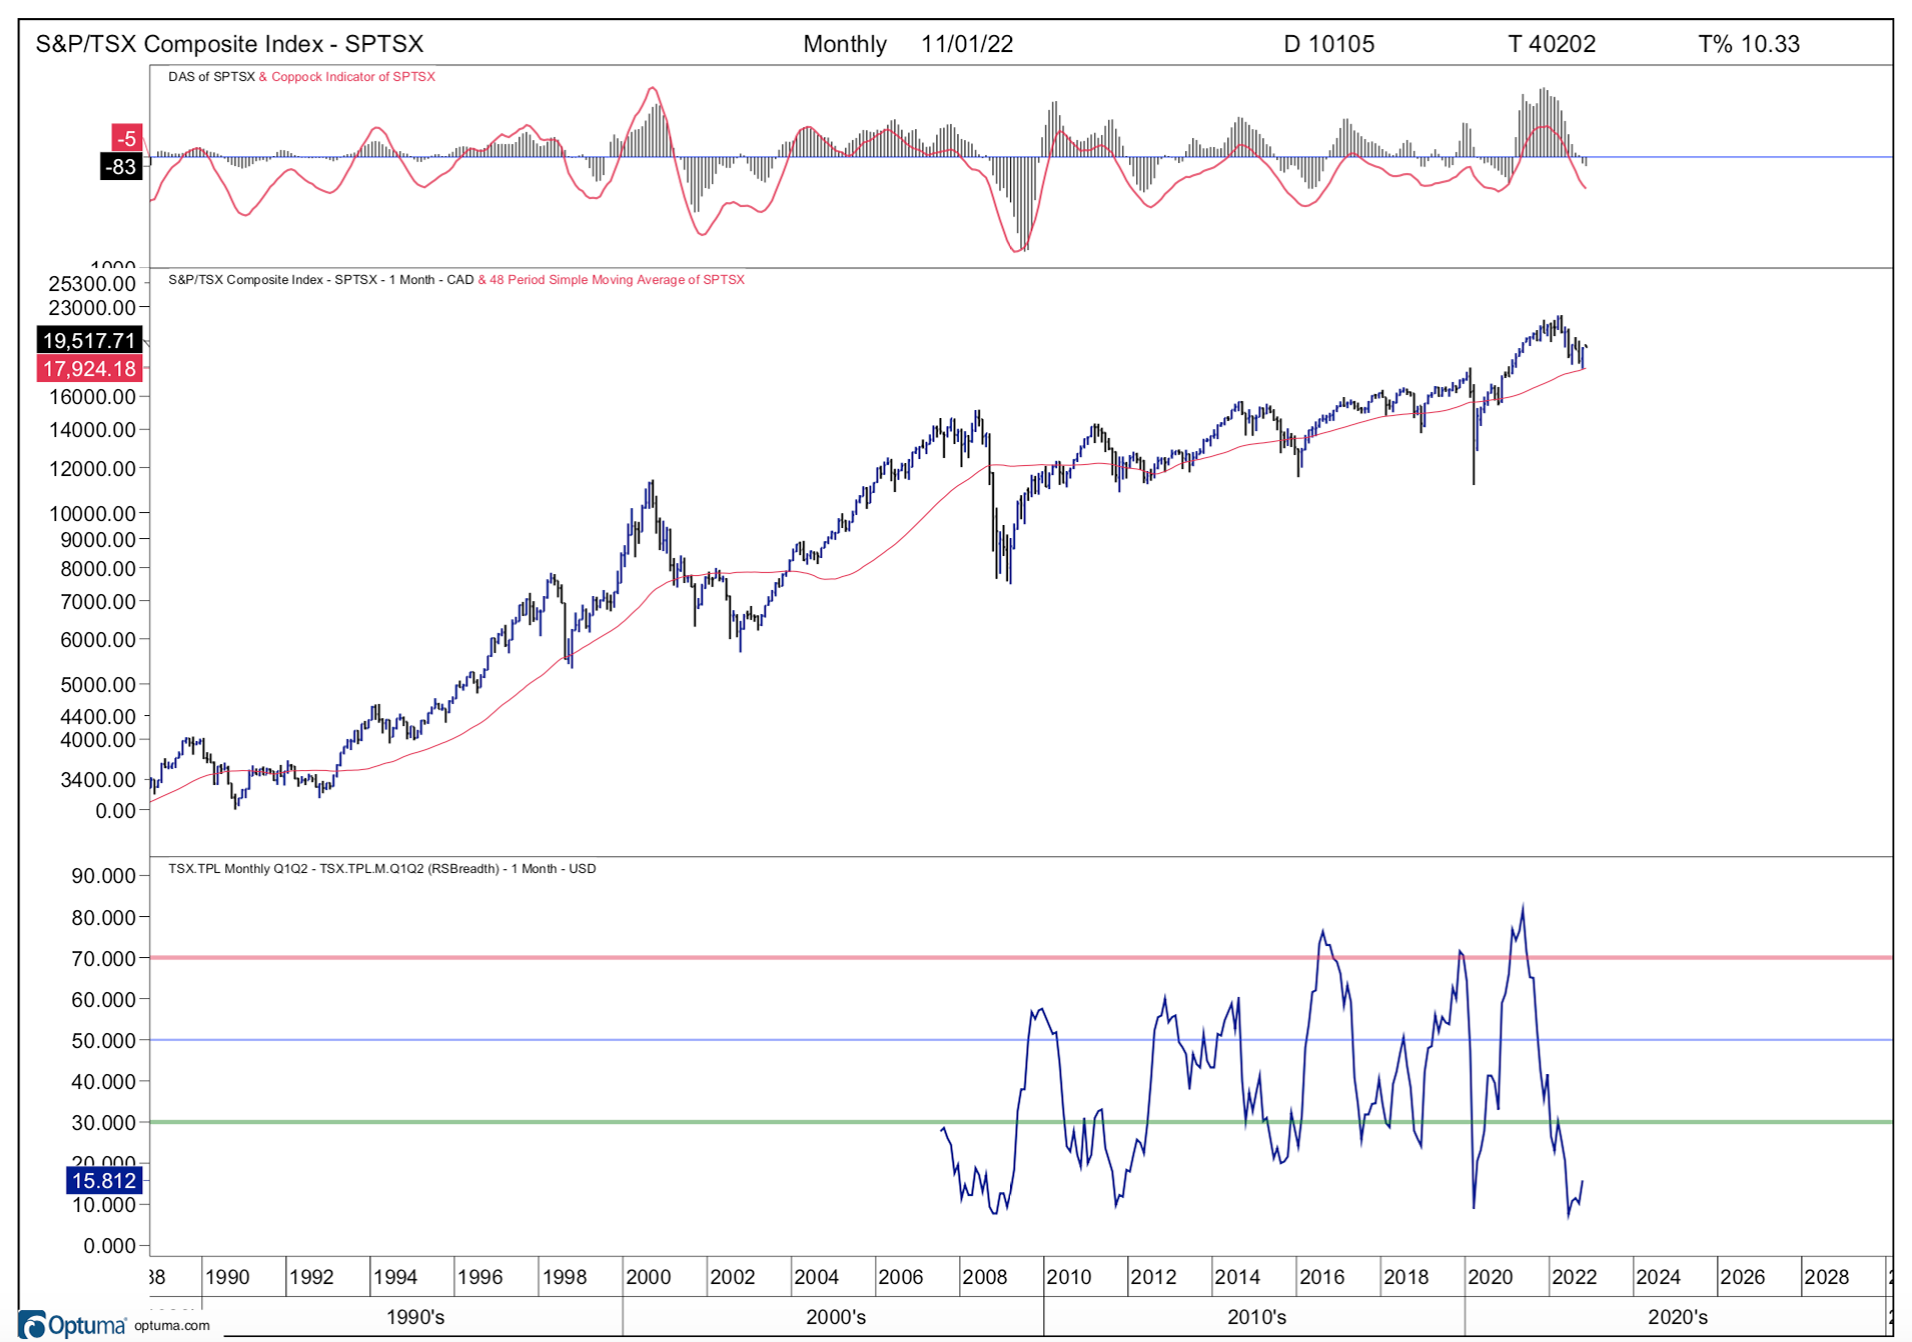
I have the track record in hard copy for this indicator for the TSX going back
to 1982 as well. Unfortunately this digital version only goes back to 2007. It is
important to know that the green line on this chart is at the 30% level, not the
20% level like it is on the S&P 500 chart.
The percentage of stocks in an uptrend for the TSX fell to 10% on October 1st
and has improved, but is only at the 15.8% level as of November 1st. That is just
shy of the 20% level that it needs to be in order to also give a buy signal that has
been accurate in the past. This does not mean that a new uptrend has not started.
It just means that I do not have the confidence to confirm that it has begun at this
time. If stock prices can continue to advance this month, it could well rise above
the 20% level for the TSX by December 1st. This is the discipline I use because it
has worked in the past. Therefore, I must respect it and follow it.
As the reaction in the stock markets since June has ticked off almost all of the
boxes to imply that the bear market is over, I believe it is prudent to invest close
to 65% of new funds added to accounts. Prices are also well below their highs
at this point so that makes them attractive. I would like to see more signs of
strength to be as certain as I can be that a new uptrend has started to invest all of
the cash. Either way, the fact that more than 20% of the stocks in the S&P 500 are
now in an uptrend is another very positive sign that this bear market has ended
and a new bull market could already be underway. More and more pieces are
falling into place to show us that the bear market could well be behind us.
So far, stock markets are following the typical action during a mid-term
election year in the U.S. The election result on November 8th may be less
important for stock markets than the fact that it will be over. Investors do not like
uncertainty. One more source of uncertainty will be removed after the election
next Tuesday. This could be beneficial for stock prices as well. Please see the
chart below produced by MarketWatch in July.

Please see the photo below.
 I always like going out with my grandchildren on Halloween. This is a photo of
my grandchildren who live close by trick or treating at my father’s house. My
father is 95 years old. Three of my grandchildren used to live in Boston but now
live in Saskatoon. We are never too old to have fun my friend!